. 2015 Nov 16;10(11):e0142400.
doi: 10.1371/journal.pone.0142400. eCollection 2015.

Essential Role of GATA2 in the Negative Regulation of Type 2 Deiodinase Gene by Liganded Thyroid Hormone Receptor β2 in Thyrotroph

Affiliations

Essential Role of GATA2 in the Negative Regulation of Type 2 Deiodinase Gene by Liganded Thyroid Hormone Receptor β2 in Thyrotroph

Hideyuki Matsunaga et al. PLoS One. .

Abstract

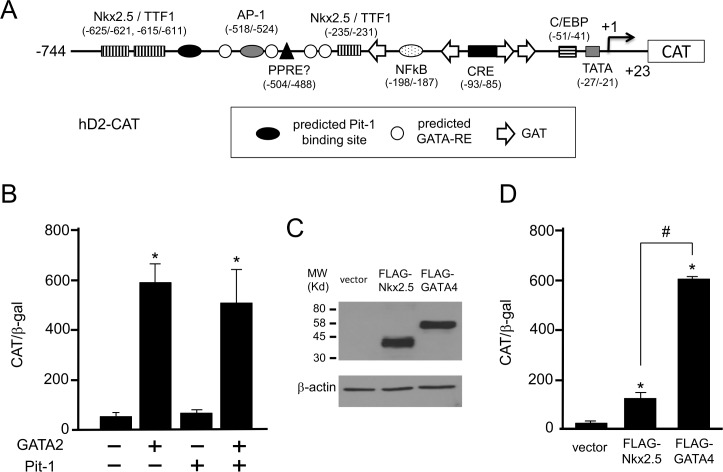
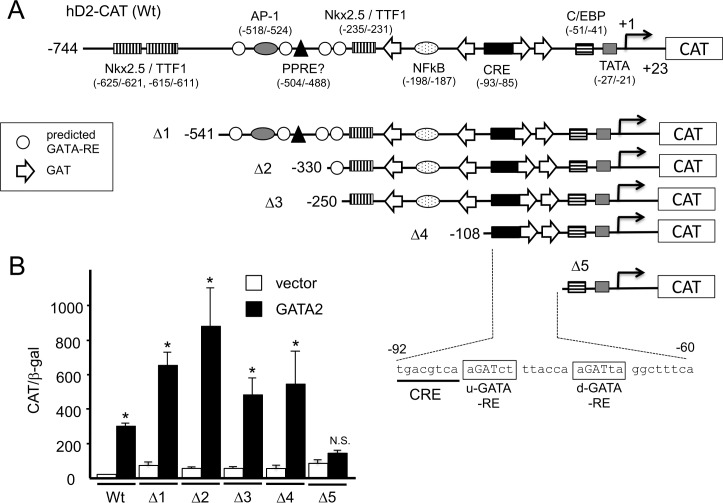
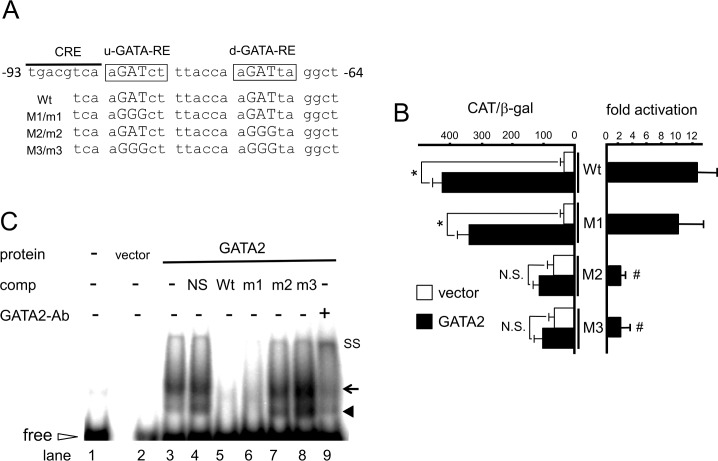
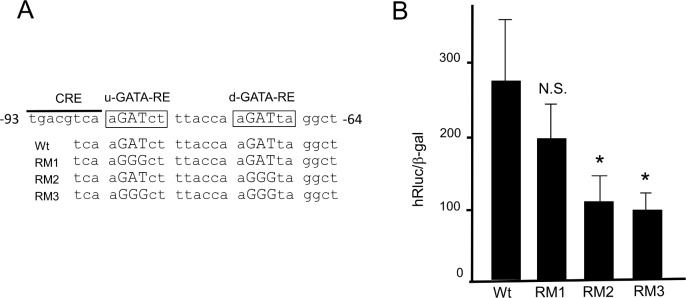
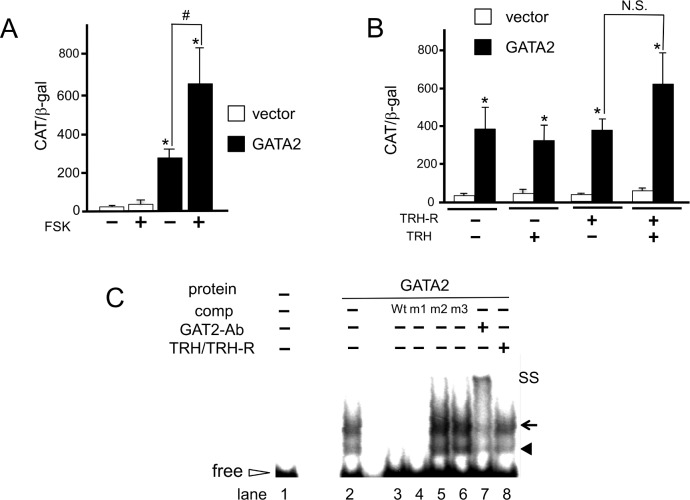
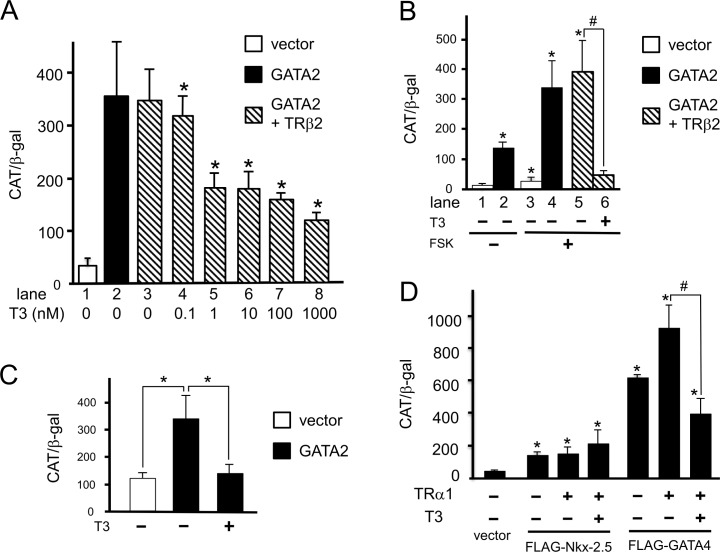
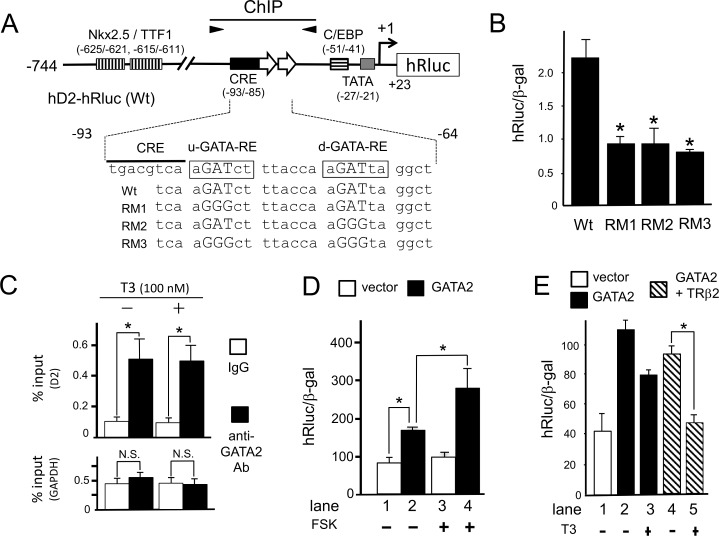
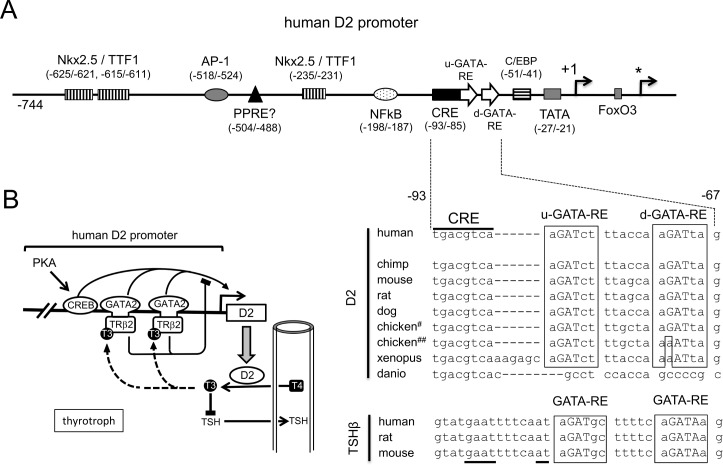
The inhibition of thyrotropin (thyroid stimulating hormone; TSH) by thyroid hormone (T3) and its receptor (TR) is the central mechanism of the hypothalamus-pituitary-thyroid axis. Two transcription factors, GATA2 and Pit-1, determine thyrotroph differentiation and maintain the expression of the β subunit of TSH (TSHβ). We previously reported that T3-dependent repression of the TSHβ gene is mediated by GATA2 but not by the reported negative T3-responsive element (nTRE). In thyrotrophs, T3 also represses mRNA of the type-2 deiodinase (D2) gene, where no nTRE has been identified. Here, the human D2 promoter fused to the CAT or modified Renilla luciferase gene was co-transfected with Pit-1 and/or GATA2 expression plasmids into cell lines including CV1 and thyrotroph-derived TαT1. GATA2 but not Pit-1 activated the D2 promoter. Two GATA responsive elements (GATA-REs) were identified close to cAMP responsive element. The protein kinase A activator, forskolin, synergistically enhanced GATA2-dependent activity. Gel-shift and chromatin immunoprecipitation assays with TαT1 cells indicated that GATA2 binds to these GATA-REs. T3 repressed the GATA2-induced activity of the D2 promoter in the presence of the pituitary-specific TR, TRβ2. The inhibition by T3-bound TRβ2 was dominant over the synergism between GATA2 and forskolin. The D2 promoter is also stimulated by GATA4, the major GATA in cardiomyocytes, and this activity was repressed by T3 in the presence of TRα1. These data indicate that the GATA-induced activity of the D2 promoter is suppressed by T3-bound TRs via a tethering mechanism, as in the case of the TSHβ gene.


Conflict of interest statement

Competing Interests: The authors have declared that no competing interests exist.

Figures

Fig 1
Fig 1. GATA2 and GATA4 but not Pit-1 activate the human D2 promoter.
(A) Schematic depiction of hD2-CAT. Various transcription factor recognition sites are indicated: Nkx-2.5/TTF-1, Nkx-2.5-binding site; PPRE?, putative peroxisome proliferator-activated receptor-responsive element. A Pit-1-binding site [38] and the four GATA-REs [15] predicted previously by computer search are indicated as a closed oval and open circles, respectively. The GAT sequences and their inverted sequences (ATC) are indicated as open arrows. The transcription start site is indicated as +1. (B) GATA2 but not Pit-1 transactivates hD2-CAT. Using the calcium phosphate method, CV1 cells at a density of 2×10⁵ cells per well of a six-well plate were transfected with hD2-CAT (2.0 μg) along with the expression plasmid for mouse GATA 2 (pcDNA3-mGATA2) and/or human Pit-1 (pCB6-hPit1). (C) Protein levels of FLAG-tagged GATA4 and FLAG-tagged Nkx-2.5 expression plasmids. CV1 cells in a 6 cm dish were transfected with an equal amount (5 μg/dish) of these expression plasmids. After incubation for 24 h, cells were harvested and subjected to western blot analysis with anti-FLAG antibody (upper panel) and anti-β-actin antibody (lower panel). (D) Activation of the human D2 promoter by FLAG-tagged GATA4 was more potent than that by FLAG-tagged Nkx-2.5. CV1 cells were transfected with hD2-CAT (2.0 μg) along with the equal amounts (0.4 μg/dish) of FLAG-tagged GATA4 or FLAG-tagged Nkx-2.5 expression plasmids. CAT activity for pCMV-CAT (5.0 ng/well) was taken as 100%. Data are expressed as the mean ± S.E. of at least three independent experiments. *, P<0.05 for vector vs. expression plasmids.
Fig 2
Fig 2. Deletion analysis of the human D2 promoter.
(A) A schematic representation of hD2-CAT (wild-type, Wt) and its deletion constructs (Δ1 to Δ5). (B) CV1 cells were transfected with 2.0 μg hD2-CAT (Wt), Δ1 to Δ5 along with 0.4 μg of pcDNA3-mGATA2. Open bars, empty vector; solid bars, pcDNA3-mGATA2. CAT activity for pCMV-CAT (5.0 ng/well) was taken as 100%. Data are expressed as the mean ± S.E. of at least three independent experiments. *, P<0.05 for the empty vector vs. pcDNA3-mGATA2.
Fig 3
Fig 3. GATA2 recognizes u- and d-GATA-REs in the D2 promoter.
(A) A schematic representation of GATA-REs (Wt) and their mutants (M1, M2 and M3 for CAT assay; m1, m2 and m3 for gel shift assay). Two GAT sequences (open arrows) immediately downstream to CRE are designated hereafter as u- and d-GATA-RE. The sequences of wild-type (Wt) and its mutant (M1/m1, M2/m2 and M3/m3) are indicated. (B) Mutation analysis of hD2-CAT. CV1 cells were transfected with 2.0 μg hD2-CAT (Wt) or mutants (M1, M2 and M3; Fig 3A) along with 0.4 μg pcDNA3-mGATA2. Open bars, empty vector; solid bars, pcDNA3-mGATA2. CAT activity for pCMV-CAT (5.0 ng/well) was taken as 100%. Data are expressed as the mean ± S.E. of at least three independent experiments (left panel). *, P<0.05 for the empty vector vs. pcDNA3-mGATA2. To calculate fold activation (right panel), CAT activity with GATA2 was divided by that without GATA2. #, P<0.05 for hD2-CAT (Wt) vs. mutants. N.S., statistically not significant. (C) Gel shift assay using radiolabeled DNA probe containing u- and d-GATA-REs (Wt) or its mutants, m1, m2 and m3 (Fig 3A) with nuclear extract from CV1 cells transfected with pcDNA3-mGATA2. Solid arrowhead, GATA2 monomer; arrow, GATA2 dimer; open arrowhead, free probe; SS, super shift of GATA2 by the anti-GATA2 antibody.
Fig 4
Fig 4. Activation of human D2 promoter by GATA2 or GATA3 endogenously expressed in choriocarcinoma-derived JEG3 cells.
(A) A schematic representation of GATA-REs and their mutants (RM1, RM2 and RM3). (B) Using the calcium phosphate method, 2.0 μg hD2-hRluc and its mutants (M1, M2 and M3) were transfected into JEG3 cells. *, P<0.05 for hD2-hRluc (Wt) vs. mutants. The results are means ± S.E. for three independent experiments. pGL4.74[hRLuc/TK] (2.0 μg/well) was used as the inter-assay control and its expression level was adjusted to a value of 100.
Fig 5
Fig 5. Effects of PKA and PKC signaling on GATA2-induced D2 promoter activity.
(A) The hD2 promoter is synergistically activated by GATA2 and PKA signaling. A CAT-reporter assay was performed as described in Fig 1B in the presence or absence of forskolin (FSK) (10 μM). CAT activity for pCMV-CAT (5.0 ng/well) was taken as 100%. Data are expressed as the mean ± S.E. of at least three independent experiments. *, P<0.05 for the empty vector vs. pcDNA3-mGATA2. (B) TRH-R signaling has modest effect on GATA2-induced transcription of the human D2 promoter. After CV1 cells were transfected with 2.0 μg hD2-CAT along with 0.4 μg pcDNA3-mGATA2 and expression plasmid for TRH-R, cells were incubated with 100 nM TRH for an additional 24 h. *, P<0.05 for the empty vector vs. pcDNA3-mGATA2. N.S., statistically not significant. (C) A Gel-shift assay was performed as described in Fig 3C. Solid arrowhead, GATA2 monomer; arrow, GATA2 dimer; open arrowhead, free probe; SS, super-shift of GATA2 by the anti-GATA2 antibody.
Fig 6
Fig 6. T3-bound TRs negatively regulate the human D2 promoter activity induced by GATAs.
(A) Using the calcium phosphate method, 2.0 μg hD2-CAT (wild-type) was transfected into CV1 cells along with the expression plasmids for TRβ2 (0.2 μg) and GATA2 (0.1 μg). *, P<0.05 for T3 (-) vs. T3 (+). (B) The inhibition by T3-bound TRβ2 is dominant over the synergism between GATA2 and PKA signaling. *, P<0.05 for vehicle (lane 1) vs. forskolin (FSK) and/or GATA2. #, P<0.05. (C) Using lipofection, hD2-hRluc (wild-type) was transfected into GH3 cells along with the expression plasmid for GATA2 (0.1 μg) as described in Fig 4. *, P<0.05. (D) Transactivation by GATA4 but not Nkx-2.5 was repressed by T3-bound TRα1. Using the calcium phosphate method, 2.0 μg hD2-CAT (wild-type) was transfected into CV1 cells along with the expression plasmid for TRα1 (0.2 μg), FLAG-tagged Nkx-2.5 (0.1 μg) or FLAG-tagged GATA4 (0.1 μg). *, P<0.05 for the empty vector vs. pcDNA3-mGATA2. #, P<0.05. for T3 (-) vs. T3 (+).
Fig 7
Fig 7. Involvement of GATA2 in T3 negative regulation in the thyrotroph cell line, TαT1.
(A) A schematic representation of hD2-hRluc (wild-type, Wt) and its mutants. (B) The hD2 promoter is activated by endogenous GATA2 via u- and d-GATA-REs. Using the lipofection method, 2.0 μg hD2-hRluc and its mutants (RM1, RM2 and RM3) were transfected into TαT1 cells. *, P<0.05 for hD2-hRluc (Wt) vs. mutants. (C) In the absence or presence of 100 nM T3, ChIP assay was performed in TαT1 cells using an antibody against GATA2 or control mouse IgG. Immuno-precipitated chromatin fragments were amplified by PCR with primers for the mouse promoter. The positions of primers in the mouse D2 gene that correspond to the position of the human D2 gene are indicated by closed arrowheads in (A). Left panel, mouse D2 gene; right panel, mouse glyceraldehyde 3-phosphate dehydrogenase (GAPDH) gene. The signals were measured by quantitative real-time PCR. The values are expressed as percentages relative to the levels with anti-GATA2 antibody at 1 h. *, P<0.05. N.S., not significant. (D) After TαT1 cells were transfected with hD2-hRluc along with or without pcDNA3-mGATA2, the cells were incubated in the presence or absence of 10 μM forskolin for an additional 24 h. *, P<0.05. pGL4.74 [hRLuc/TK] (2.0 μg/well) was used as the inter-assay control and its expression level was adjusted to a value of 100. (E) After TαT1 cells were transfected with hD2-hRluc along with or without pcDNA3-mGATA2 and/or pCMX-rTR2, the cells were incubated in the presence or absence of 1 μM T3 for an additional 24 h. *, P<0.05. The results are means ± S.E. for three independent experiments. pGL4.74 [hRLuc/TK] was used as the inter-assay control and its expression level was adjusted to a value of 100.
Fig 8
Fig 8. (A) Schematic depiction of the human D2 promoter and difference in the GATA-RE sequences between the D2 gene and TSHβ gene. The promoter structure and the position of the TSS (+1) are based on the reviews by Bianco et al. [8] and Gereben et al. [16]; however, Dentice et al. [66] later reported that FoxO3 activates transcription from another downstream TSS (*). The DNA sequences of u- and d-GATA-REs are conserved among species except for zebra fish (Danio rerio). While one report (Accession AB307676) suggests d-GATA-RE is conserved in chicken (#), another does not (##) [16]. The Pit-1-biding sequence in the TSHβ gene was underlined. (B) Tethering model of T3-dependent negative regulation of the human D2 gene in thyrotrophs.
The Zn-finger domain of GATA2 associates with TRβ2-DBD via a protein–protein interaction. In the presence of T3, TRβ2 interferes with the transactivation function of GATA2. The current study predicts a similar molecular mechanism in the negative regulation of the D2 gene by T3 in cardiomyocytes. The inhibition by T3 is dominant over the synergism between GATA2 and PKA signaling via CREB. After pre-existing D2 enzyme converts T4 to T3, the influence of de novo generated T3 is blunted owing to the reduction of D2 expression by T3. Thus, the T3 produced by D2 in thyrotrophs may reflect the real-time level of T4, which is taken up by thyrotrophs from circulating blood.

Similar articles

Cited by

References

    1. Sasaki S, Matsushita A, Nakamura H (2011) Negative regulation of the thyrotropin beta gene by thyroid hormone. Contemporary Aspects of Endocrinology, InTech http://www.intechopen.com/books/contemporary-aspects-of-endocrinology: pp. 101–138.
    1. Gereben B, Zavacki AM, Ribich S, Kim BW, Huang SA, Simonides WS, et al. (2008) Cellular and molecular basis of deiodinase-regulated thyroid hormone signaling. Endocr Rev 29: 898–938. 10.1210/er.2008-0019 - DOI - PMC - PubMed
    1. Bianco AC, Kim BW (2012) Intracellular pathway of iodothyronine metabolism/implicatins of deiodination for thyroid hormone action. Werner & Ingbar's The Thyroid: A Fundamental and Clinical Text 10th Edition: 103–126.
    1. Koenig RJ, Leonard JL, Senator D, Rappaport N, Watson AY, Larsen PR (1984) Regulation of thyroxine 5'-deiodinase activity by 3,5,3'-triiodothyronine in cultured rat anterior pituitary cells. Endocrinology 115: 324–329. - PubMed
    1. Itagaki Y, Yoshida K, Ikeda H, Kaise K, Kaise N, Yamamoto M, et al. (1990) Thyroxine 5'-deiodinase in human anterior pituitary tumors. J Clin Endocrinol Metab 71: 340–344. - PubMed

Publication types

MeSH terms

LinkOut - more resources