. 2015 Dec;17(12):1523-35.
doi: 10.1038/ncb3264. Epub 2015 Nov 16.

The metabolome regulates the epigenetic landscape during naive-to-primed human embryonic stem cell transition

Affiliations

The metabolome regulates the epigenetic landscape during naive-to-primed human embryonic stem cell transition

Henrik Sperber et al. Nat Cell Biol. 2015 Dec.

Abstract

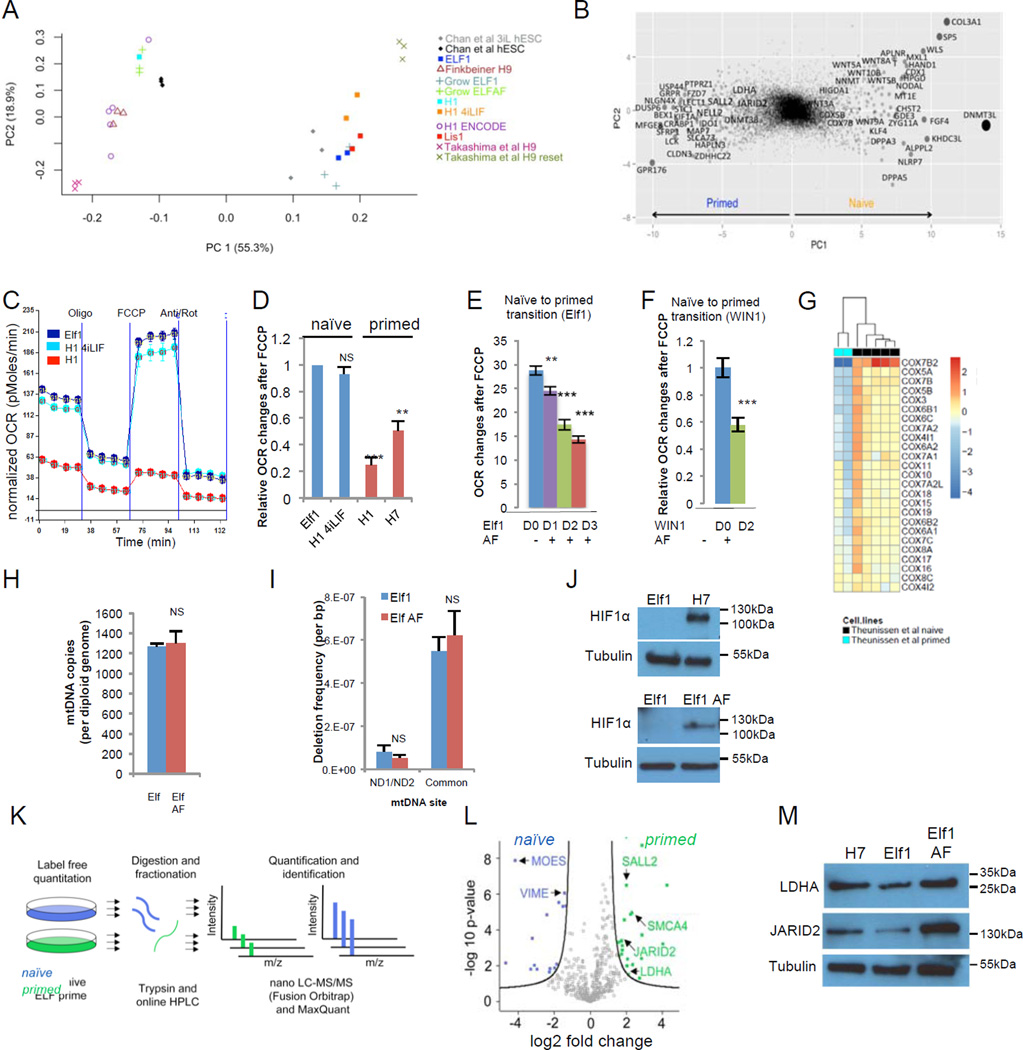
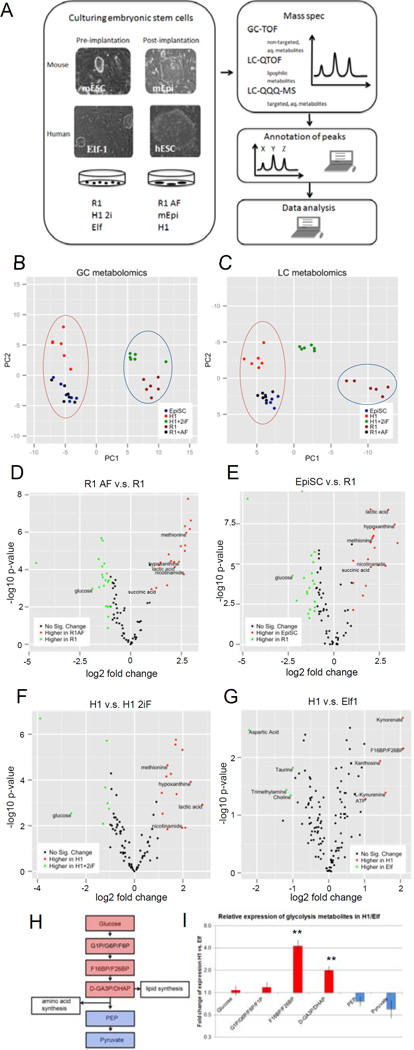
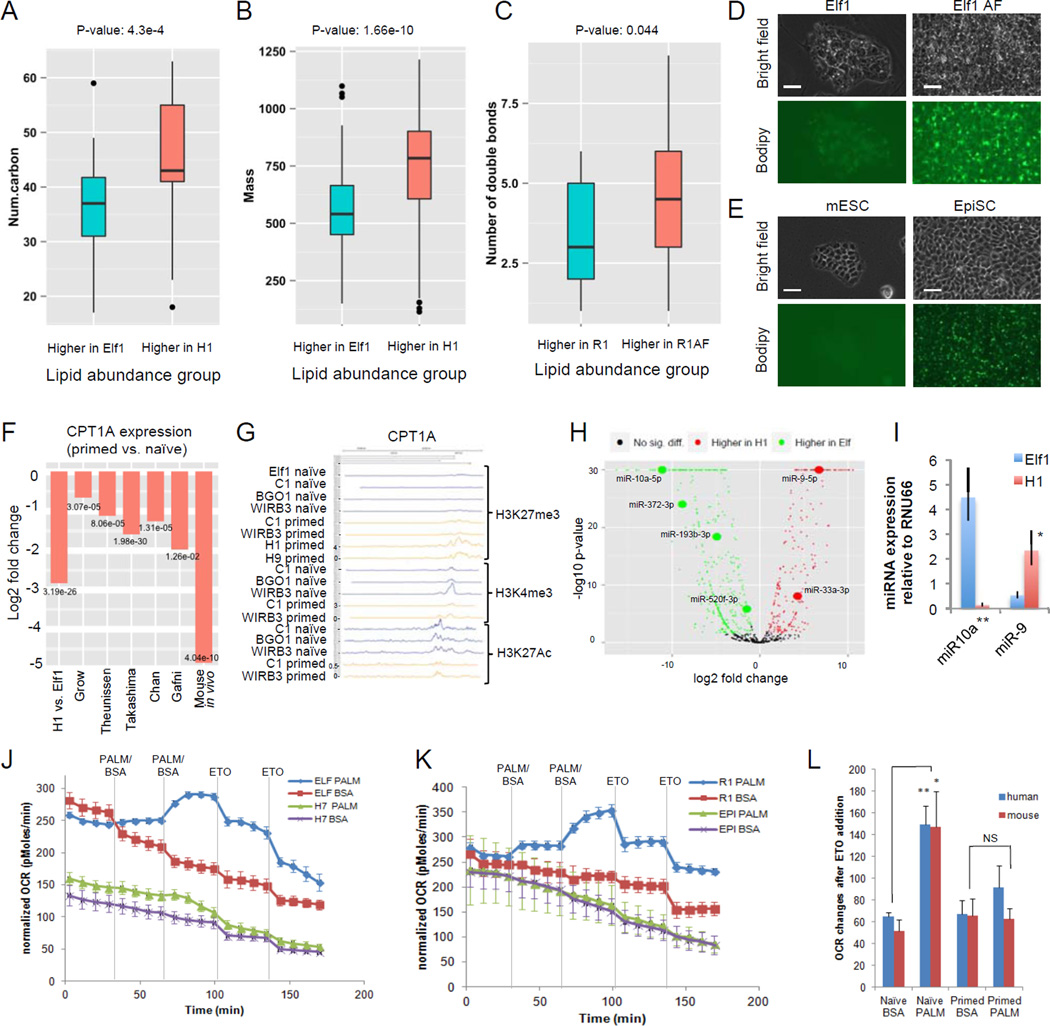
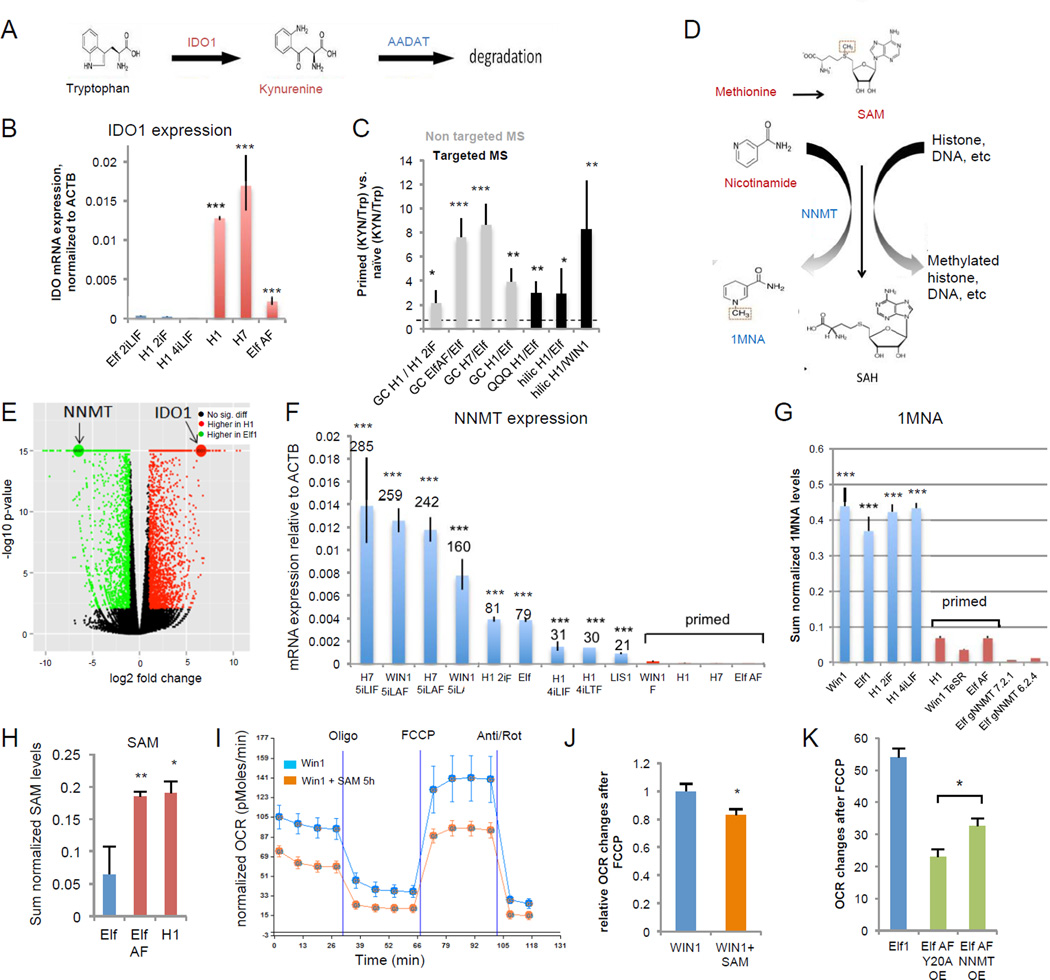
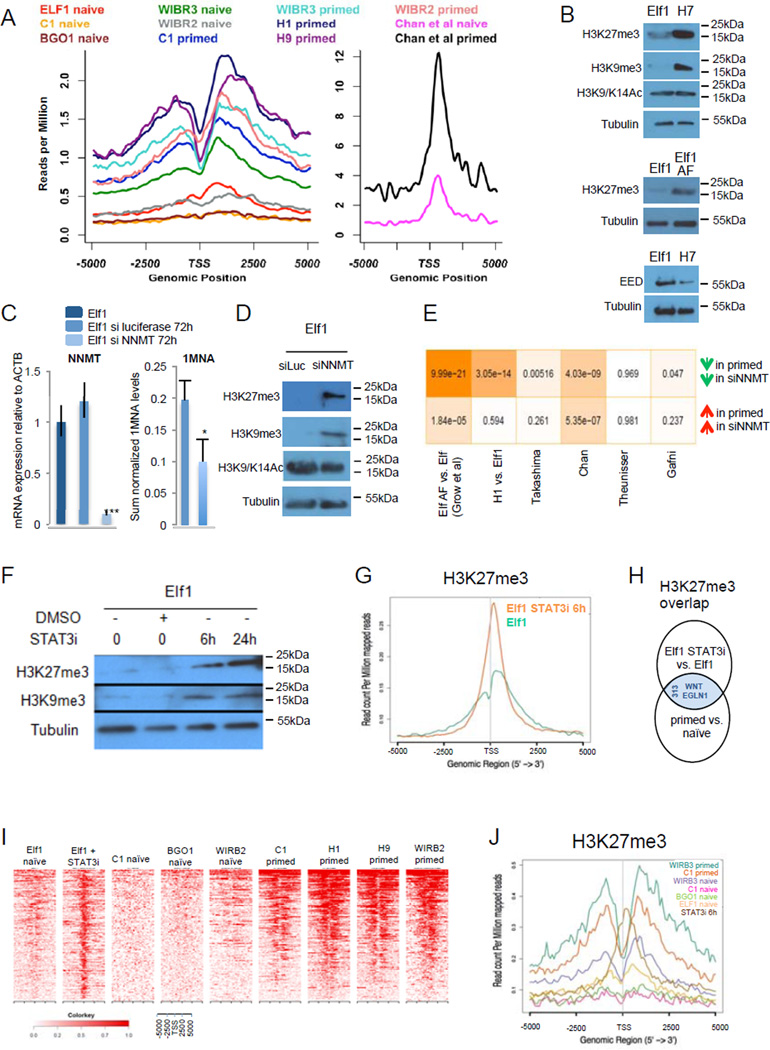
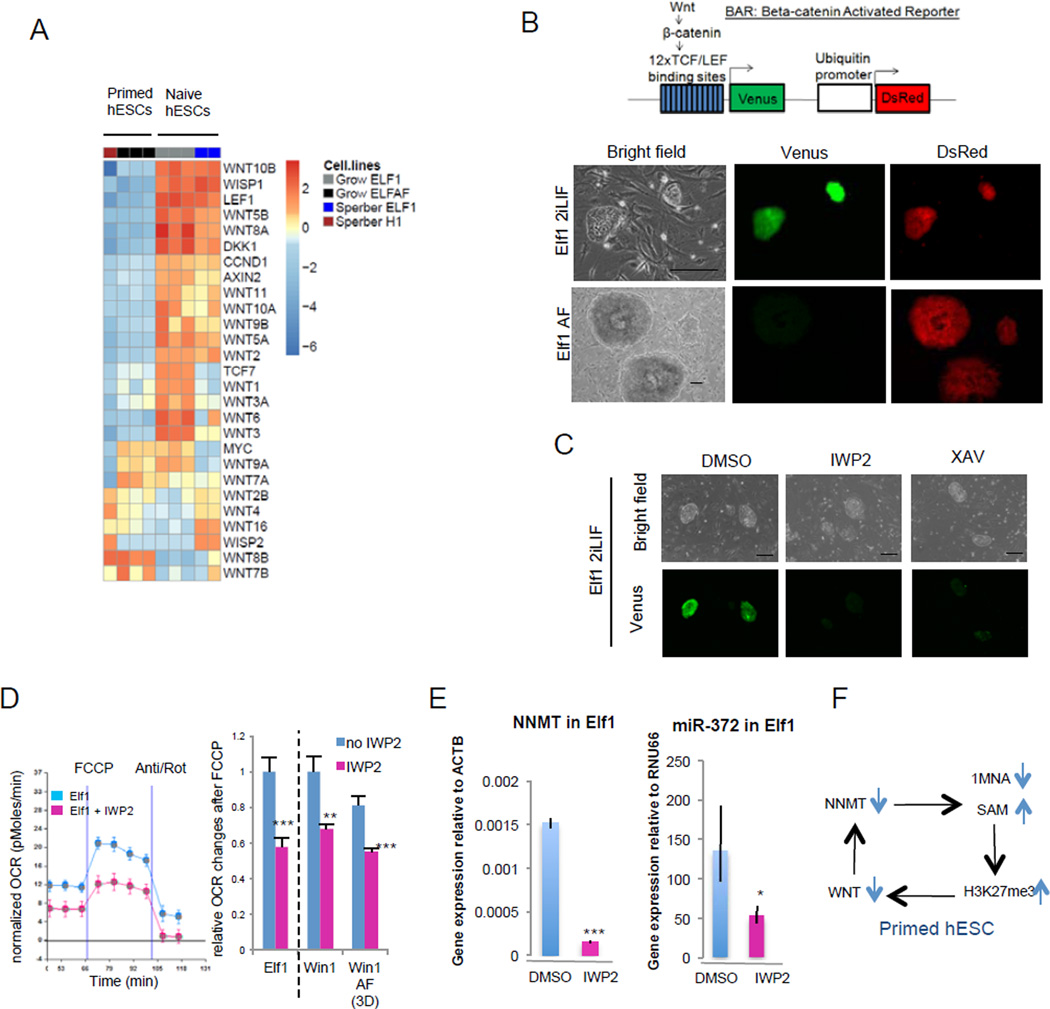
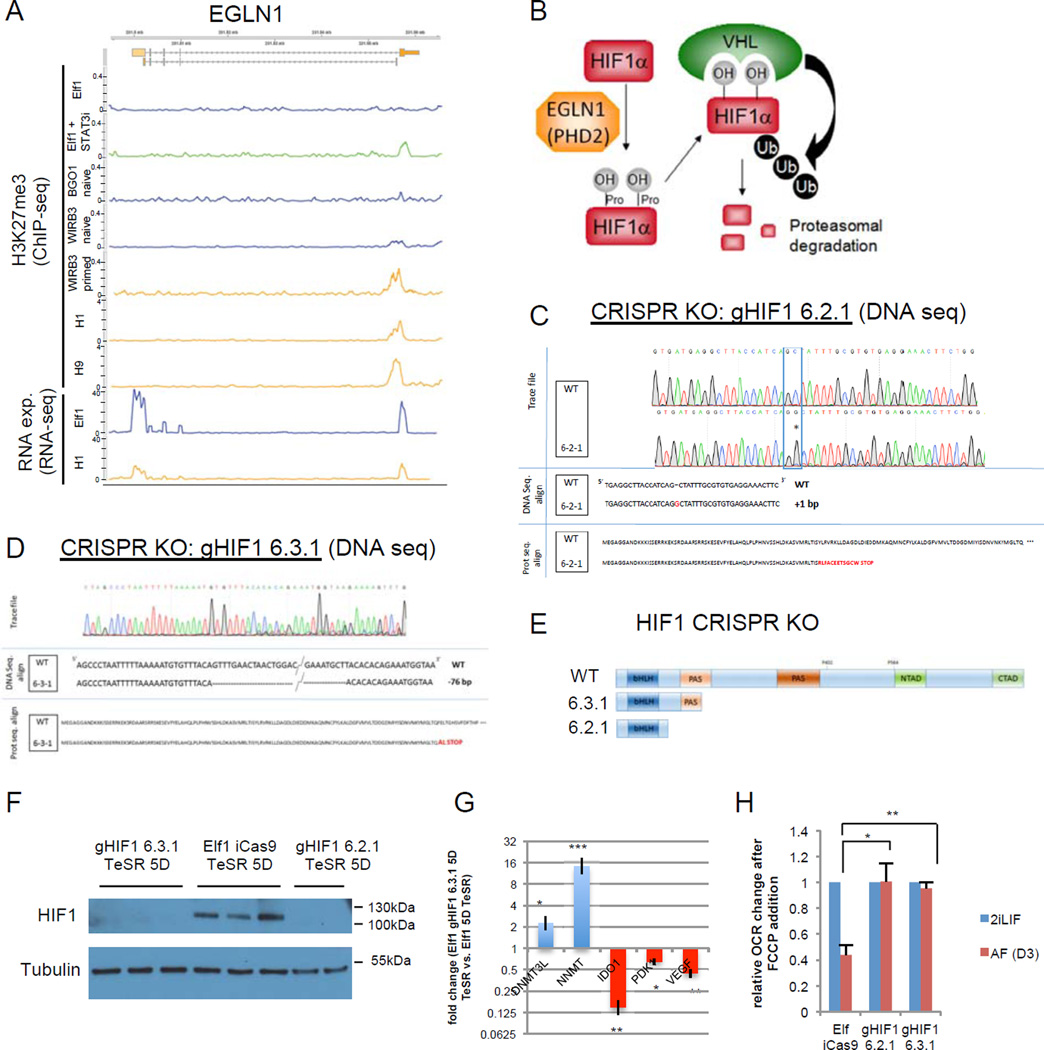
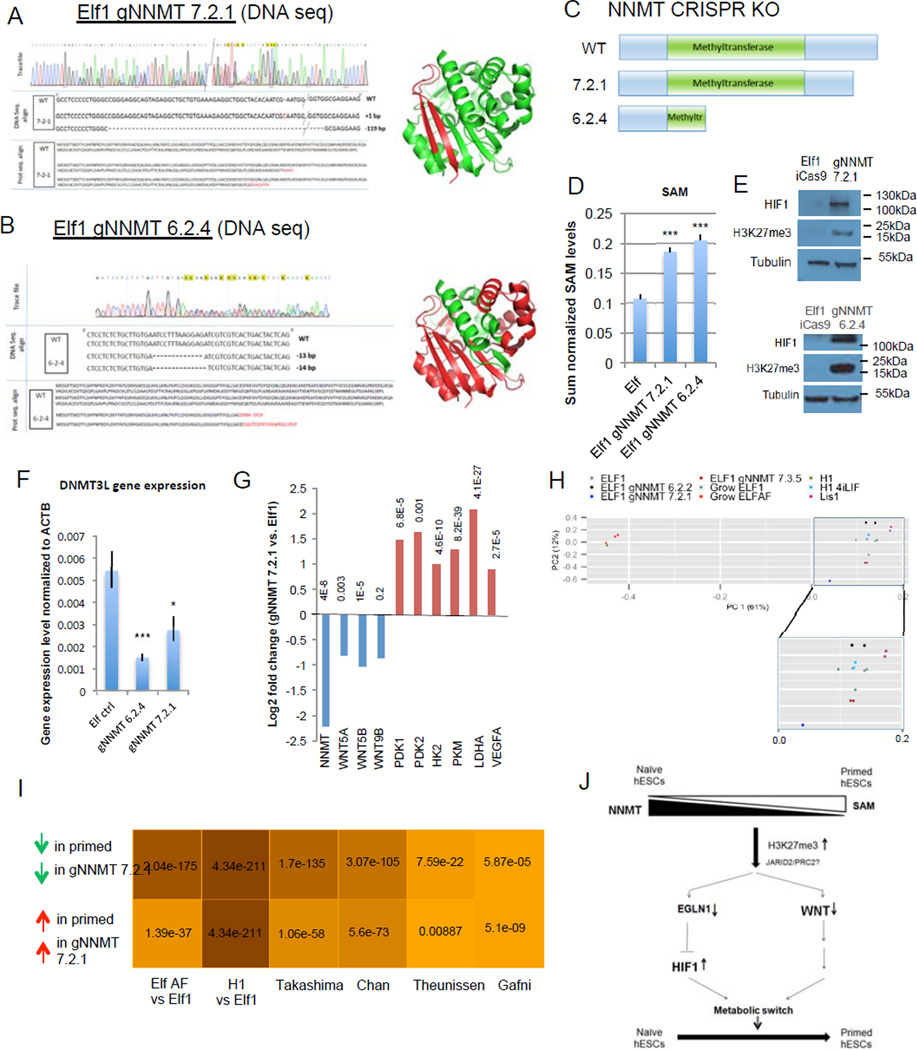
For nearly a century developmental biologists have recognized that cells from embryos can differ in their potential to differentiate into distinct cell types. Recently, it has been recognized that embryonic stem cells derived from both mice and humans exhibit two stable yet epigenetically distinct states of pluripotency: naive and primed. We now show that nicotinamide N-methyltransferase (NNMT) and the metabolic state regulate pluripotency in human embryonic stem cells (hESCs). Specifically, in naive hESCs, NNMT and its enzymatic product 1-methylnicotinamide are highly upregulated, and NNMT is required for low S-adenosyl methionine (SAM) levels and the H3K27me3 repressive state. NNMT consumes SAM in naive cells, making it unavailable for histone methylation that represses Wnt and activates the HIF pathway in primed hESCs. These data support the hypothesis that the metabolome regulates the epigenetic landscape of the earliest steps in human development.


Figures

Figure 1
Figure 1. Naïve and primed ESCs are metabolically different
A: PCA of RNA-seq data from this study (Elf1, H1 4i–LIF, Lis1, H1) and other studies,,–,. ComBat was applied on the combined RNA-seq dataset. B: Genes contributing to principal components separating primed vs. naïve hESC. Size of dots are proportional to the square of PC1 value. Top contributing genes are darker. C: Metabolic profile of naïve (Elf1, H1-4iLIF) and primed (H1) hESCs. A trace of OCR changes is shown under a MitoStress protocol (s.e.m, n=6 biological replicates). D: Primed hESCs (H7 and H1) have reduced OCR changes in response to FCCP compared to naïve hESCs (Elf1 and H1-4iLIF), n=18 (H1, H1 4iLIF) or 24 (Elf1, H7) biological replicates; s.e.m.; p=0.122 for H14iLIFvs.Elf1, p=0.0001 for H1vs.Elf1, p=0.0014 for H7vs.Elf1; 2-tailed t-test. E-F: Transition of naïve hESCs Elf1 (E) and WIN1 (F) toward a more primed state by culture in ActivinA-FGF (AF) media reduced OCR changes in response to FCCP after 1 to 3 days (n=29 for Elf AF 1D, n=20 for Elf AF 2D, n=28 for Elf AF 3D, n=33 for Elf1, n=18 for WIN1 and WIN1 AF; s.e.m.; p=0.0013 for ElfAF1Dvs.Elf1, p<0.001 for ElfAF2Dvs.Elf1, ElfAF3Dvs. Elf1 and WIN1AFvs.WIN1; 2-tailed t-test). G: Heatmap log2 fold expression change of mitochondria complexes genes between primed and naïve stages. H–I: Naïve hESCs (Elf1) and primed hESCs (Elf1 AF) have similar mitochondrial DNA copy number (H,n=3) and mitochondrial mutation frequencies (I,n=3). S.e.m.; p=0.7802 (H), p=0.37 and 0.6 (I); 2-tailed t-test. J: HIF1α protein is stabilized in primed hESCs (H7 and Elf1 AF). K: Proteomic workflow used to identify differentially regulated protein expression in primed vs. naive hESCs. L: Volcano plot of differentially expressed proteins in primed hESCs (right, green; Elf1 AF) vs naïve cells (left, blue, Elf1). Significant hits are shown (FDR<0.05). Proteins were quantified by nano-LC-MS/MS on a Fusion Orbitrap. M: JARID2 and LDHA proteins are upregulated in primed hESCs (Elf1 AF and H7) compared to naïve hESCs (Elf1), as revealed by Western blot analysis. Unprocessed original scans of blots are shown in Supplementary Suppl.Fig.9. For raw data, see Supplementary Table 4. n=number of biological replicates.
Figure 2
Figure 2. Metabolomic analysis of naïve and primed ESCs
A: Scheme of mass spectrometry experiments performed for metabolites on mouse and human naïve (pre-implantation) and primed (post-implantation) ESCs. B-C: naïve and primed stem cells can be clearly separated based on their metabolic profiles. (B) PCA plot of water-soluble untargeted GC-MS metabolomics data. The first principal component (PC), which separates the primed cell types (left) from the naïve cell types (right) explained 50.5% of total variance. (C) PCA plot of untargeted LC metabolomics data. 3 clusters are along the first PC: primed cells (left), primed cells toggled back to naïve cells (middle) and naïve cells (right). The first PC explained 68.2% of total variance. D–G: volcano plots of differentially abundant metabolites between primed and naïve cells in mESCs (D, E) detected by GC-TOF, and hESCs (F: GC-TOF, G: LC-QQQ-MS). x-axis is log2 fold change of abundance, y-axis is negative log10 of p-value. Metabolites of biological interest for further analysis are labeled. H: Visualization of the glycolysis pathway and connections to lipid and amino acid synthesis. I: Fold change of glycolysis metabolites (n=3, s.e.m.; Glucose (p=0.6630), G1P-G6P-F6P-F1P (p=0.3713), F16BP-F26BP (p=0.0070), D-GA3P-DHAP (p=0.0058), PEP (p=0.1925), Pyruvate (p=0.1416); 2-tailed t-test) after log2 transformation and mean centering in H1 vs. Elf1 detected by targeted LC-QQQ-MS. For raw data, see Supplementary Tables 1 and 4. n=number of biological replicates.
Figure 3
Figure 3. Primed ESCs accumulate lipids while naïve ESCs use fatty acids as a source of energy
A–B: More abundant lipids in primed hESCs (H1) have more carbon atoms (A) and larger mass (B) than more abundant lipids in naïve hESCs (Elf1). C: More abundant lipids in primed mESCs (R1AF) are more unsaturated than more abundant lipids in naïve mESCs (R1). n=6, p-values Wilcoxon ranksum test. Boxes represent median, 25th and 75th quantiles. Whiskers extend 1.5 IQR above 75th quantile and below 25th quantile. Dots represent values beyond whiskers. D-E: BODIPY 493/503staining shows an increase of lipid droplet accumulation in primed human (Elf1, D) and mouse (EpiSCs, E) ESCs compared to naïve human (Elf1 AF, D) and mouse (R1, E) ESCs. Scale bar, 50µm. F: CPT1A is downregulated in human and mouse primed ESCs compared to naïve ESCs in our study and others. n= from left to right (primed, naïve): 2,1; 3,3; 2,5; 3,3; 3,3; 3,9; 3,2. Negative binomial test p-values are shown. G: ChIP-seq analysis of CPT1A gene shows more repressive H3K27me3 marks and less active H3K4me3 and H3K27ac marks in primed hESCs (C1, WIBR3, H1, H9) than naïve hESCs (Elf1; naïve C1, naïve BGO1, naïve WIBR3). H: volcano plot, microRNA expression in naïve hESCs (Elf1) and primed hESCs (H1, ENCODE, suppl. table 1M). I: qPCR expression of hsa-miR-9 and hsa-miR-10a (predicted to target CPT1A and FASN respectively). hsa-miR-10a is 34-fold higher, and hsa-miR-9 is 4-fold lower in Elf1 vs.H1 (n=3, s.e.m; miR-10a: p=0.004, miR-9: p=0.022; 2-tailed t-test). J-L: Seahorse palmitate assay shows that naïve human and mouse ESCs use fatty acids as a source of energy. A trace of OCR changes after palmitate or BSA vehicle addition, followed by ETO in human ESCs (naïve Elf1 and primed H7, J) and mouse ESCs (naïve R1 and primed EpiSCs, K). n=4 for Elf1BSA, R1BSA, EpiBSA, n=5 for Elf1PALM, R1PALM, EpiPALM, n=6 for H7BSA, H7PALM; s.e.m. Changes after ETO injections were quantified in L (Elf1BSA (n=12), R1BSA (n=12), EpiBSA (n=12), Elf1PALM (n=15), R1PALM (n=15), EpiPALM (n=15), H7BSA (n=18), H7PALM (n=18), s.e.m.; naïve hESCs: p=0,0096, primed hESCS: p=0.354, naïve mESCs: p=0.03, primed mESCs: p=0.88, 2-tailed t-test). For raw data, see Supplementary Table 4. n=number of biological replicates.
Figure 4
Figure 4. Amino acids methionine and tryptophan are differentially regulated in naïve and primed hESCs
A: Model of Tryptophan-Kynurenine pathway. B: IDO1 is highly expressed in primed hESCs as compared to naïve hESCs (qPCR, n=3 for H14iLIF, ElfAF, n=4 for H12iF, H1, H7, n=5 for Elf 2iLIF; s.e.m.; ***p<0.001; 2-tailed t-test). C: The kynurenine vs. tryptophan ratio is higher in primed than naïve hESCs, as detected by targeted (n=6) and non-targeted (HILIC: n=4, QQQ n=3) mass spectrometry. s.e.m.; *p<0.05, **p<0.01, ***p<0.001; 1-tailed t-test,). D: Model of SAM pathway and NNMT. Metabolites in red are up-regulated in primed hESCs. Metabolites and enzymes in blue are up-regulated in naïve hESCs. E: Volcano plot of RNA-seq data from naïve hESCs (Elf1) and primed hESCs (H1). Genes with greater than 2-fold change and FDR<0.05 are colored. NNMT and IDO1 are among the most differentially expressed genes. F: NNMT is highly up-regulated in naïve hESCs compared to primed hESCs (qPCR). Numbers indicate fold changes of naïve hESCs compared to H1 and H7 primed hESCs. (n=3 for WIN1, H75iLAF, Elf1, H14iLIF, H14iLTF, LIS1, WIN1F, Elf1AF, n=4 for WIN15iLA, H12iF, H1, H7, n=5 for H75iLIF; s.e.m.; ***p<0.001; 2-tailed t-test) G: Naïve hESCs (n=4 each) have higher amounts of the 1-MNA, than primed hESCs (n=4 for H1, n=6 for WIN1TeSR, ElfAF) (s.e.m. ***p<0.001, 2-tailed t-test). 1-MNA was not detected in Elf1 CRISPR-Cas9 KO mutant of NNMT (gNNMT 7.2.1, n=6; gNNMT 6.2.4, n=6). H: SAM levels are higher in primed hESCs (H1 n=4, Elf AF n=6) than in naïve hESCs (Elf1 n=4) (s.e.m.; p=0.0089 for ElfAF vs. Elf1, p=0.0376 for H1 vs. Elf1; 2-tailed t-test). I-J: SAM induces a “primed-like” metabolic profile in naïve hESCs. Addition of SAM (500µM) for 5h in media without methionine reduces OCR changes in response to FCCP in naïve hESCs (WIN1). A Seahorse trace is shown in I (n=6; s.e.m). OCR changes after FCCP are quantified in J (n=23; s.e.m.; p=0.017). K: Overexpression of NNMT delays the metabolic transition from naïve to primed (n=4; s.e.m.; p=0.028, 2-tailed t-test). For raw data and exact p values, see Supplementary Table 4. n=number of biological replicates.
Figure 5
Figure 5. High NNMT expression in naïve hESCs regulates histone methylation status
A: H3K27me3 reads mapped 5kb around transcription start sites (TSS) of 648 developmental genes were plotted for Ware et al., Gafni et al., Theunissen et al., Bernstein et al. (left panel) and Chan et al (right panel) ChIP-seq data sets. B: Western blot analyses show higher H3K27me3 and H3K9me3 in primed hESCs (H7, Elf1 AF) than naïve hESCs (Elf1). C: qPCR analysis shows a knock-down regulation of NNMT using siRNA (50 nM, 72h) in naïve hESCs (Elf1), inducing a decrease of 1-MNA levels (qPCR n=3; s.e.m., p=0.001, 2-tailed t-test; HILIC n=4, s.e.m., p=0.039 1-tailed t-test) D: Western blot analysis of histone marks in Elf1 cells treated with siRNA against NNMT or siRNA against luciferase as a control. E: Hypergeometric test p-values for the overlap between genes expressed higher (lower) in siNNMT compared to siLUC and genes expressed higher (lower) in primed lines compared to naïve lines from multiple studies. Color shade is proportional to negative log10 of p-values. siLUC transcriptomic signature has significant overlap with the ELFAF vs. Elf1 data set. F: Western blot analysis of histone modifications after treatment of Elf1 cells with 100 µM of STAT3 inhibitor. G: 6h treatment with STAT3 inhibitor (100 µM) in Elf1 cells increases H3K27me3 marks, as shown by ChipSeq analysis on all genes. H: WNT ligands and EGLN1 are among the 313 overlapping genes with increased H3K27me3 mark in primed vs. naïve hESCs (8,10,64), and Elf1 cells treated for 6h with 100uM STAT3 inhibitor vs. Elf1 cells. I: Windowed chromatin heatmaps of H3K27me3 profile +/− 5kb of promoters of the 313 overlapping genes with increased H3K27me3. J: H3K27me3 reads from ChIP-seq data mapped 5kb around TSS were plotted for naïve hESCs (C1, WIBR3, BGO1, and Elf1.), primed hESCs (C1, WIBR3, H1) and naïve hESCs Elf1 treated for 6h with 100µM of STAT3 inhibitor. Unprocessed original scans of blots are shown in Supplementary Fig.9. For raw data, see Supplementary Table 4. n= number of biological replicates.
Figure 6
Figure 6. WNT pathway is active in naïve hESCs
A: Heatmap of gene expression of WNT ligands and WNT targets in primed hESCs (H1, Elf1 AF) and naïve hESCs (Elf1). B: Wnt is activated in naïve hESCs. Endogenous Wnt signaling in naïve (Elf1) and primed (Elf1 AF) BAR-reporter cells. Scale bars represent 200µm. C: Wnt inhibitor IWP2 (2µM) and Wnt antagonist XAV939 (5µM) inhibit the reporter activity in naïve Elf1 cells after 72h. Scale bars represent 200µm. D: Wnt inhibition by IWP2 (2µM, 48h) decreases OCR changes after FCCP in naïve hESCs (Elf1, WIN1) and in naïve hESCs transitioning to primed (WIN1 AF). A trace of OCR changes is presented in Elf1 (n=8 for Elf1, n=6 for Elf1+IWP2; s.e.m.). OCR changes after FCCP were quantified (n=8 for Elf1, n=6 for Elf1+IWP2, WIN1, WIN1+IWP2, WIN1AF, n=7 for WIN1AF+IWP2; s.e.m.; p=0.0009 for Elf1+IWP2 vs. Elf1, p=0.0084 for WIN1+IWP2 vs. WIN1, p=0.0006 for WIN1AF+IWP2 vs. WIN1AF; 2-tailed t-test). E: Wnt inhibition by IWP2 (2µM, 72h) downregulates NNMT and miR-372 expression in naïve hESCs (Elf1) as shown by qPCR analysis. (n=3; s.e.m.; p=0.04 for miR-372, p=6.44E-06 for NNMT; 1-tailed t-test). F: Model of self-reinforcing loop between WNT and NNMT in primed hESCs. For raw data, see Supplementary Table 4. n= number of biological replicates.
Figure 7
Figure 7. HIF1α is required for naïve to primed hESC transition
A: screen shot of RNA expression and H3K27me3 marks of EGLN1 (PHD2) in naïve hESCs [Elf1, WIRB3 naïve and BGO1 naïve)], primed hESCs [WIRB3 primed, H1 and H9 and Elf1 treated with STAT3 inhbitor (100 µM) for 6h. B: HIFα is hydroxylated on prolyl residues by EGLN1 (PHD2), leading to VHL-mediated proteolysis. C-D: Sequencing trace files, DNA sequences and protein sequences of HIF1α CRISPR-Cas9 knock-out (KO) mutant clones (gHIF1 6.2.1, C; gHIF1 6.3.1, D). E: schematic representation of wild type HIF1α protein and proteins resulting from CRISPR-Cas9 knock-out (KO) mutants gHIF1 6.2.1 and gHIF1 6.3.1. bHLH= basic helix-loop-helix domain, PAS= Per-Arnt-Sim domain, NTAD= N-terminus transcriptional activation domain, CTAD= C-terminus transcriptional activation domain. F: HIF1α is not expressed in CRISPR-Cas9 KO mutants. Western blot analysis of HIF1α expression in cells pushed toward the primed stage by culture in TeSR1 for 5 days in wild type Elf1 cells (iCas9 Elf1), and two CRISPR-Cas9 KO mutants of HIF1α (gHIF1 6.2.1 and gHIF1 6.3.1). G: qPCR analysis of hESCs transitioning to primed reveals that naïve markers (DNMT3L and NNMT) are still expressed higher in Elf1 HIF1α CRISPR-Cas9 KO cells compared to wild type Elf1, while primed marker IDO1 and HIF target genes (PDK1 and VEGFA) are downregulated (n=3; s.e.m.; p=0.024 for DNMT3L, p=0.0005 for NNMT, p=0.001 for IDO1, p=0.12 for PDK1, p=0.004 for VEGFA; 2-tailed t-test). H: KO of HIF1α prevents the metabolic switch occurring during the transition of hESCs from naïve to primed state as shown by measuring OCR after FCCP addition using SeaHorse. n=3 for gHIF1 6.3.1 2iLIF and AF and n=4 for Elf iCas9 and gHIF1 6.2.1 2iLIF and AF; s.e.m.; p=0.0117 for gHIF1 6.2.1 vs. Elf iCas9, p=0.0032 for gHIF1 6.3.1 vs. Elf iCas9; 2-tailed t-test. Unprocessed original scans of blots are shown in Supplementary Fig.9. For raw data, see Supplementary Table 4. n= number of biological replicates.
Figure 8
Figure 8. NNMT affects naïve to primed hESC transition by repressing Wnt pathway and activating HIF pathway
A–B: Sequencing trace files, DNA sequences, protein sequences and 3D protein structures predicted from sequence (Pymol) of various NNMT CRISPR-Cas9 KO mutant clones (gNNMT 7.2.1, A; gNNMT 6.2.4, B). Green color represents the truncated NNMT protein in the CRISPR-Cas9 mutant. C: Schematic representation of wild type NNMT protein and proteins resulting from the CRISPR-Cas9 KO mutants gNNMT 7.2.1 and gNNMT 6.2.4. D: Elf1 NNMT CRISPR-Cas9 KO cells have higher amounts of SAM than wild type Elf1 cells (n=6; s.e.m.; p=1.23E-05 for gNNMT7.2.1, p=5.47E-06 for gNNMT6.2.4; 2-tailed t-test). E: Western blot analysis reveals higher HIF1α expression and H3K27me3 marks in Elf1 CRISPR-Cas9 KO mutants gNNMT 7.2.1 and gNNMT 6.2.4 compared to control Elf1 (iCas9) cells. F: qPCR analysis of the naïve marker DNMT3L in wild type Elf1 cells (n=6) and Elf1 CRISPR-Cas9 KO mutants gNNMT 7.2.1 (n=5) and gNNMT 6.2.4 (n=3). s.e.m.; p=0.0009 for gNNMT 6.2.4 vs. Elf1, p=0.027 for gNNMT 7.2.1 vs. Elf1; 2-tailed t-test. G: log2 fold expression change of NNMT, WNT ligands and HIF target genes in Elf1 CRISPR-Cas9 KO gNNMT 7.2.1 compared to wild type Elf1 cells (RNAseq). H: PCA plot of CRISPR NNMT knockout line and different naïve and primed lines sequenced in this study. gNNMT 6.2.2 and gNNM 7.3.5 are heterozogous controls. PC1 (x-axis) explains majority of the variation in the data (61%), and the gNNMT 7.2.1 knockdown line moved along x-axis substiantially away from other naïve lines and toward the primed state. I: Hypergeometric test p-values for the overlap between genes expressed higher (lower) in gNNMT 7.2.1 compared to Elf1 and genes expressed higher (lower) in primed lines compared to naïve lines from multiple studies. Color shade is proportional to negative log10 of p-values. gNNMT 7.2.1 transcriptomic signature has significant overlap with all published primed transcriptomic datasets, supporting its transition toward a primed stage. J: Model of the intricate relationship between metabolism and epigenetic in hESCs. Unprocessed original scans of blots are shown in Supplementary Fig.9. For raw data, see Supplementary Table 4. n= number of biological replicates.

Comment in

References

    1. Buecker C, et al. Reorganization of enhancer patterns in transition from naive to primed pluripotency. Cell Stem Cell. 2014;14:838–853. - PMC - PubMed
    1. Factor DC, et al. Epigenomic Comparison Reveals Activation of "Seed" Enhancers during Transition from Naive to Primed Pluripotency. Cell Stem Cell. 2014;14:854–863. - PMC - PubMed
    1. Tesar PJ, et al. New cell lines from mouse epiblast share defining features with human embryonic stem cells. Nature. 2007;448:196–199. - PubMed
    1. Wu J, et al. An alternative pluripotent state confers interspecies chimaeric competency. Nature. 2015;521:316–321. - PMC - PubMed
    1. Brons IG, et al. Derivation of pluripotent epiblast stem cells from mammalian embryos. Nature. 2007;448:191–195. - PubMed

Publication types

MeSH terms