Multicenter Study
. 2016 Apr 1;193(7):772-82.
doi: 10.1164/rccm.201504-0749OC.

Rhinovirus Detection in Symptomatic and Asymptomatic Children: Value of Host Transcriptome Analysis

Affiliations
Multicenter Study

Rhinovirus Detection in Symptomatic and Asymptomatic Children: Value of Host Transcriptome Analysis

Santtu Heinonen et al. Am J Respir Crit Care Med. .

Abstract

Rationale: Rhinoviruses (RVs) are a major cause of symptomatic respiratory tract infection in all age groups. However, RVs can frequently be detected in asymptomatic individuals.

Objectives: To evaluate the ability of host transcriptional profiling to differentiate between symptomatic RV infection and incidental detection in children.

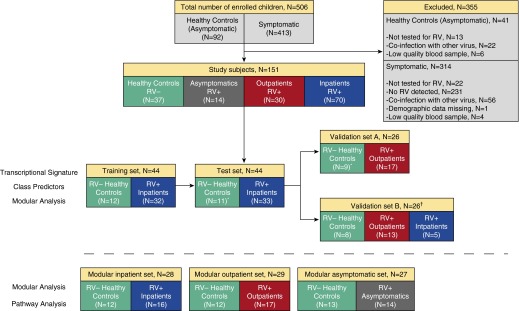
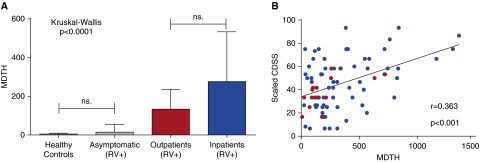
Methods: Previously healthy children younger than 2 years old (n = 151) were enrolled at four study sites and classified into four clinical groups: RV- healthy control subjects (n = 37), RV+ asymptomatic subjects (n = 14), RV+ outpatients (n = 30), and RV+ inpatients (n = 70). Host responses were analyzed using whole-blood RNA transcriptional profiles.

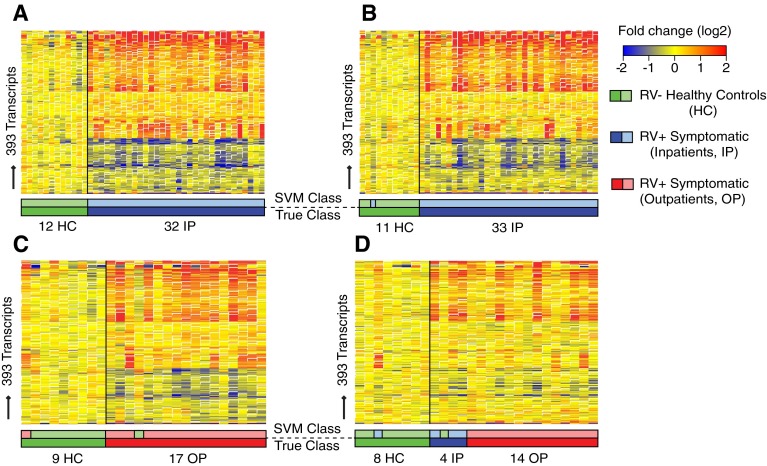
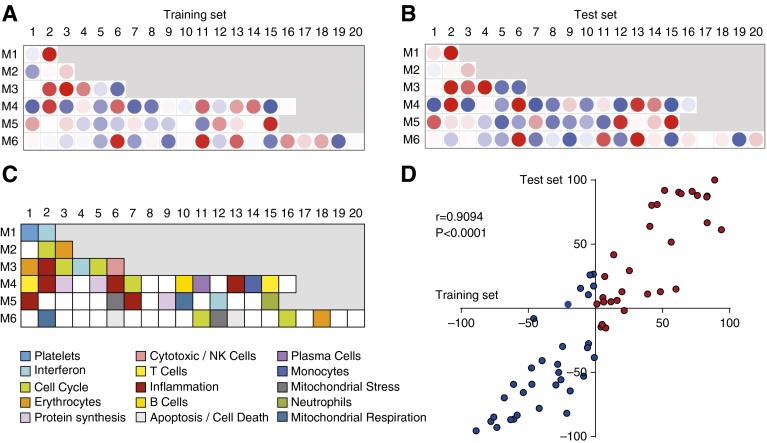
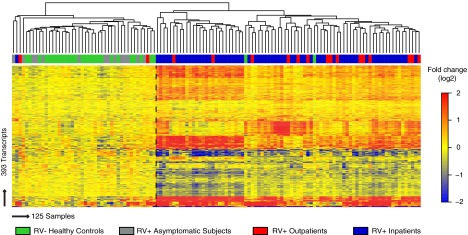
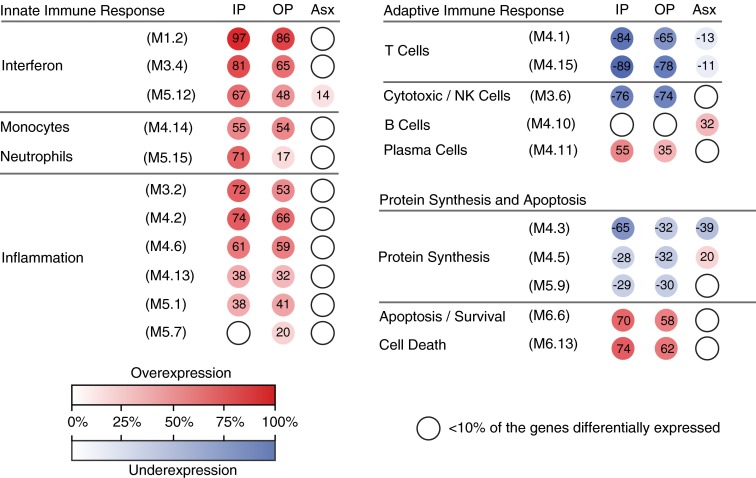
Measurements and main results: RV infection induced a robust transcriptional signature, which was validated in three independent cohorts and by quantitative real-time polymerase chain reaction with high prediction accuracy. The immune profile of symptomatic RV infection was characterized by overexpression of innate immunity and underexpression of adaptive immunity genes, whereas negligible changes were observed in asymptomatic RV+ subjects. Unsupervised hierarchical clustering identified two main clusters of subjects. The first included 93% of healthy control subjects and 100% of asymptomatic RV+ subjects, and the second comprised 98% of RV+ inpatients and 88% of RV+ outpatients. Genomic scores of healthy control subjects and asymptomatic RV+ children were similar and significantly lower than those of RV+ inpatients and outpatients (P < 0.0001).

Conclusions: Symptomatic RV infection induced a robust and reproducible transcriptional signature, whereas identification of RV in asymptomatic children was not associated with significant systemic transcriptional immune responses. Transcriptional profiling represents a useful tool to discriminate between active infection and incidental virus detection.

Keywords: asymptomatic; children; rhinovirus; transcriptional profiling; viral detection.


Figures

Figure 1.
Figure 1.
Flowchart of study subjects. The upper panels indicate the number of patients and control subjects enrolled and the reasons for exclusion of others. Subjects included in the study (n = 151) were classified into four clinical groups according to disease severity and rhinovirus (RV) detection: RV+ inpatients, RV+ outpatients, RV+ asymptomatic subjects, and RV− healthy control subjects. Transcriptional signatures were identified and validated in four datasets (middle panels): training set, test set, validation set A, and validation set B. The first three groups underwent batch correction, and the fourth group was used as an additional, external validation cohort. A random selection of patients was used to derive the modular signatures (lower panels) for RV+ inpatients, RV+ outpatients, and RV+ asymptomatic subjects. *Three healthy control subjects were shared between the test set and validation set A. Samples in validation set B were not included in the batch correction.
Figure 2.
Figure 2.
Symptomatic rhinovirus (RV) infection induces a robust and reproducible transcriptional signature. (A) Training set (n = 44). Class comparisons (Benjamini-Hochberg corrected false discovery rate <0.01 and ≥1.25-fold change) using linear models adjusted for age, race, and white blood cell composition (neutrophil score) between RV− healthy control subjects (HC) and RV+ inpatients (IP) identified 393 differentially expressed transcripts (transcriptional RV signature) (Table E4). Transcripts are organized in a heat map format in which each row represents a single transcript and each column represents a patient sample. Red indicates overexpression, and blue underexpression, of a transcript compared with the median expression of HC (yellow). The transcriptional signature was validated in three independent patient sets using the support vector machine (SVM) algorithm. The SVM algorithm predicted the condition (symptomatic RV infection or RV− HC) in (B) the test set (n = 44) with 98% accuracy and in (C) validation set A (n = 26) and (D) validation set B (n = 26) with 92% accuracy. Color bars below the heat maps indicate the true sample class below (darker colors) and above (lighter colors) the predicted SVM class. OP = outpatient.
Figure 3.
Figure 3.
Modular fingerprints of rhinovirus-induced acute respiratory infection. To characterize biological functions of the differentially expressed genes, we used modular analysis. The analysis was performed separately for (A) the training set and (B) the test set. The color intensity of the modules (dots) indicates the proportion of overexpressed (red) or underexpressed (blue) transcripts within each module. (C) Key to the functional annotations of modular sets 1–6. (D) Scatterplot representing the modular correlation between the training set (x-axis) and the test set (y-axis). The axes indicate the percentage of differentially expressed genes in each module. Correlations were assessed using Spearman’s correlation coefficient. NK = natural killer.
Figure 4.
Figure 4.
Transcriptional signatures accurately discriminate between symptomatic and asymptomatic rhinovirus (RV) detection. Unsupervised hierarchical clustering (euclidean distance, average linkage) of samples included in the training set (n = 44), the test set (n = 44), validation set A (n = 26), and an additional cohort of 14 RV+ asymptomatic children (total N = 125) grouped the samples in two main clusters (separated by dashed vertical line). The first cluster included the majority of RV− healthy control subjects (27 [93%] of 29) and all RV+ asymptomatic subjects (14 [100%] of 14), and the second cluster comprised the majority of RV+ inpatients (64 [98%] of 65) and RV+ outpatients (15 [88%] of 17). The optimal number and the stability of the clusters were determined by calculating average silhouette indices (Figure E3).
Figure 5.
Figure 5.
Differences in modular expression according to disease severity. Comparison of modular expression between the clinical groups showed significant overexpression of innate immunity–associated modules and underexpression of adaptive immunity–associated modules in the rhinovirus-positive (RV+) inpatients (IP) and outpatients (OP), whereas only minor changes were detected in RV+ asymptomatic subjects (Asx). Each group was compared with matched healthy control subjects (modular inpatient set, modular outpatient set, and modular asymptomatic set) (Table E5). The color intensity of the modules (colored circles) indicates the proportion of overexpressed (red) or underexpressed (blue) transcripts within each module. Numeric values indicate the exact percentage of transcripts expressed in each specific module. Open circles indicate that less than 10% of the genes in the module were differentially expressed. NK = natural killer.
Figure 6.
Figure 6.
Molecular distance to health (MDTH) score correlates with disease severity. (A) MDTH score discriminates between the human rhinovirus–positive (RV+) asymptomatic subjects and RV+ symptomatic subjects (inpatients and outpatients) (P < 0.0001 by Kruskal-Wallis test with Dunn’s test for multiple comparisons). (B) In the symptomatic subjects (inpatients and outpatients; n = 82), MDTH score correlated with the clinical disease severity score (CDSS) (Spearman’s correlation coefficient). Outpatients are represented by red dots and inpatients by blue dots. ns = nonsignificant.

Comment in

Similar articles

Cited by

References

    1. Ruohola A, Waris M, Allander T, Ziegler T, Heikkinen T, Ruuskanen O. Viral etiology of common cold in children, Finland. Emerg Infect Dis. 2009;15:344–346. - PMC - PubMed
    1. Ruuskanen O, Lahti E, Jennings LC, Murdoch DR. Viral pneumonia. Lancet. 2011;377:1264–1275. - PMC - PubMed
    1. Iwane MK, Prill MM, Lu X, Miller EK, Edwards KM, Hall CB, Griffin MR, Staat MA, Anderson LJ, Williams JV, et al. Human rhinovirus species associated with hospitalizations for acute respiratory illness in young US children. J Infect Dis. 2011;204:1702–1710. - PubMed
    1. Mansbach JM, Piedra PA, Teach SJ, Sullivan AF, Forgey T, Clark S, Espinola JA, Camargo CA, Jr MARC-30 Investigators. Prospective multicenter study of viral etiology and hospital length of stay in children with severe bronchiolitis. Arch Pediatr Adolesc Med. 2012;166:700–706. - PMC - PubMed
    1. Rakes GP, Arruda E, Ingram JM, Hoover GE, Zambrano JC, Hayden FG, Platts-Mills TA, Heymann PW. Rhinovirus and respiratory syncytial virus in wheezing children requiring emergency care: IgE and eosinophil analyses. Am J Respir Crit Care Med. 1999;159:785–790. - PubMed

Publication types

MeSH terms