. 2016 Jan;12(1):15-21.
doi: 10.1038/nchembio.1961. Epub 2015 Nov 16.

Branched-chain amino acid catabolism fuels adipocyte differentiation and lipogenesis

Affiliations

Branched-chain amino acid catabolism fuels adipocyte differentiation and lipogenesis

Courtney R Green et al. Nat Chem Biol. 2016 Jan.

Abstract

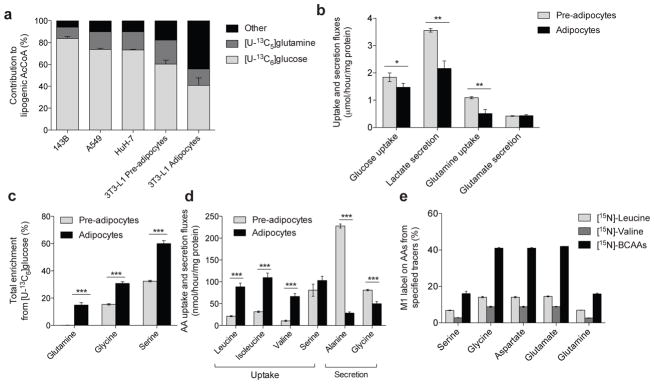
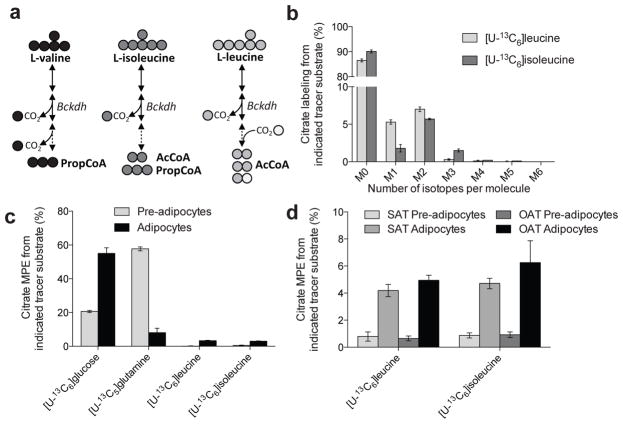
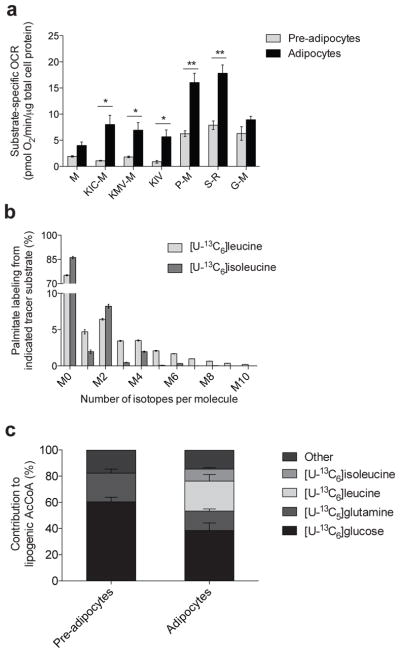
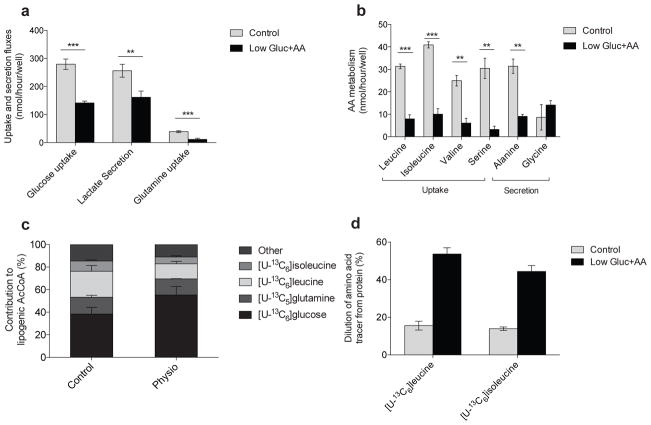
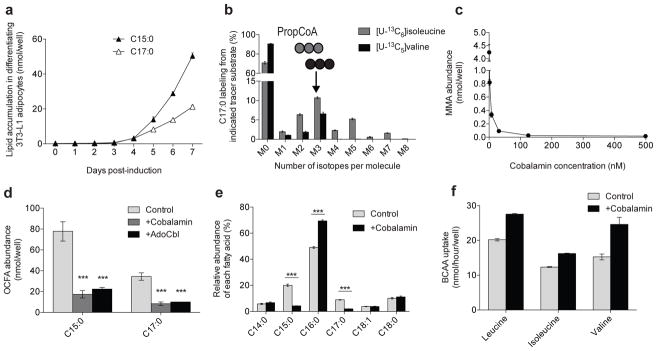
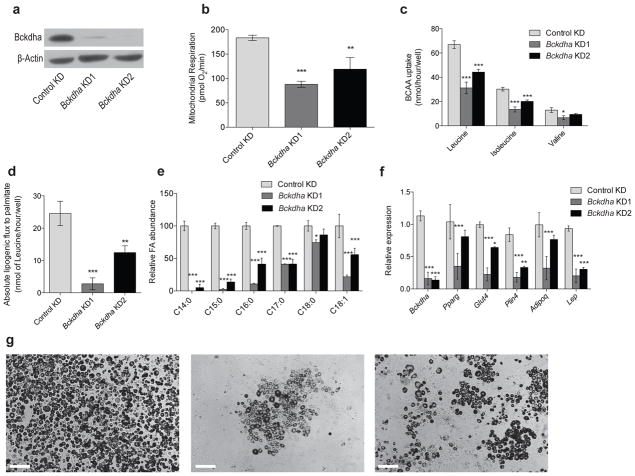
Adipose tissue plays important roles in regulating carbohydrate and lipid homeostasis, but less is known about the regulation of amino acid metabolism in adipocytes. Here we applied isotope tracing to pre-adipocytes and differentiated adipocytes to quantify the contributions of different substrates to tricarboxylic acid (TCA) metabolism and lipogenesis. In contrast to proliferating cells, which use glucose and glutamine for acetyl-coenzyme A (AcCoA) generation, differentiated adipocytes showed increased branched-chain amino acid (BCAA) catabolic flux such that leucine and isoleucine from medium and/or from protein catabolism accounted for as much as 30% of lipogenic AcCoA pools. Medium cobalamin deficiency caused methylmalonic acid accumulation and odd-chain fatty acid synthesis. Vitamin B12 supplementation reduced these metabolites and altered the balance of substrates entering mitochondria. Finally, inhibition of BCAA catabolism compromised adipogenesis. These results quantitatively highlight the contribution of BCAAs to adipocyte metabolism and suggest that BCAA catabolism has a functional role in adipocyte differentiation.


Conflict of interest statement

No potential conflicts of interest relevant to this article were reported.

Figures

Figure 1
Figure 1. Characterization of metabolic reprogramming during adipocyte differentiation
(a) Contribution of [U–13C6]glucose and [U–13C5]glutamine to lipogenic AcCoA for palmitate synthesis in 143B, A549, HuH–7, and 3T3–L1 pre–adipocytes and adipocytes. (b) Uptake and secretion fluxes in 3T3–L1 pre–adipocytes and adipocytes. Data shown are from 3 biological replicates; *represents p<0.05, **represents p<0.01 by Student’s 2–tailed t–test. (c) Percentage of intracellular glutamine, serine, and glycine pools that were newly synthesized (labeled) from [U–13C6]glucose in 3T3–L1 pre–adipocytes and adipocytes. Data shown are 3 technical replicates representative of 3 biological replicates; ***represents p<0.001 by Student’s 2–tailed t–test. (d) Net amino acid uptake and secretion in 3T3–L1 pre–adipocytes and adipocytes. Data shown are 3 technical replicates representative of 3 biological replicates; ***represents p<0.001 by Student’s 2–tailed t–test. (e) Percentage of amino acids that contain an M1 label indicating transamination from indicated [15N]amino acid tracer. Data presented in (a) represents model output ± 95% c.i and (b)(e) represent mean ± s.d., Data shown in (b)(d) are 3 technical replicates representative of 3 biological replicates; asterisks represent significant differences between groups by Student’s 2–tailed t–test where * represents p<0.05, ** represents p<0.01, and *** represents p<0.001.
Figure 2
Figure 2. BCAA catabolism is initiated upon adipocyte differentiation
(a) Summary of BCAA catabolism and carbon atom transitions from each BCAA tracer. Abbreviations: Bckdh: branched-chain ketoacid dehydrogenase; AcCoA: acetyl-CoA; PropCoA: propionyl-CoA (b) Citrate labeling in 3T3–L1 adipocytes from [U–13C6]leucine and [U–13C6]isoleucine. (c) Mole percent enrichment (MPE) of citrate from each tracer substrate in 3T3–L1 pre–adipocytes and adipocytes. (d) Mole percent enrichment (MPE) of citrate from [U–13C6]leucine and [U–13C6]isoleucine in primary human pre–adipocytes and adipocytes isolated from subcutaneous (SAT) or omental adipose tissue (OAT) depots. Data presented in (b)(d) represent mean ± s.d.
Figure 3
Figure 3. BCAA catabolism fuels mitochondrial metabolism and lipogenesis in adipocytes
(a) Substrate–specific oxygen consumption rate (OCR) in permeabilized 3T3–L1 pre–adipocytes and adipocytes. Substrate key: M: malate; KIC–M: keto–isocaproate and malate; KMV–M: keto–methylvalerate and malate; KIV: keto–isovalerate; P–M: pyruvate and malate; S–R: succinate and rotenone; G–M: glutamate and malate. 250 nM AdoCbl and biotin were supplemented to the respirometry medium. Data shown are from at least 5 biological replicates each with 4 technical replicates; *represents p<0.05, **represents p<0.01 by Student’s 2–tailed t–test. (b) Palmitate labeling in 3T3–L1 adipocytes from [U–13C6]leucine and [U–13C6]isoleucine. Minimal label was detected in palmitate from [U–13C5]valine. (c) Contribution of each tracer substrate to lipogenic AcCoA in 3T3–L1 pre–adipocytes and adipocytes after correction due to tracer dilution. BCAA contributions were adjusted to account for dilution of intracellular amino acids from protein turnover using the average BCAA labeling over the course of the experiment. Data presented in (a) is mean ± s.e.m., (b) is mean ± s.d., and (c) is model output ± 95% c.i.
Figure 4
Figure 4. BCAA utilization is supported by protein catabolism
(a) Uptake and secretion fluxes in 3T3–L1 adipocytes cultured in control and Low Gluc+AA media. (b) Amino acid uptake and secretion in control and Low Gluc+AA media. (c) Contribution of each tracer to lipogenic AcCoA in 3T3–L1 adipocytes cultured in control and Low Gluc+AA media. BCAA contributions were adjusted to account for dilution of intracellular amino acids from protein turnover using the average BCAA labeling over the course of the experiment. Glutamine dilution occurred primarily via glucose–derived synthesis. (d) Percent of pool without label when cultured in indicated tracer substrate in control and Low Gluc+AA for 24 hours. Data presented in (a)(d) represent mean ± s.d., except (c) which represents model output ± 95% c.i. Data shown in (a)(b) are 3 technical replicates representative of 3 biological replicates; **represents p<0.01 and *** represents p<0.001 by Student’s two–tailed t–test.
Figure 5
Figure 5. BCAAs contribute to MMA, OCFAs, and BCFAs in differentiated 3T3–L1 adipocytes
(a) Odd–chain fatty acid (OCFA) accumulation in 3T3–L1 adipocytes 0 to 7 days post–induction. (b) C17:0 labeling from [U–13C6]isoleucine and [U–13C5]valine in 3T3–L1 adipocytes. (c) MMA abundance in cells cultured in DMEM +10% FBS and 0, 2, 8, 32, 125, or 500 nM cobalamin beginning on Day 0 of differentiation. (d) Odd–chain fatty acid (OCFA) levels in 3T3–L1 adipocytes after culture with 500 nM cobalamin or 100 nM AdoCbl. **represents p<0.01 and ***represents p<0.001 compared to control condition by two–way ANOVA and Holm–Sidak’s multiple comparison test. (e) Relative abundance of the most abundant fatty acids in control and +cobalamin conditions. ***represents p<0.001 compared to control condition by Student’s two–tailed t–test. (f) Uptake of BCAAs in control and +cobalamin condition. Data presented in (a)(f) represent mean ± s.d. Data shown in (d)(e) are from 3 technical replicates representative of 3 biological replicates.
Figure 6
Figure 6. Inhibition of BCAA catabolism impairs adipocyte differentiation
(a) Western blot of Bckdha and β–Actin in differentiated 3T3–L1 adipocytes. (b) Basal respiration in Control and Bckdha KD adipocytes normalized to nuclear quantitation. (c) BCAA uptake in Control KD and Bckdha KD adipocytes. (d) Absolute lipogenic flux of leucine to palmitate synthesis. (e) Relative abundance of the most abundant fatty acids. (f) Quantitative PCR analysis of adipocyte–specific gene expression. Data represents 2 biological replicates analyzed via 2–way ANOVA with Holm–Sidak’s multiple comparisons test. (g) Representative images of adipocyte differentiation (scale bar: 200 μm) From left: Control KD, Bckdha KD1, Bckdha KD2. Data presented in (b)(e) represent mean ± s.d. (f) is presented as mean ± s.e.m. Asterisks in (b)(e) represent significance compared to Control KD where *represents p<0.05, **represents p<0.01, and ***represents p<0.001. Unless otherwise specified, data is 3 technical replicates representative of 3 biological replicates analyzed via two–way ANOVA with Holm–Sidak’s multiple comparison test.

References

    1. Rosen E, Spiegelman B. What we talk about when we talk about fat. Cell. 2014;156:20–44. - PMC - PubMed
    1. Steppan C, et al. The hormone resistin links obesity to diabetes. Nature. 2001;409:307–312. - PubMed
    1. Glass CK, Olefsky JM. Inflammation and lipid signaling in the etiology of insulin resistance. Cell metabolism. 2012;15:635–645. - PMC - PubMed
    1. Turer AT, Scherer PE. Adiponectin: mechanistic insights and clinical implications. Diabetologia. 2012;55:2319–2326. - PubMed
    1. Herman MA, et al. A novel ChREBP isoform in adipose tissue regulates systemic glucose metabolism. Nature. 2012;484:333–338. - PMC - PubMed

Publication types

MeSH terms

Substances