. 2015 Dec;125(12):4463-82.
doi: 10.1172/JCI82735. Epub 2015 Nov 16.

Mesodermal iPSC-derived progenitor cells functionally regenerate cardiac and skeletal muscle

Mesodermal iPSC-derived progenitor cells functionally regenerate cardiac and skeletal muscle

Mattia Quattrocelli et al. J Clin Invest. 2015 Dec.

Abstract

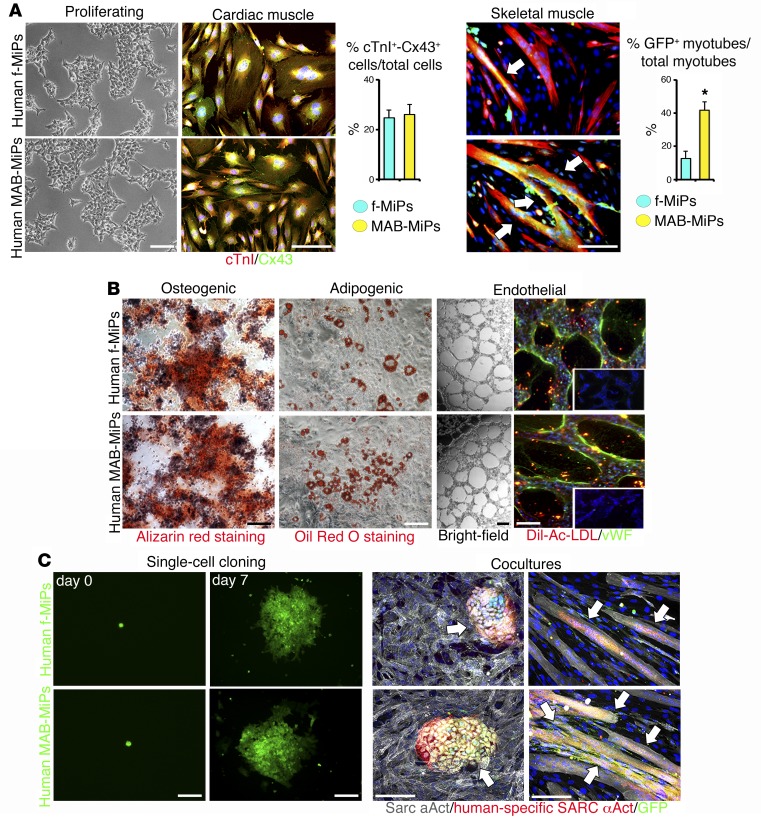
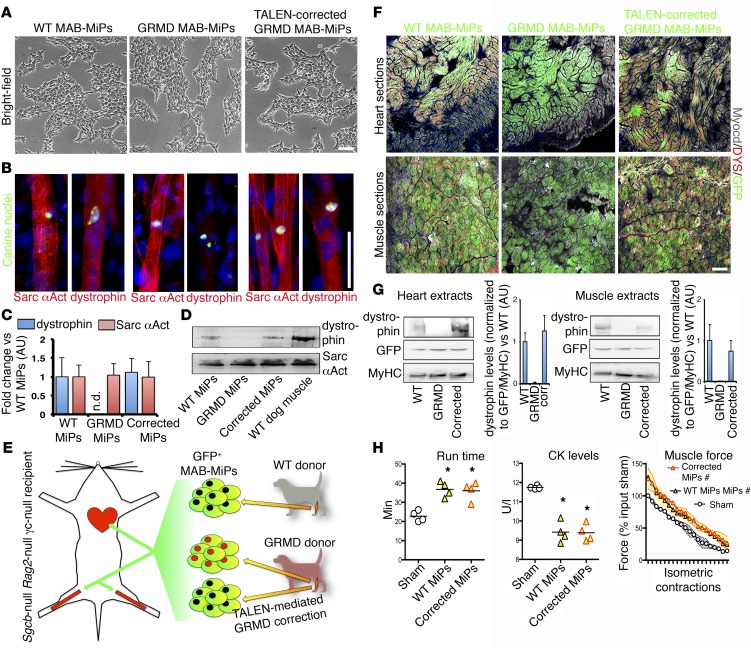
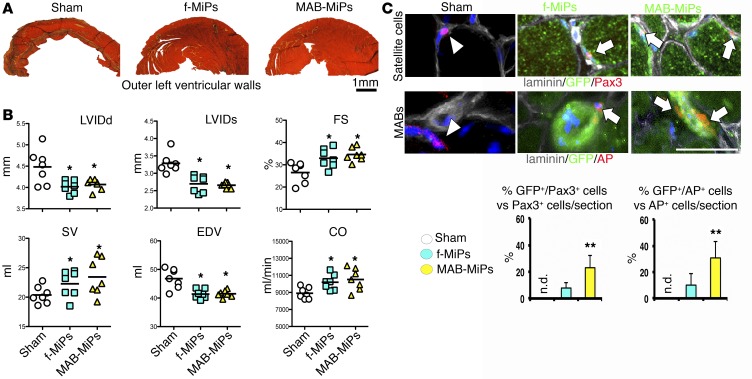
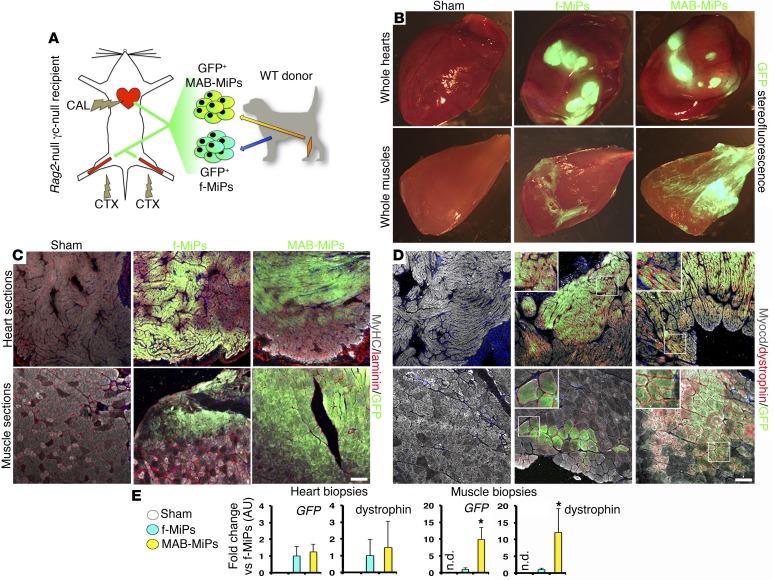
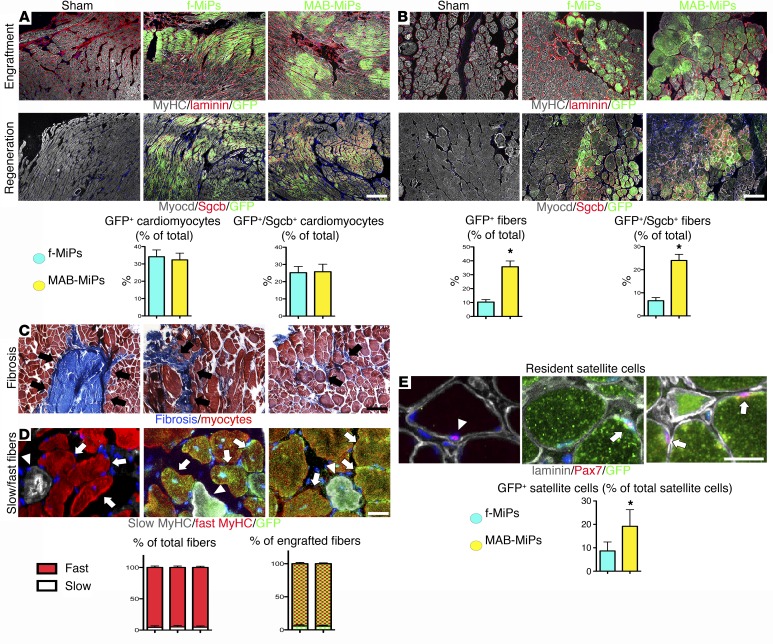
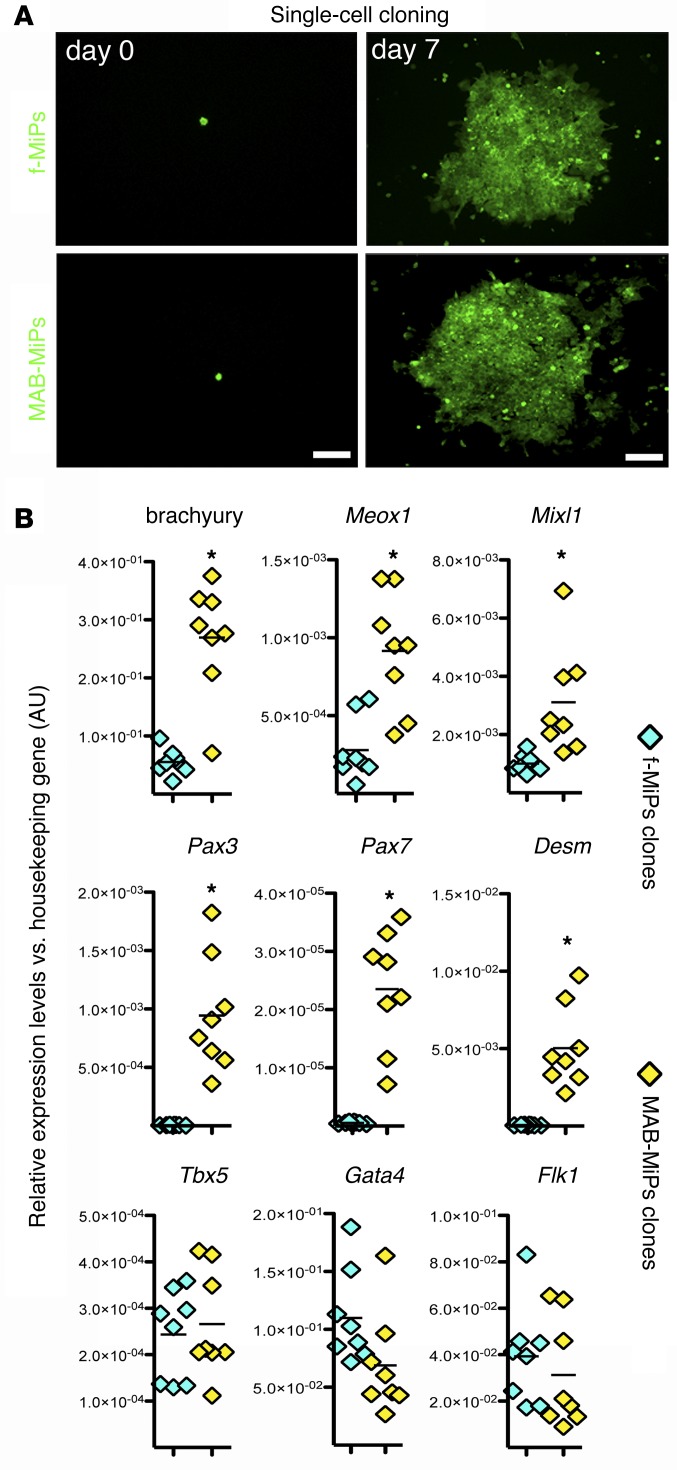
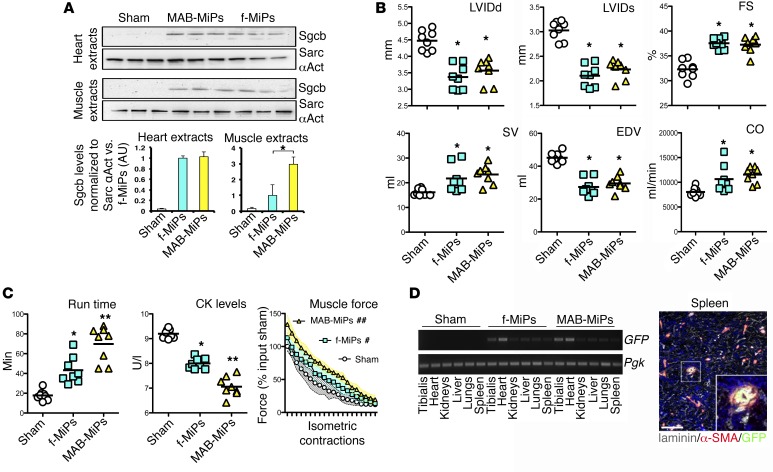
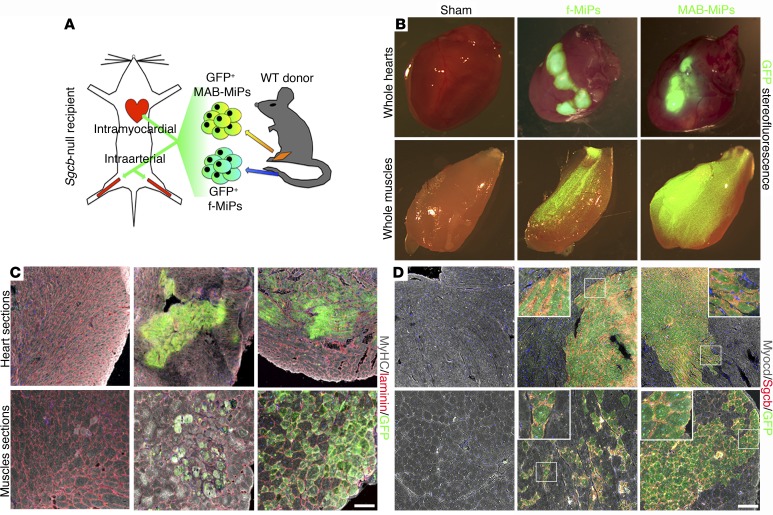
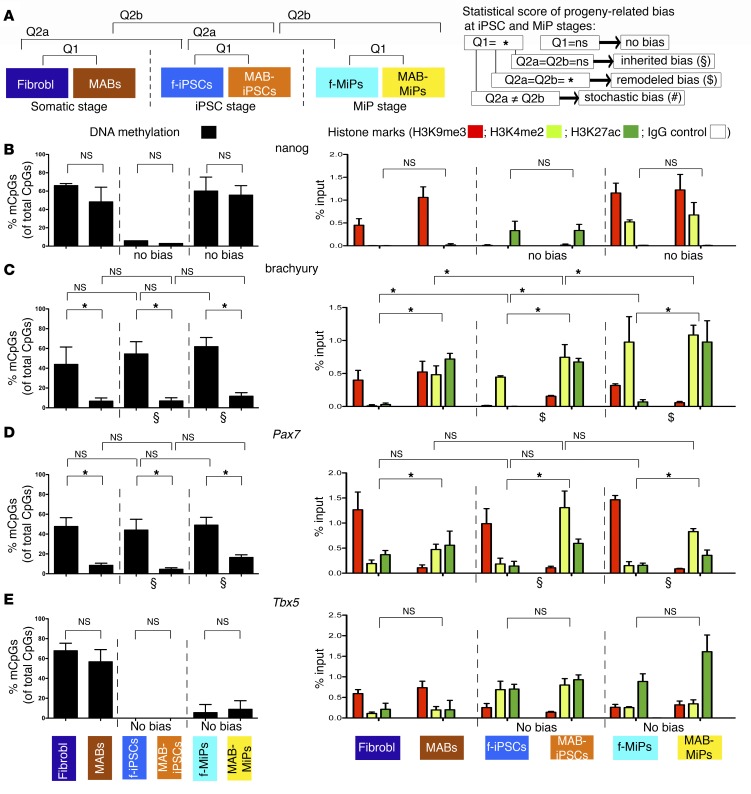
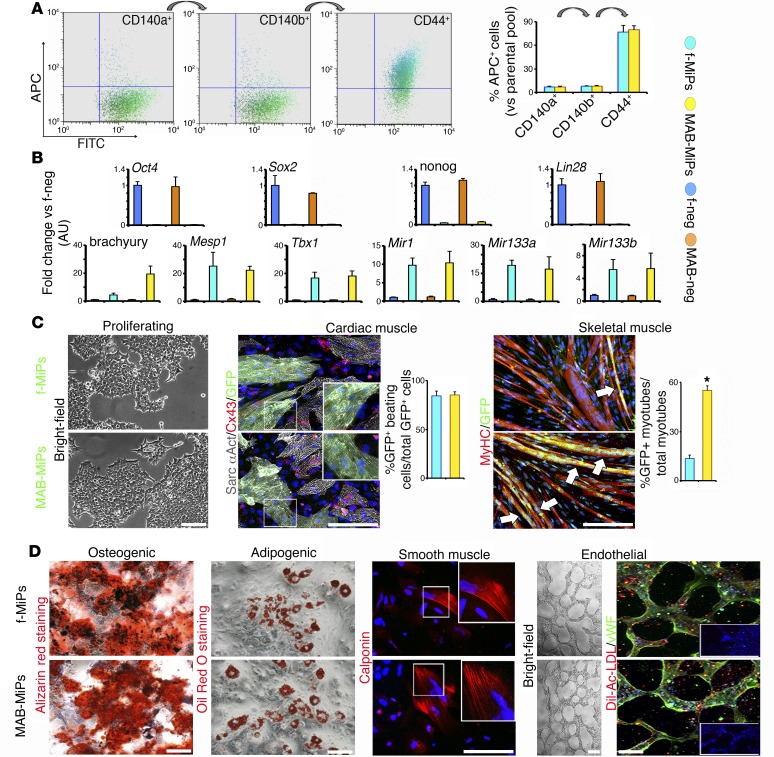
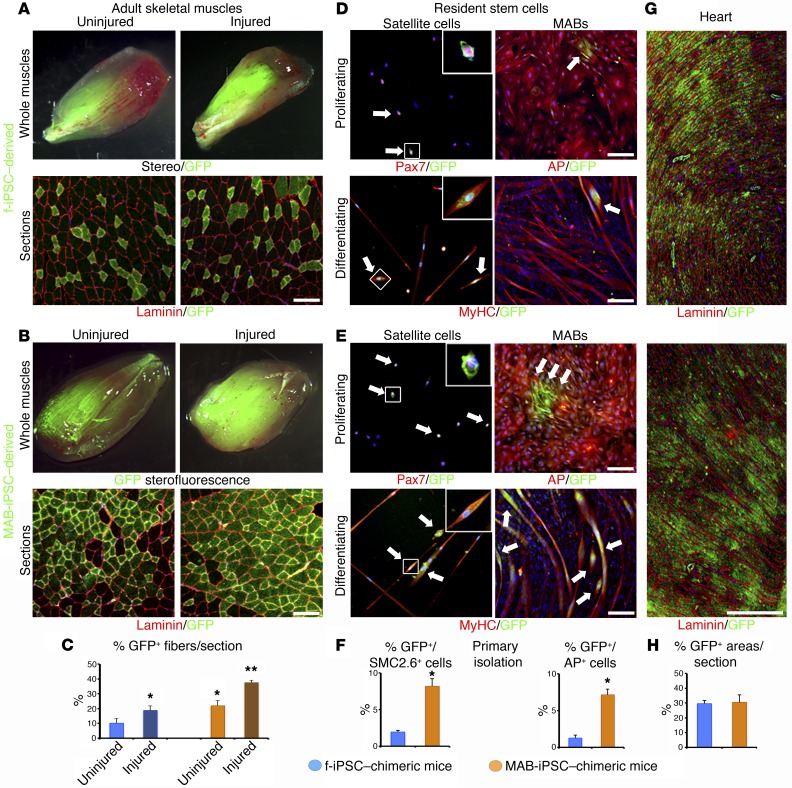
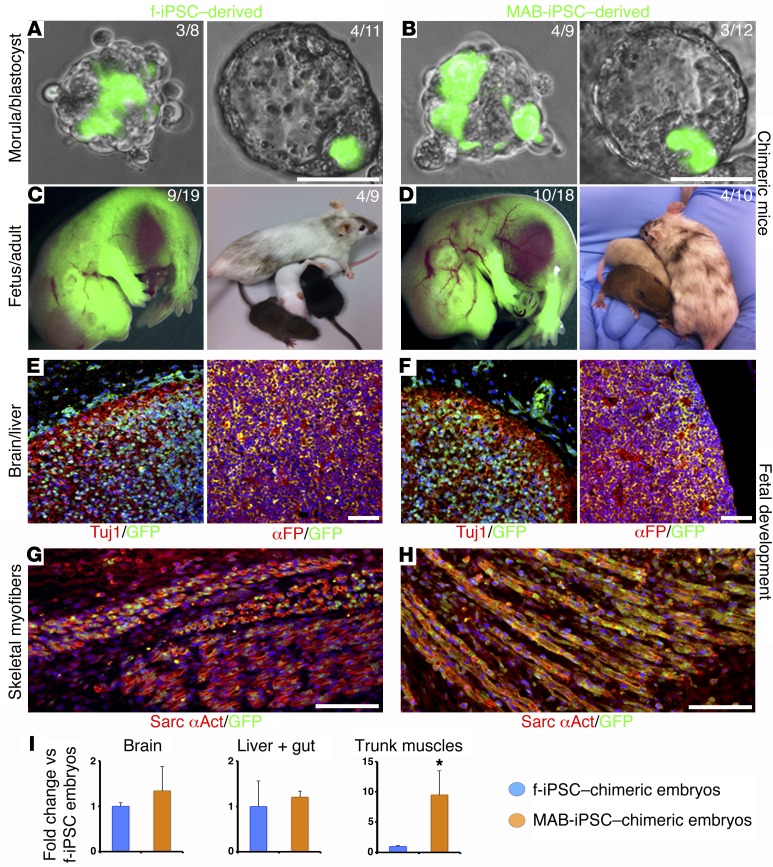
Conditions such as muscular dystrophies (MDs) that affect both cardiac and skeletal muscles would benefit from therapeutic strategies that enable regeneration of both of these striated muscle types. Protocols have been developed to promote induced pluripotent stem cells (iPSCs) to differentiate toward cardiac or skeletal muscle; however, there are currently no strategies to simultaneously target both muscle types. Tissues exhibit specific epigenetic alterations; therefore, source-related lineage biases have the potential to improve iPSC-driven multilineage differentiation. Here, we determined that differential myogenic propensity influences the commitment of isogenic iPSCs and a specifically isolated pool of mesodermal iPSC-derived progenitors (MiPs) toward the striated muscle lineages. Differential myogenic propensity did not influence pluripotency, but did selectively enhance chimerism of MiP-derived tissue in both fetal and adult skeletal muscle. When injected into dystrophic mice, MiPs engrafted and repaired both skeletal and cardiac muscle, reducing functional defects. Similarly, engraftment into dystrophic mice of canine MiPs from dystrophic dogs that had undergone TALEN-mediated correction of the MD-associated mutation also resulted in functional striatal muscle regeneration. Moreover, human MiPs exhibited the same capacity for the dual differentiation observed in murine and canine MiPs. The findings of this study suggest that MiPs should be further explored for combined therapy of cardiac and skeletal muscles.


Figures

Figure 12
Figure 12. In vitro characterization of myogenic propensity in human MiPs.
(A) After triple sequential sorting for CD140a/CD140b/CD44 from iPSC clones obtained from 3 independent donors, isogenic human GFP+ f- and MAB-MiPs displayed similar morphology. Consistent with murine and canine cells, f- and MAB-MiPs showed comparable efficiency in their differentiation toward cardiomyocyte-like (cTnI+-Cx43+) cells, whereas human MAB-MiPs showed greater myogenic potential in coculture with C2C12, evaluated as a propensity toward GFP+ chimeric myotubes (arrows). n = 4/MiP type. *P < 0.05 versus f-MiPs, Mann Whitney U test. Error bars represent SD. (B) Differentiation toward osteogenic, adipogenic, and endothelial lineages was robust and comparable between human f- and MAB-MiPs. n = 4/MiP type. Insets in B show negative staining control and proliferating cells at equal magnification (original magnification, ×20). (C) After single-cell clonal expansion, f-MiP and MAB-MiP clones were cocultured with cardiomyocytes and myoblasts of rodent origin. Immunostaining for human-specific Sarc αAct showed that the human-specific sarcomeric protein specifically colocalized with GFP+ engrafted cardiomyocyte clusters and myotubes (arrows), thus supporting the notion that MiP fusion correlates with terminal differentiation. n = 3/MiP type. Scale bars: ~100 μm.
Figure 11
Figure 11. TALEN-mediated correction of GRMD mutation and application in vivo.
Proliferation of WT, GRMD, and TALEN-corrected MAB-MiPs was indistinguishable (A), yet canine-specific dystrophin was detected only when WT and corrected MiPs were differentiated in low-ratio coculture with murine myoblasts, as shown by immunofluorescence (B), qPCR (C), and WB (D) analyses. (E) Schematic representation of the in vivo proof of TALEN-based canine MiP correction in dystrophic immunodeficient mice. Four weeks after injection, all MAB-MiPs robustly engrafted cardiac and skeletal muscles of Sgcb-null Rag2-null γc-null mice, but dystrophin was detected at comparable levels only in WT and corrected MiP–engrafted tissues, as shown by immunofluorescence imaging (F) and WB and densitometric analyses (G), albeit with interindividual variability. n = 4 mice/group. Kruskal-Wallis and Mann-Whitney U tests. (H) Four weeks after in vivo delivery, WT and corrected MAB-MiPs comparably induced improved treadmill performance, decreased serum CK levels, and increased the absolute force curve upon iterated isometric contractions. n = 4 mice/cohort. *P < 0.05 versus sham, Kruskal-Wallis and Mann-Whitney U tests. Each data point represents 1 animal. n = 4 mice/cohort. #P < 0.05 versus sham, 2-way ANOVA. Data represent average values, expressed as a percentage of input sham (average value at approximately 1 for sham muscles); ribbons depict the interval of SD. Scale bars: ~100 μm.
Figure 10
Figure 10. Canine MiPs regenerate the heart and engraft within resident stem cell pools in the skeletal muscle.
(A) Masson’s trichrome staining of whole-heart transversal sections showed dramatic amelioration of the outer left ventricular wall in terms of fibrosis and cardiomyocyte mass. (B) Accordingly, 3D echocardiographic results showed comparable improvement in adverse ischemic remodeling by f- and MAB-MiPs. n = 7 mice/group. *P < 0.05 versus sham, Kruskal-Wallis and Mann-Whitney U tests. Each data point refers to 1 animal. Error bars represent average values. (C) Immunofluorescence imaging and quantitation showed that MAB-MiPs contributed in greater numbers to the quiescent pools of satellite cells (Pax3+, underneath the sarcolemma) and MABs (AP+, juxtaposed with small vessels) in engrafted hind limb muscles than did f-MiPs (arrowheads indicate GFP resident cells; arrows indicate GFP+ engrafted resident cells). n = 7/group. **P < 0.05 versus f-MiPs, Mann-Whitney U test. Scale bar: ~50 μm.
Figure 9
Figure 9. Translation of MiP-based in vivo approach in xenograft settings with canine cells.
(A) Experimental plan of canine MiP dual injections in immunodeficient mice with heart damage induced by transient coronary artery ligation (CAL) and in the hind limb skeletal muscles induced by i.m. cardiotoxin (CTX) injections. Injected GFP+ f- and MAB-MiPs were isolated from the same WT donor (number 2). Four weeks after injection, canine f- and MAB-MiPs engrafted the myocardium at comparable levels, but not the hind limb muscles, where MAB-MiP engraftment rates appeared higher, as shown by stereofluorescence (B) (shown are tibialis anterior muscles) and immunostaining (C) (shown are gastrocnemius muscles). (D) Immunofluorescence analysis revealed comparable levels of GFP+ canine-specific dystrophin+ cardiomyocytes in MiP-treated animals, but significantly greater numbers of GFP+dystrophin+ myofibers in MAB-MiP-treated hind limb muscles. n = 7 mice/group. (E) qPCR analyses consistently showed that GFP expression levels were similar in injected hearts, yet increased in skeletal muscles (tibialis anterior), and that dystrophin levels followed a similar pattern. n = 7 mice/group. **P < 0.05 versus f-MiPs, unpaired t test. Error bars represent SD. Original magnification, ×40 for insets of selected areas; scale bars: ~100 μm.
Figure 8
Figure 8. Single-cell MiP clones recapitulate the differential propensity for skeletal muscle regeneration.
(A) Four weeks after injection, both f- and MAB-MiPs comparably engrafted the left ventricular wall, with no significant differences in GFP+ (engrafted) or GFP+Sgcb+ (regenerated) cardiomyocytes. (B) MAB-MiP clones engrafted and regenerated the hind limb muscles (shown are gastrocnemius muscles) to a significantly greater extent than did f-MiP clones, as quantitated in GFP+ and GFP+Sgcb+ fibers. n = 5 mice/cohort. *P < 0.05, Mann-Whitney U test. (C) Masson’s trichrome staining revealed conspicuous fibrotic scars (black arrows) in sham mice that were partially reduced in f-MiP–injected mice and even more reduced in MAB-MiP–injected mice (shown are gastrocnemius muscles; n = 5 mice/cohort). (D) Immunostaining for slow (arrowheads) and fast (arrows) fibers showed that both fiber types were engrafted in f-MiP– and MAB-MiP–injected mice (shown are gastrocnemius muscles). Quantitation of relative fiber type composition of whole-muscle sections and engrafted fibers revealed no significant differences among cohorts (data are related to gastrocnemius and tibialis anterior muscles; n = 5 mice/cohort; Kruskal-Wallis and Mann-Whitney U tests). (E) MAB-MiP clones engrafted the resident pool of Pax7+ satellite cells to a significantly greater extent than did f-MiPs. n = 5 mice/cohort. *P < 0.05, Mann-Whitney U test. Error bars represent SD. Scale bars: ~100 μm (AC) and 50 μm (D and E).
Figure 7
Figure 7. Single-cell clone characterization of f- and MAB-MiPs.
(A) Murine GFP+ MiPs were single-cell cloned by limiting dilution. (B) qPCR analysis showed significant upregulation of mesodermal markers (brachyury, Meox1, Mixl1) and skeletal myogenic markers (Pax7, Pax3, Desm), but no significant differences in cardiomyogenic markers (Tbx5, Gata4, Flk1), recapitulating what was observed in whole-cell pools. Data represent relative expression values (absolute expression normalized to the housekeeping gene), and each data point refers to the average value of 1 clone; n = 8 clones/MiP type. *P < 0.05, unpaired t test.
Figure 6
Figure 6. Functional regeneration of skeletal, but not cardiac, muscles is influenced by MiP myogenic propensity.
(A) WB and densitometric analyses of Sgcb protein in MiP-injected cardiac and skeletal muscle 4 weeks after injection. Consistent with the immunofluorescence data, Sgcb levels were comparable in MiP-treated myocardium samples and significantly higher in MAB-MiP–treated skeletal muscle (tibialis anterior) biopsies. n = 3/group. *P < 0.05, Mann-Whitney U test. Error bars represent SD. (B) 3D echocardiographic results showed cardiac functionality that was significantly and comparably ameliorated by f- and MAB-MiPs. (C) In contrast, the amelioration in treadmill performance (run time) and serum CK levels was markedly increased in MAB-MiP– versus f-MiP–treated mice. n = 8 mice/group. *P < 0.05 versus sham; **P < 0.05 versus sham and f-MiPs, Kruskal-Wallis and Mann-Whitney U tests. Each data point refers to 1 animal. Error bars represent average values. Accordingly, 8 weeks after injection, the absolute force measurement in EDL muscles under iterated bouts of isometric contraction showed significant improvement in the force curve in f-MiP–injected versus sham-injected mice, and in MAB-MiP– versus f-MiP–injected mice. n = 5 mice/group. #P < 0.05 versus sham; ##P < 0.05 versus sham and f-MiPs, 2-way ANOVA. Data represent average values expressed as a percentage of input sham (average value at approximately 1 for sham muscles); ribbons represent the interval of SD. (D) qPCR analysis of heart, skeletal muscles, and filter organs showed barely detectable GFP signal in liver, lungs, spleen, and kidneys 8 weeks after delivery of f- and MAB-MiPs. Immunofluorescence analysis revealed the occasional occurrence (generally ≤2 per section) of GFP+α-SMA+ small vessels in filter organs of MiP-treated animals (inset shows the spleen of an f-MiP–injected animal; n = 5 mice/cohort), suggesting very limited levels of off-target engraftment. Insets, ×40 magnification of selected areas; scale bars: ~100 μm.
Figure 5
Figure 5. In vivo combined regeneration of cardiac and skeletal muscles.
(A) Schematic representation of the parallel delivery system of GFP+ f- and MAB-MiPs injections into the myocardium and both femoral arteries of Sgcb-null dystrophic cardiomyopathic mice 3 months after birth. Four weeks after injection, both f- and MAB-MiPs comparably engrafted the myocardium, whereas MAB-MiPs engrafted the hind limb muscles (shown are tibialis anterior muscles) markedly more than did f-MiPs, as shown by stereofluorescence (B) and immunostaining (C). (D)Accordingly, immunofluorescence analysis showed comparable numbers of GFP+Sgcb+ cardiomyocytes in the heart, whereas a markedly greater number of GFP+Sgcb+ fibers were observed in MAB-MiP–treated muscles compared with those in f-MiP controls (gastrocnemius muscles are shown in D). n = 8 mice/group.
Figure 4
Figure 4. Differential myogenic propensity correlates with specific epigenetic signatures.
(A) At both iPSC and MiP stages, we compared the quantitative epigenetic data (methylation percentage by 1-way ANOVA and histone mark enrichment by 2-way ANOVA) of f- and MAB-derived cells in specific loci using a hierarchical system of three queries. Query 1 (Q1) addressed the difference between f- and MAB-derived cells within the same stage. When Q1 = *, we addressed the difference between each cell population and the related parental cells within the same progeny (Q2a, f progeny; Q2b, MAB progeny). When Q2a = Q2b = NS, the bias was considered inherited (§); when Q2a = Q2B = *, the bias was considered remodeled ($); finally, in cases of nonunivocal results (Q2a ≠ Q2b), the bias was considered stochastic (#). This statistical categorization was applied to both bisulphite sequencing (DNA methylation; data expressed as a percentage of methylated CpGs) and ChIP-qPCR data (H3K marks; data expressed as a percentage of input) of CpG islands of target genes. (B) Following this statistical model, the pluripotency marker nanog showed stage-specific changes in epigenetic cues, with no progeny-related bias (Q1 = NS). (C) The mesodermal marker brachyury showed inherited, progeny-related bias in methylation (§), but remodeled biases in histone marks ($). MAB-iPSCs and MAB-MiPs showed more permissive/activating epigenetic cues (lower methylation, higher levels of H3K4me2 and H3K27ac). (D) The skeletal myogenesis marker Pax7 presented inherited biases in both methylation and histone marks at both iPSC (§) and MiP (§) stages. MAB-derived cells showed a durable bias in lower methylation and permissive/activating histone marks. (E) Conversely, the cardiac myogenesis marker Tbx5 showed stage-specific shifts in methylation and histone marks, with no significant progeny-related bias (Q1 = NS). Both MiP types showed low methylation levels and enrichment in H3K27ac. n = 3/cells pool. *P < 0.05, 1-way ANOVA with Bonferroni’s multiple comparisons test for DNA methylation analysis; 2-way ANOVA with Bonferroni’s multiple comparisons test for histone mark analysis. All analyses included data from isogenic clones from 3 syngeneic individuals. fibrobl, fibroblasts; mCpGs, methylated CpGs.
Figure 3
Figure 3. Isolation and characterization of murine MiPs.
(A) MiPs were isolated by triple sequential sorting for CD140a, CD140b, and CD44 from GFP+ iPSCs with respect to both MiP (f- and MAB-MiPs) and negative (f-neg and MAB-neg) pools. At all steps, positive fraction yields were quantitatively comparable between f- and MAB-derived MiPs. (B) SYBR Green– and TaqMan-based qPCR analyses showed that pluripotency factors (Oct4, Sox2, nanog, and Lin28) were downregulated, whereas gene and miR markers of mesodermal transition and maturation (brachyury, Mesp1, Tbx1, Mir1, Mir133a, and Mir133b) were upregulated in both f- and MAB-MiPs compared with the negative pools (n = 3/MiP type). Error bars represent SD. (C) GFP+ MiPs had comparable morphologies during proliferation and differentiated into beating cardiomyocyte clusters in combination with neonatal rat cardiomyocytes at comparable rates (original magnification, ×40 for insets of selected areas, showing a mature Sarc αAct pattern). Intriguingly, after coculture with myoblasts, MAB-MiPs resulted in higher numbers of GFP+ myotubes (arrows) as compared with f-MiPs. n = 4/MiP type. *P < 0.05 versus f-MiPs, Mann Whitney U test. Error bars represent SD. (D) Under opportune stimulations in vitro, both f- and MAB-MiPs showed the capacity to undergo osteogenic (alizarin red staining), adipogenic (Oil Red O staining), smooth muscle (immunofluorescence staining for calponin; original magnification, ×40 for insets of selected areas, showing partial fibrillar organization), and endothelial differentiation (tubular structures formed on a Geltrex layer; left panels) and were characterized by deposition of endothelium-specific extracellular matrix (von Willebrand factor [vWF]) and uptake of Dil-Ac-LDL at comparable rates (insets show the negative staining control and proliferating cells at equal magnification). n = 4/MiP type. Scale bars: ~100 μm.
Figure 2
Figure 2. Myogenic memory influences contribution to skeletal muscle fibers and resident stem cells.
(AC) Adult chimeric mice showed an increased number of GFP+ myofibers in hind limb muscles after regeneration of acute injury (A and B), suggesting chimeric contribution also to the resident stem cell pools. In addition, MAB-iPSC–chimeric mice displayed a greater chimeric contribution in both conditions as compared with f-iPSC–chimeric mice (C). (D and E) Once purified from the uninjured muscles, primary pools of satellite cells and MABs appeared chimeric at passage 0, with larger GFP+ subfractions (arrows) in the cell pools from MAB-iPSC mice, in both proliferation (D) and differentiation (E) stages. Quantitative difference in the GFP+ subfractions was confirmed by cytometry (F). (GN) In contrast, MAB-iPSCs and f-iPSCs did not apparently differ in the GFP+ contribution to the myocardium (GH). n = 4 mice/iPSC type. *P < 0.05 versus uninjured f-iPSC mice; **P < 0.05 versus injured f-iPSC mice, Kruskal-Wallis and Mann-Whitney U tests. Error bars represent SD. Original magnification, ×40 (insets) of selected areas; scale bars: ~100 μm.
Figure 1
Figure 1. Analysis of myogenic propensity of iPSCs in fetal chimeric tissues.
(AH) Isogenic GFP+ f- and MAB-iPSCs contributed at comparable rates to chimeric morulae and blastocysts (A and B) and to chimeric fetuses (E14.5) and fertile adults (C and D). Rates of GFP+ chimeric embryos are reported for each stage (n = 5/iPSC line). However, immunofluorescence analysis of fetal tissues at E14.5 revealed comparable levels of GFP contribution to brain and liver (E and F) and unequal contribution levels (higher for MAB-iPSCs) to nascent somitic myofibers (G and H) (n = 6 embryos/iPSC type for fetal tissue analyses). Scale bars: ~50 μm (A and B) and ~100 μm (CH). (I) At E14.5, qPCR analyses of dissected tissues from chimeric fetuses showed significantly higher GFP expression levels in the trunk muscles of MAB-iPSC chimeric fetuses compared with levels detected in f-iPSC chimeric fetuses (*P < 0.05, n ≥3/iPSC type, Mann-Whitney U test). Error bars represent SD. αFP, α-fetoprotein.

Comment in

References

    1. Doulatov S, Daley GQ. Development. A stem cell perspective on cellular engineering. Science. 2013;342(6159):700–702. doi: 10.1126/science.1238363. - DOI - PubMed
    1. Costamagna D, et al. Fate choice of post-natal mesoderm progenitors: skeletal versus cardiac muscle plasticity. Cell Mol Life Sci. 2014;71(4):615–627. doi: 10.1007/s00018-013-1445-7. - DOI - PMC - PubMed
    1. Emery AE. The muscular dystrophies. Lancet. 2002;359(9307):687–695. doi: 10.1016/S0140-6736(02)07815-7. - DOI - PubMed
    1. Verhaert D, Richards K, Rafael-Fortney JA, Raman SV. Cardiac involvement in patients with muscular dystrophies: magnetic resonance imaging phenotype and genotypic considerations. Circ Cardiovasc Imaging. 2011;4(1):67–76. doi: 10.1161/CIRCIMAGING.110.960740. - DOI - PMC - PubMed
    1. McNally EM, et al. Contemporary cardiac issues in duchenne muscular dystrophy. Circulation. 2015;131(18):1590–1598. doi: 10.1161/CIRCULATIONAHA.114.015151. - DOI - PMC - PubMed

Publication types