. 2015 Dec;18(12):1832-44.
doi: 10.1038/nn.4171. Epub 2015 Nov 16.

Canonical genetic signatures of the adult human brain

Affiliations

Canonical genetic signatures of the adult human brain

Michael Hawrylycz et al. Nat Neurosci. 2015 Dec.

Abstract

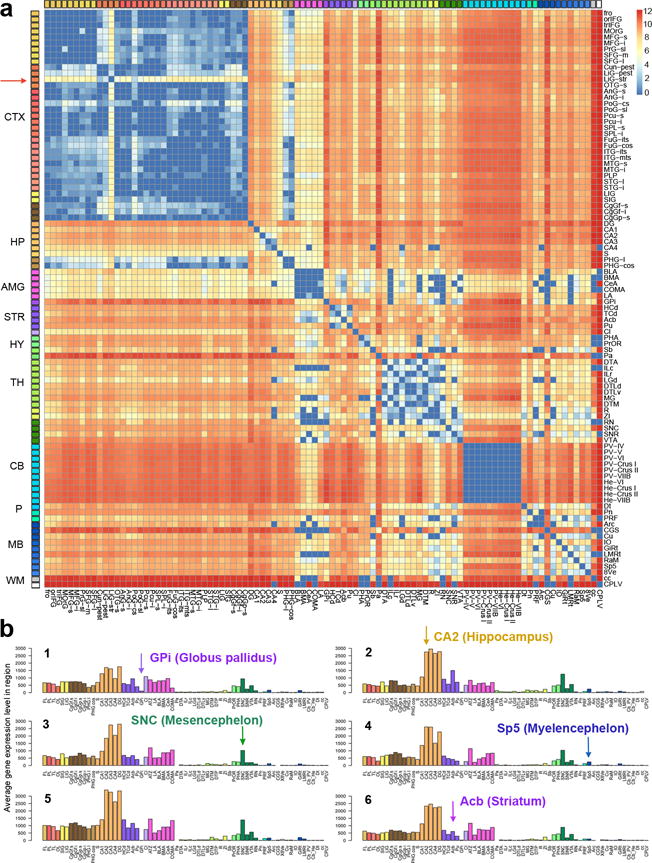
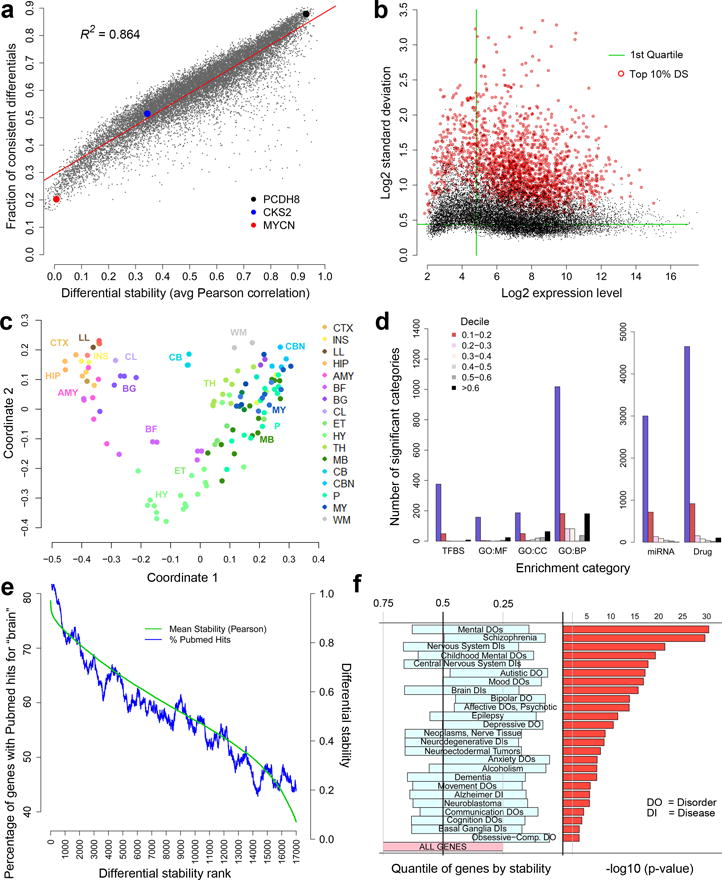
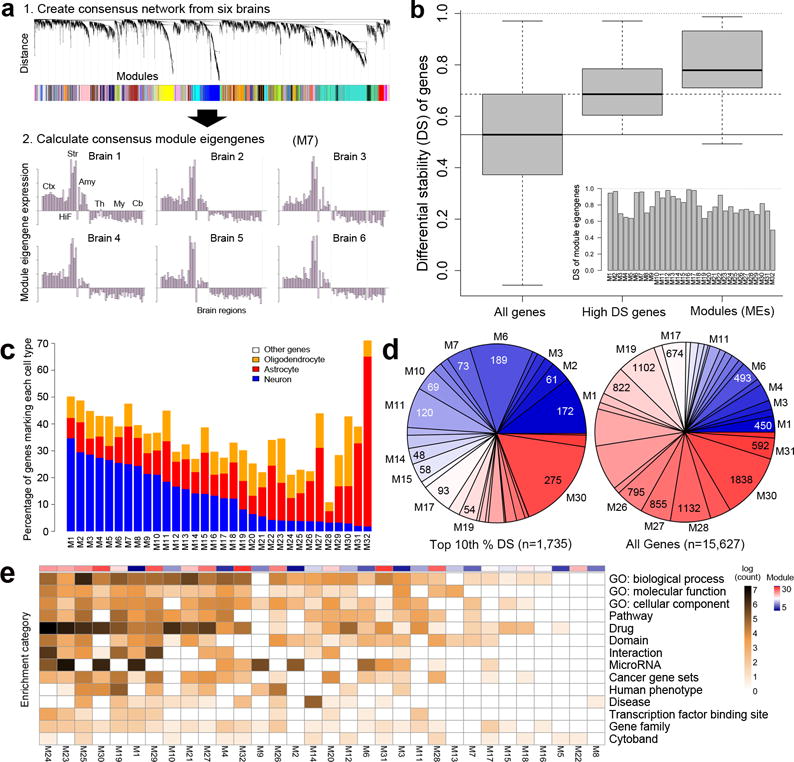
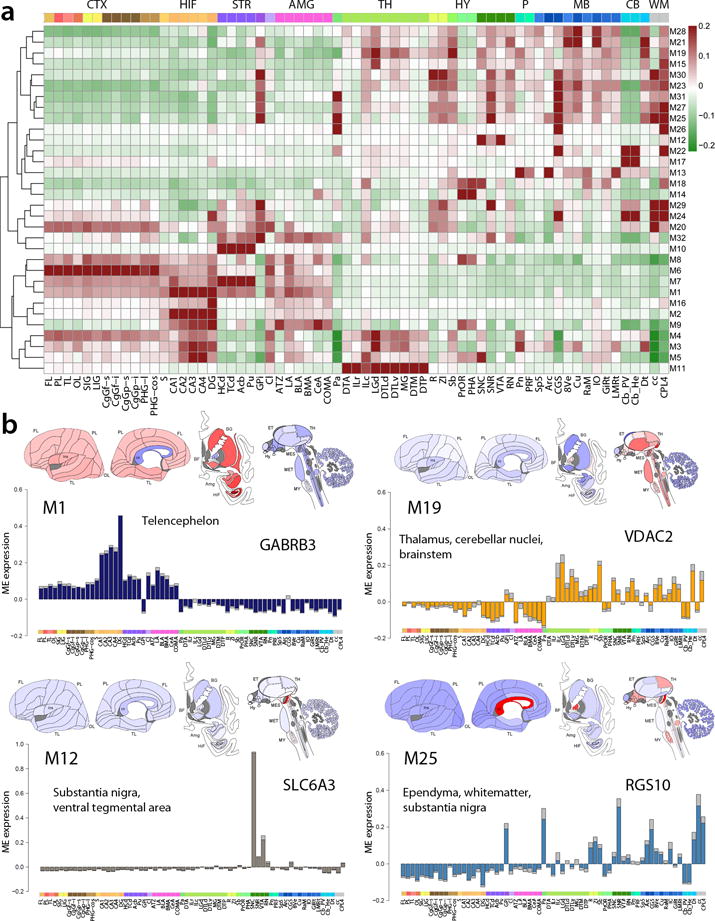
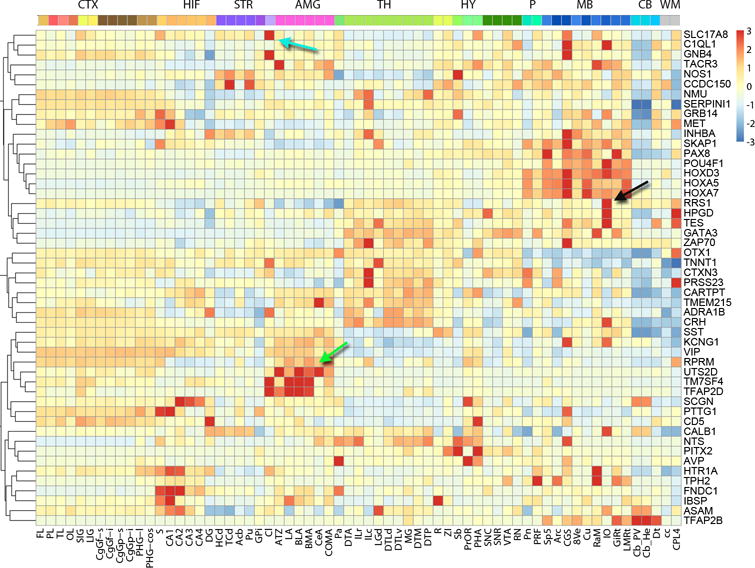
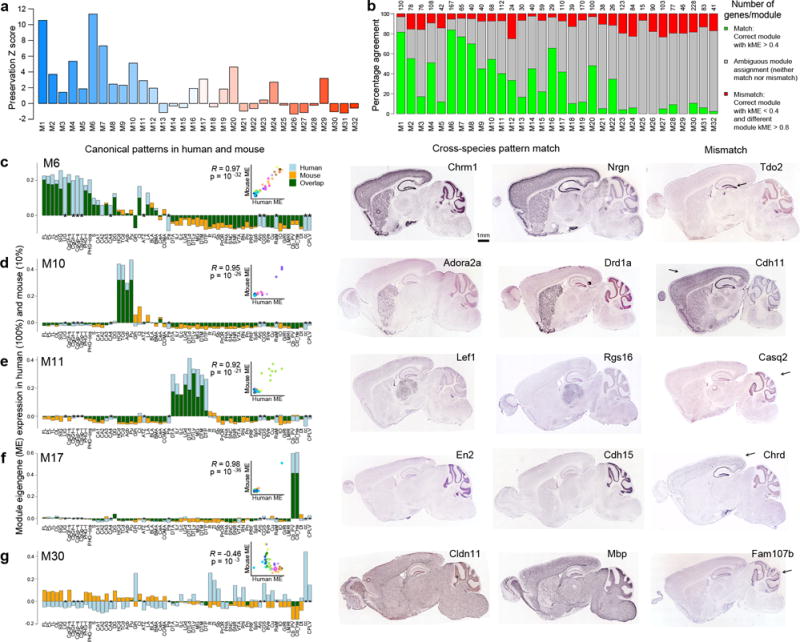
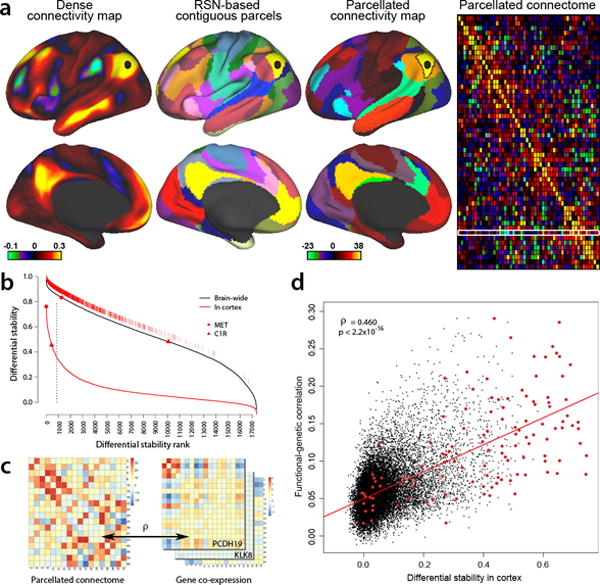
The structure and function of the human brain are highly stereotyped, implying a conserved molecular program responsible for its development, cellular structure and function. We applied a correlation-based metric called differential stability to assess reproducibility of gene expression patterning across 132 structures in six individual brains, revealing mesoscale genetic organization. The genes with the highest differential stability are highly biologically relevant, with enrichment for brain-related annotations, disease associations, drug targets and literature citations. Using genes with high differential stability, we identified 32 anatomically diverse and reproducible gene expression signatures, which represent distinct cell types, intracellular components and/or associations with neurodevelopmental and neurodegenerative disorders. Genes in neuron-associated compared to non-neuronal networks showed higher preservation between human and mouse; however, many diversely patterned genes displayed marked shifts in regulation between species. Finally, highly consistent transcriptional architecture in neocortex is correlated with resting state functional connectivity, suggesting a link between conserved gene expression and functionally relevant circuitry.


Figures

Figure 1
Figure 1. Reproducible differential gene expression between brain regions across six individuals
(a) Consensus map of all genes differentially expressed between any pair of 96 regions in at least five of six specimens. Each matrix entry represents the number of genes with at least a fold change > 3 in expression level between those two structures (unpaired t-test, Benjamini & Hochberg FDR corrected q-value q< 0.01). The scale is log base 2 with deep blue indicating no genes that are differentially expressed above threshold. Large differences between major brain structures are apparent, with comparative homogeneity within structures such as cerebellum, amygdala, and cerebral cortex. LiG-str (Lingual Gyrus – striate cortex) contains primary visual cortex (red arrow), which shows differential expression relative to the rest of cerebral cortex. (b) Consistent expression pattern of PCDH8 across individual brains (numbered 1–6), with cortical and cerebellar samples reduced to major lobes (shown for 65/132 structures for readability) (FL: frontal lobe, OL: occipital lobe, TL: temporal lobe, PL: parietal lobe). CTX: cortex; HP: hippocampus; AMG: amygdala; STR: striatum; HY: hypothalamus; TH: thalamus; CB: cerebellum; P: pons; MB: midbrain; WM: white matter; GPi, Globus pallidus, internal segment; CA2, Hippocampal CA2 subfield; SNC, substantia nigra, pars compacta; Sp5, spinal trigeminal nucleus; Acb, nucleus accumbens.
Figure 2
Figure 2. Relationship of DS to brain structure, function and disease
(a) DS is strongly correlated with the fraction of conserved differential gene expression relationships between brain regions (81 regions in >=5/6 brains, averaged across each pair of brains). PCDH8 (black) has high DS, whereas CKS2 (blue) and MYCN (red) show greater variability among individuals. (b) Variation over 132 structures (s.d.) versus expression level for all 17,348 genes. There is no significant relationship between the highest DS genes (top 10% highlighted in red), and expression level (ρ=0.064). Green lines indicate 25th percentile in mean expression level and s.d., respectively. (c) Multi-dimensional scaling analysis to represent transcriptional similarity between anatomical structures using the top 10% of DS genes. Anatomical subdivisions generally cluster according to their membership in major brain structures, common ontogenetic origin and topographic proximity (see Supplementary Table 1 for abbreviations). (d) Highest DS genes are significantly overrepresented (B&H corrected, FDR q<0.01) in functional annotations, dramatically so for drug targets (TFBS=transcription factor binding site; GO:MF=Gene Ontology Molecular Function; CC=Cellular Component; BP=Biological Process; miRNA = miRNA binding site). (e) Strong relationship between DS rank and frequency of study in the literature. Genes ordered by DS score on x-axis; the y-axis shows the fraction of genes in sliding windows of 600 genes (blue) scored for brain citation based on PubMed queries of the form “gene name” + “brain” (scoring 0 no hit, 1 for positive hits). (f) DS distribution of genes associated with brain diseases relative to all genes, showing the 25th to 75th percentile range for each gene set from Autworks (left panel). Diseases are sorted by a hypergeometric test (right panel), assessing significance of overlap between each gene set and the top 10% of DS genes (-log10 p-values).
Figure 3
Figure 3. Consensus co-expression patterns of the adult brain
(a) Schematic showing network construction using consensus WGCNA on high DS genes. Panel 1: Assignment of genes to modules. Panel 2: Module eigengene expression for M7 showing consistent patterning across all 6 brains with peak expression in the striatum. (b) Distribution of DS scores for all genes (left) and genes with ΔBR> 0.528 used for initial network construction (middle). DS metric applied to MEs demonstrates very high consistency of module patterns across brains (right). Inset shows DS score for each ME. (c) Percentage of known neuron, astrocyte and oligodendrocyte-enriched genes in 32 modules, ordered by proportion of neuron-enriched gene membership. (d) Module composition for the top 10% of DS genes (left) versus all genes (right), with modules color-coded from high (blue) to low (red) neuron-enriched gene membership. Note larger proportion of genes assigned to more neuronal modules for high DS genes compared to all genes. (e) Majority of gene annotations are associated with a subset of modules. Log counts of number of significant (B&H corrected, FDR q<0.05) enrichments for gene ontology terms, protein interaction, cytoband, gene families, pathways, and drug interactions. Modules ordered from most (M24, left) to fewest (M8, right) annotations, with neuron-enriched gene membership indicated in top color bar.
Figure 4
Figure 4. Anatomical specificity of module expression
(a) Hierarchical clustering of the modules M1-M32 with anatomic ordering fixed from cortex to brainstem. Individual modules are enriched in specific structures, with a major partition between predominantly telencephalic versus deeper brain region enrichment. (b) Anatomical patterning of 4 representative modules with average ME expression values plotted on brain diagrams and on bar plots (SEM error), with a representative hub gene. Anatomical structures (color-coded by major structure) ordered from neocortex (left) to brainstem (right). Plots for all modules provided in Supplementary Figures 5–8.
Figure 5
Figure 5. Unique anatomical patterning of a subset of high DS genes
Relative (z-score normalized) expression of 50 genes (rows) across anatomical structures (columns) ordered from cortex to brainstem, clustered by expression pattern. The solute carrier family 17, member 8 (SLC17A8) gene is primarily expressed in the claustrum (Cl, cyan arrow), ribosome biogenesis regulator homolog (RRS1) is enriched in the inferior olivary nucleus (IO, black), and urotensin 2B (UTS2D, green) in the amygdala. These anatomically specific genes have low correlation with any of the 32 major modules.
Figure 6
Figure 6. Module preservation from human to mouse
(a) Mouse-human module preservation index, which measures conserved within-module gene co-expression in an anatomy-independent fashion, shows the highest preservation of some of the most neuronal modules (M1, M6, M7). (b) Conservation of anatomical patterning, defined as the proportion of mouse genes correlated at ρ > 0.4 to the corresponding human ME (green bars). A subset of genes in each module are both poorly correlated to the human eigengene (gray bars), and very highly correlated to a different human module eigengene (ρ > 0.8, red bars). (cg) Correspondence of ME anatomical patterning between human and mouse. Histogram representation of ME pattern in human (light blue) and mouse (orange), with overlap in green, demonstrating highly conserved patterns for M6, M10, M11 and M17, while M30 is weakly anti-correlated. Inset panels show correlation between mouse and human. Asterisks indicate samples present in human but not mouse. Mouse ISH for genes with matching and mismatched patterns in right panels, representing genes in the green and red categories in (b). Arrows indicate areas of differential regulation in mouse. All ISH images from the Allen Mouse Brain Atlas.
Figure 7
Figure 7. Cortical DS and Functional Connectivity
(a) Resting-state functional connectivity from Human Connectome Project (HCP) data (www.humanconnectome.org;, ). (Column 1): Functional connectivity from a seed in lateral parietal cortex (black disk), based on a group-average of 468 HCP subjects and showing the full correlation results (scale: Fisher z-transformed ρ); dataset accessible via https://db.humanconnectome.org/data/projects/HCP_500). (Column 2): 52 left-hemisphere contiguous parcels (50 mm2 or larger) from the 17 resting-state networks (RSN) identified by Yeo et al. (2011). (Column 3): parcellated connectivity map for a default-mode network (DMN) parcel (black outline) containing the selected seed, based on 447 HCP subjects (a subset of the above 468) and using partial correlation (scale: z-score). (Column 4): Group-average (n=447) parcellated connectome showing relative connection strength between regions, also based on partial correlation. White rectangular outline identifies connectivity map shown in col. 3. (b) Ranked cortical DS genes (solid red) and brain wide DS genes (black). Top 5th percentile g=867 cortex DS genes (vertical line) are shown as hatch marks just above the whole-brain DS curve. Red disk and triangle show two genes with differing brain-wide and cortical DS. (c) Functional correlation of parcellated RSN connectome (left panel) is compared with genetic co-expression similarity for each gene in each subject (right panel), using the same set of cortical parcels and by calculating the Pearson’s correlation between the vectorized upper diagonal elements of the matrices. (d) DS versus functional-genetic correlation for 17,348 genes. Higher cortical DS genes are more predictive of functional cortical connectivity (ρ=0.46, p<2.2e-16), whereas the correlation is substantially weaker for brain wide DS (ρ=0.17; data not shown). Red points are 132 genes identified as drivers of functional connectivity in a postmortem brain tissue data set whose polymorphisms significantly affect resting-state functional connectivity in a large sample of healthy adolescents.

Comment in

References

    1. Manolio TA, Collins FS. The HapMap and genome-wide association studies in diagnosis and therapy. Annual review of medicine. 2009;60:443–456. - PMC - PubMed
    1. McCarthy MI, Hirschhorn JN. Genome-wide association studies: potential next steps on a genetic journey. Human molecular genetics. 2008;17:R156–165. - PMC - PubMed
    1. Hawrylycz M, et al. An anatomically comprehensive atlas of the adult human brain transcriptome. Nature. 2012;489:391–399. - PMC - PubMed
    1. Kang HJ, et al. Spatio-temporal transcriptome of the human brain. Nature. 2011;478:483–489. - PMC - PubMed
    1. Oldham M, et al. Functional organization of the transcriptome in human brain. Nature neuroscience. 2008;11:1271–1282. - PMC - PubMed

Publication types