Case Reports
. 2015 Dec;18(12):1731-6.
doi: 10.1038/nn.4169. Epub 2015 Nov 16.

Mutations in NONO lead to syndromic intellectual disability and inhibitory synaptic defects

Collaborators, Affiliations
Case Reports

Mutations in NONO lead to syndromic intellectual disability and inhibitory synaptic defects

Dennis Mircsof et al. Nat Neurosci. 2015 Dec.

Abstract

The NONO protein has been characterized as an important transcriptional regulator in diverse cellular contexts. Here we show that loss of NONO function is a likely cause of human intellectual disability and that NONO-deficient mice have cognitive and affective deficits. Correspondingly, we find specific defects at inhibitory synapses, where NONO regulates synaptic transcription and gephyrin scaffold structure. Our data identify NONO as a possible neurodevelopmental disease gene and highlight the key role of the DBHS protein family in functional organization of GABAergic synapses.


Conflict of interest statement

COMPETING FINANCIAL INTERESTS

The authors declare no competing financial interests.

Figures
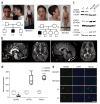
Figure 1
Figure 1
NONO mutations and their functional consequences. (a) Photographs and pedigree of both patients. Filled symbols indicate the affected individuals. (b) Sagittal T1 and axial FSE T2 brain MRI of patient MCCID1 at 9 years old (left) and MCCID2 at 8 years old (right) showing a thick corpus callosum, small cerebellum and Chiari I malformation (arrows). (c) Immunoblots showing an absence of the NONO protein and overexpression of PSPC1 and SFPQ proteins in patients’ cells compared to controls (C1 and C2). (d) Quantification of DBHS protein levels relative to the amount of total proteins, expressed as percentage of control values. Box plot derived from two independent experiments with two technical replicates; whiskers show minimum and maximum values; center line represents median; and box limits represent interquartile range. Significance was calculated using two-way analysis of variance (ANOVA) test with Sidak correction and P = 0.008268 for NONO, 0 for SFPQ and 0 for PSPC1. Here and in subsequent figures, *P < 0.05, **P < 0.01, ***P < 0.001, ****P < 0.0001. (e) Immunofluorescence showing the absence of the NONO protein in patients’ cells and presence in controls. Scale bar represents 50 μm.
Figure 2
Figure 2
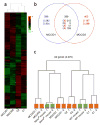
Transcriptome analysis in human and mouse cells. (a) Heat map cluster analyses indicating similarity in expression profile among probes from the two patients and differences compared to the two controls. High detection signals relative to the mean are red, low detection signals are green. The cut-off for inclusion in the heat map was a 1.5-fold alteration of probe expression for both patients. Color scale ranges between −0.5 (green) and 0.5 (red). (b) Venn diagram showing the number of genes expressed in common or differentially expressed in the two patients compared to the mean of the two controls. Significant differences are based on a 1.5-fold difference and P < 0.05. U, up; D, down. (c) Hierarchical clustering analysis of combined mouse and human orthologous genes, resulting in a separation highlighting similarity of mouse and human transcriptional dysregulation. WT, wild type. Human samples are shown in orange and mouse samples are shown in green.
Figure 3
Figure 3
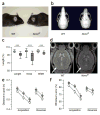
Functional consequences of NONO deficiency in mice. (a) Side view of representative Nonogt mouse (right) compared to wild-type littermate (WT, left). (b) CT scan analysis indicating a flattened and distorted nose in Nonogt mice (right) compared to WT (left). (c) Box-and-whisker quantification of skull length, width and nose length in Nonogt mice (gray) compared to wild-type littermate (white) (center, meridian; box limit, quartiles 1 and 3; whiskers, minimum and maximum). n = 20 mice per genotype. ***P < 0.001; Student’s t-test. (d) MRI scan of representative Nonogt mouse (right) compared to wild-type littermate (left). Arrows indicate cerebellum. Also see Supplementary Figure 5 and Supplementary Table 4. (e, f) Behavior of Nonogt mice and WT littermates in Morris water maze, n = 16–20 per genotype. Gray, Nonogt; white, WT. Bars represent means ± s.e.m. (e) Gallagher’s proximity test scores (average distance of mice from goal as fraction of total distance). Repeated ANOVA, gene P < 0.0237, time P < 0.001, interaction P = 0.9869. (f) Whishaw’s error (percentage of path outside an 18-cm-wide corridor connecting release point and goal). Gene P < 0.0215, time P < 0.001, interaction P = 0.7927.
Figure 4
Figure 4
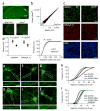
Effects of NONO deficiency on synaptic biology. (a) Immunofluorescence labeling of NONO in wild-type (WT; top) and Nonogt (bottom) mouse coronal brain sections. PL, pyramidal cell layer; DG, dentate gyrus. Scale bars, 250 μm. (b) Scatter plot of hippocampal transcriptome from WT and Nonogt mice. Red, differentially expressed genes, P ≤ 0.01 and log ratio ≥ 0.5. Blue lines indicate twofold difference. (c) Immunohistochemical staining for inhibitory postsynaptic marker gephyrin (green), GABAAR α2 receptor (red) and the presynaptic marker vGAT (blue) in WT and Nonogt mice in the CA3 stratum radiatum of the hippocampus. Scale bars, 5 μm. (d) Left, scatter plot quantification of gephyrin and GABAR α2 relative to VGAT density. Right, frequency distribution of gephyrin cluster size. White circles, WT; black circles, Nonogt. (e–l) Immunofluorescence analysis of gephyrin postsynaptic clusters in vitro. (e–g) Primary hippocampal rat neurons expressing control GFP-gephyrin alone (e), coexpressed with myc-NONO (f) or coexpressed with RNA binding-deficient myc-NONO-RRM (g). Boxed region is magnified beneath. (h–j) Primary hippocampal rat neurons expressing control GFP-gephyrin alone (h), coexpressed with myc-NONO-RRM (i) or coexpressed with myc-NONO-RRM and GABAAR α2 (j). Scale bars, 10 μm. (k) Quantification of gephyrin cluster density in e–g by normal density distribution modeling, in 9 neurons from each of 3 independent experiments. Control × NONO P = 0.001, control × myc-NONO-RRM P = 0.009 using Kolmogorov-Smirnov test. (l) Identical curve-fit quantification of gephyrin clusters in h–j, showing complete rescue of the in h–j, showing complete rescue of the impaired gephyrin cluster distribution by GABAAR α2 overexpression. Control × NONO-RRM P = 0.009, control × NONO-RRM + GABAAR α2 P = 0.563, NONO-RRM × NONO-RRM + GABAAR α2 P = 0.014 using Kolmogorov-Smirnov test.
Figure 5
Figure 5
GABA receptor overexpression rescues synaptic structural defects. (a) Fluorescence microscopy of hippocampal slices after unilateral stereotactic injection of AAV expressing pHluorin- tagged GABAAR α2. Scale bar, 500 μm. (b) Immunohistochemical staining for GFP (green, left), gephyrin (red, middle) and the presynaptic marker GAD65 (blue) in wild-type (rows 1 and 2) and Nonogt mice (rows 3 and 4) in the stratum and Nonogt mice (rows 3 and 4) in the stratum radiatum of CA3 in the hippocampus in the absence (rows 1 and 3) or presence (rows 2 and 4) of AAV expressing pHluorin-tagged GABAAR α2. Scale bars, 20 μm. (c) Quantification of gephyrin relative to GAD65 density, which was unchanged across experimental conditions. Scatter plot shows data points for 4–7 mice; WT × Nonogt AAV–, P = 0.013; WT × Nonogt AAV+, P = 0.042; Student t-test.

References

    1. Fox AH, Bond CS, Lamond AI. P54nrb forms a heterodimer with PSP1 that localizes to paraspeckles in an RNA-dependent manner. Mol Biol Cell. 2005;16:5304–5315. - PMC - PubMed
    1. Myojin R, et al. Expression and functional significance of mouse paraspeckle protein 1 on spermatogenesis. Biol Reprod. 2004;71:926–932. - PubMed
    1. Shav-Tal Y, Zipori D. PSF and p54nrb/NonO – multi-functional nuclear proteins. FEBS Lett. 2002;531:109–114. - PubMed
    1. Dong X, Sweet J, Challis JR, Brown T, Lye SJ. Transcriptional activity of androgen receptor is modulated by two RNA splicing factors, PSF and p54nrb. Mol Cell Biol. 2007;27:4863–4875. - PMC - PubMed
    1. Amelio AL, et al. A coactivator trap identifies NONO (p54nrb) as a component of the cAMP-signaling pathway. Proc Natl Acad Sci USA. 2007;104(2):20314–20319. - PMC - PubMed

Publication types

MeSH terms

Substances