. 2015 Nov 16;10(11):e0143078.
doi: 10.1371/journal.pone.0143078. eCollection 2015.

The Deubiquitinating Enzyme UBPY Is Required for Lysosomal Biogenesis and Productive Autophagy in Drosophila

Affiliations

The Deubiquitinating Enzyme UBPY Is Required for Lysosomal Biogenesis and Productive Autophagy in Drosophila

Anne-Claire Jacomin et al. PLoS One. .

Abstract

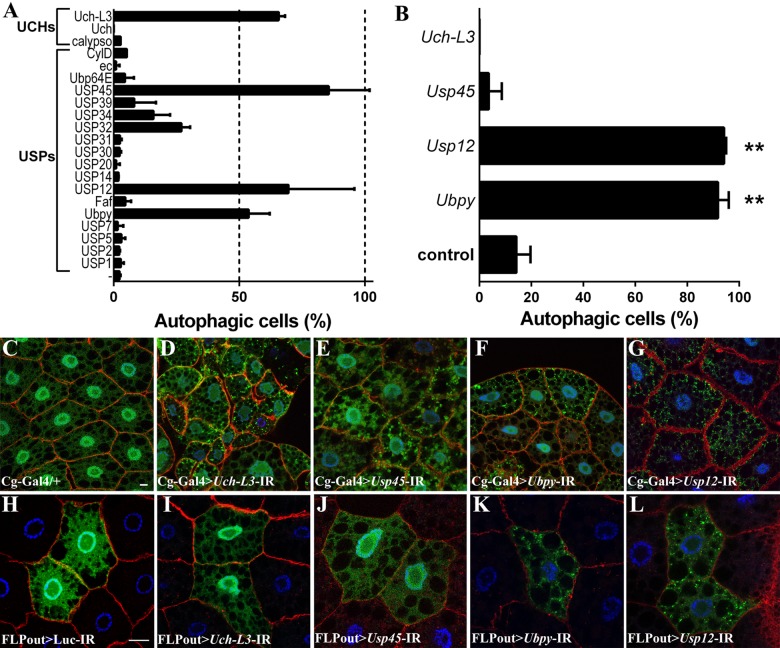
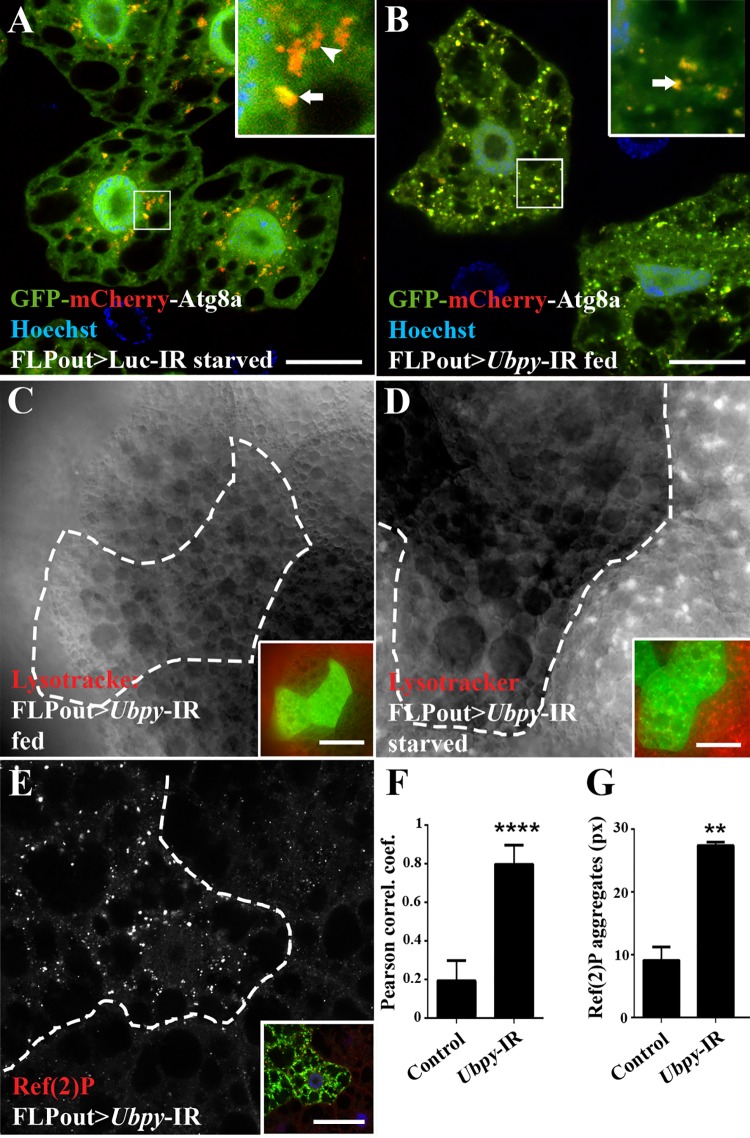
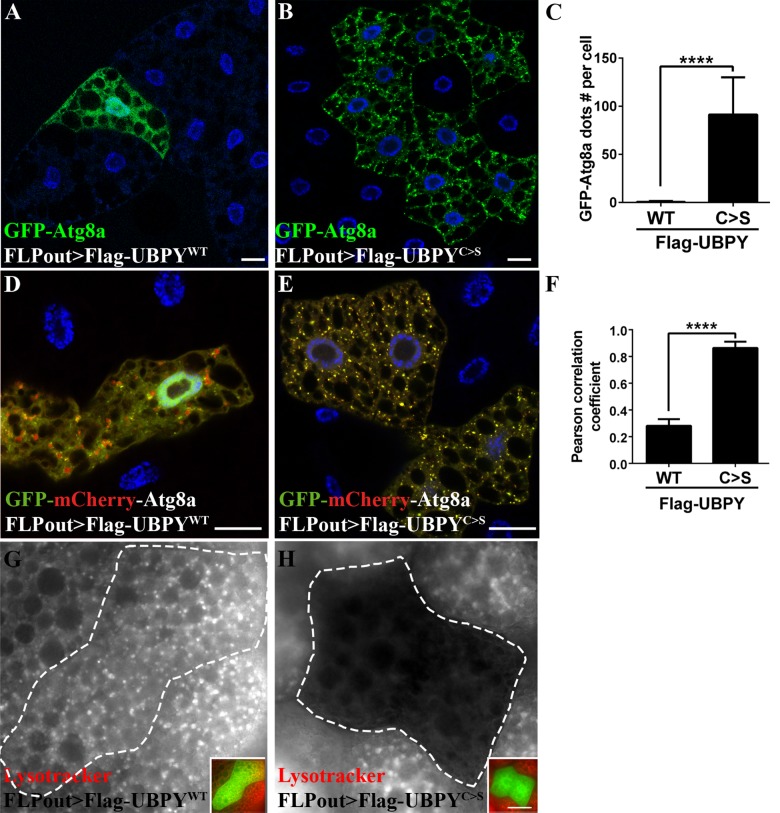
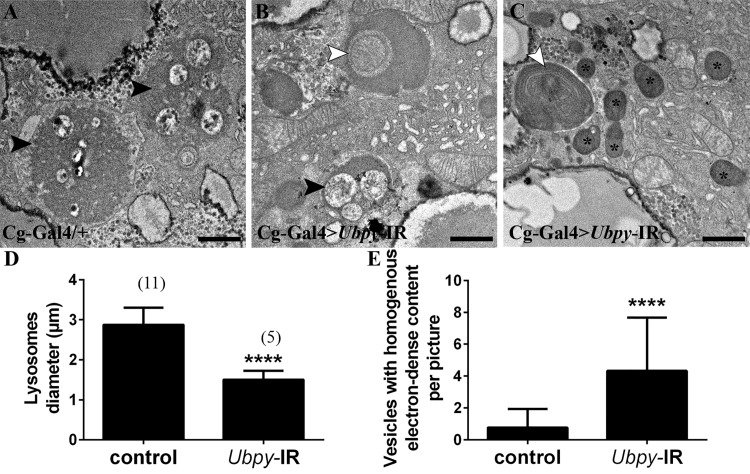
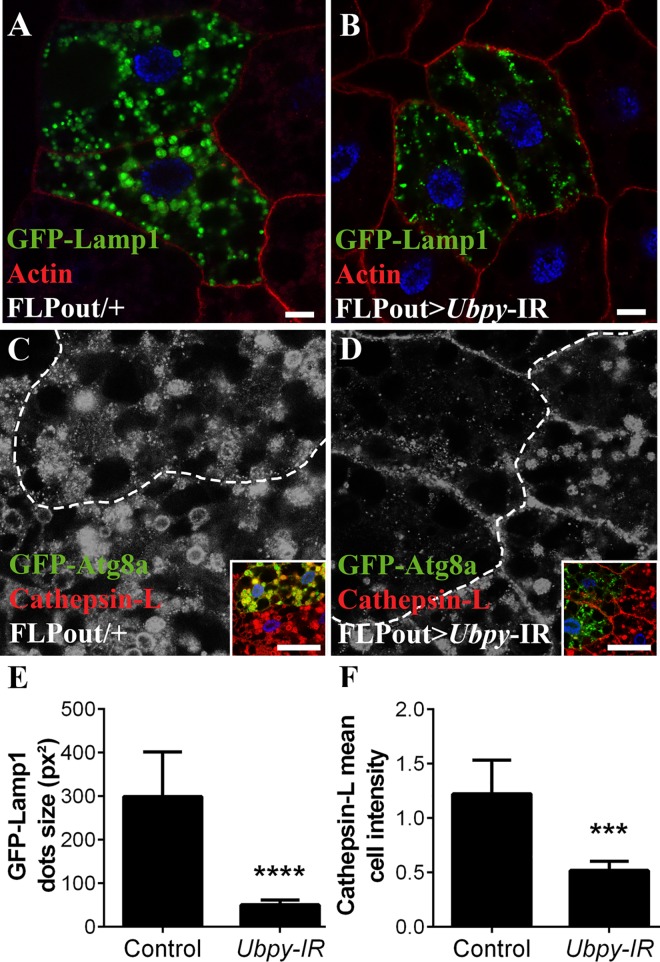
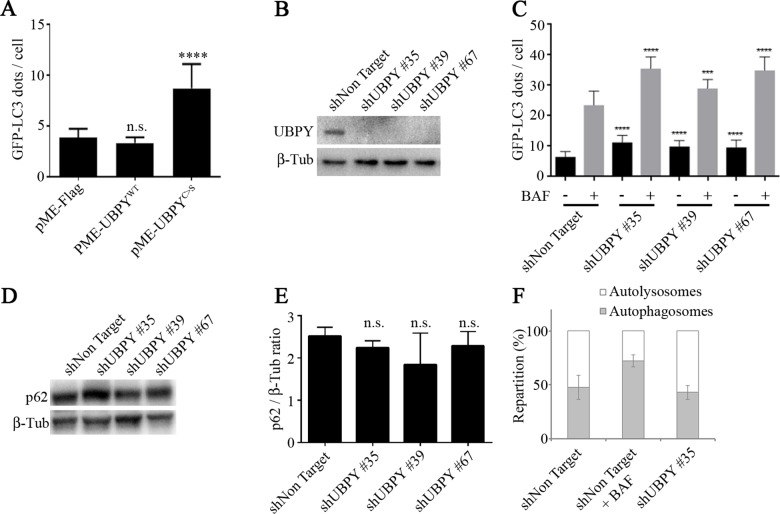
Autophagy is a catabolic process that delivers cytoplasmic components to the lysosomes. Protein modification by ubiquitination is involved in this pathway: it regulates the stability of autophagy regulators such as BECLIN-1 and it also functions as a tag targeting specific substrates to autophagosomes. In order to identify deubiquitinating enzymes (DUBs) involved in autophagy, we have performed a genetic screen in the Drosophila larval fat body. This screen identified Uch-L3, Usp45, Usp12 and Ubpy. In this paper, we show that Ubpy loss of function results in the accumulation of autophagosomes due to a blockade of the autophagy flux. Furthermore, analysis by electron and confocal microscopy of Ubpy-depleted fat body cells revealed altered lysosomal morphology, indicating that Ubpy inactivation affects lysosomal maintenance and/or biogenesis. Lastly, we have shown that shRNA mediated inactivation of UBPY in HeLa cells affects autophagy in a different way: in UBPY-depleted HeLa cells autophagy is deregulated.


Conflict of interest statement

Competing Interests: The authors have declared that no competing interests exist.

Figures

Fig 1
Fig 1. A genetic screen identifies UBPY and USP12 as putative autophagy regulators.
(A) Quantification of autophagy in the Drosophila larval fat body after silencing of the indicated DUB using the Cg-Gal4 driver line. Bars denote the proportion of autophagic cells from at least 6 animals. Cells were considered as “autophagic” if at least one GFP-LC3B vesicle was observed. (B) Quantification of autophagy after silencing by the FLPout method. Bars denote the proportion of autophagic cells from at least 6 animals. Statistical significance was determined using one-way ANOVA: **p<0.005. (C-G) Representative confocal sections after silencing of the indicated DUB in the larval fat body. (H-L) Clonal analysis of the four candidates after silencing by the FLPout method. One representative confocal section per genotype is shown. Actin is labelled with Phalloidin-Texas Red (red) and nuclei are labelled with Hoechst (blue). Scale bar: 10μm. Genotypes: (C) Cg-Gal4/+; UAS-GFP-LC3B/+, (D) Cg-Gal4/ UAS-Uch-L3-IR; UAS-GFP-LC3B/+, (E) Cg-Gal4/ UAS-Usp45-IR; UAS-GFP-LC3B/+, (F) Cg-Gal4/+; UAS-GFP-LC3B/ UAS-Ubpy-IR, (G) Cg-Gal4/+; UAS-GFP-LC3B/ UAS-Usp12-IR, (H) y w hs-FLP/+; UAS-GFP-Atg8a/UAS-Luc-IR; Ac>CD2>Gal4/+, (I) y w hs-FLP/+; UAS-GFP-Atg8a/UAS-Uch-L3-IR; Ac>CD2>Gal4/+, (J) y w hs-FLP/+; UAS-GFP-Atg8a/UAS-Usp45-IR; Ac>CD2>Gal4/+, (K) y w hs-FLP/+; UAS-GFP-Atg8a/+; Ac>CD2>Gal4/ UAS-Ubpy-IR, (L) y w hs-FLP/+; UAS-GFP-Atg8a/+; Ac>CD2>Gal4/ UAS-Usp12-IR.
Fig 2
Fig 2. Ubpy loss-of-function blocks the autophagy flux.
(A,B) Analysis of the autophagy flux using the tandem-tagged GFP-mCherry-Atg8a reporter in control cells from starved larvae (A) or in Ubpy silenced cells (B). Insets show an enlarged view for each condition (arrow: autophagosome, arrowhead: autolysosomes). Quantification of the colocalization of mCherry and GFP signals using the Pearson’s correlation coefficient is shown in F. (C,D) Lysotracker Red staining on fat bodies from fed (C) or starved (D) larvae silenced for Ubpy. Mutant cells were identified by the expression of the GFP-Atg8a marker (dotted lines and green channel in insets). (E) Confocal sections of larval fat bodies stained for the endogenous Ref(2)P protein. Mutant cells were identified by the expression of the GFP-Atg8a marker (dotted lines and green channel in insets). (G) Quantification of the size of the Ref(2)P aggregates. N>6 larvae per experimental condition. For all the quantifications, bars denote mean ± s.d. Statistical significance was determined using one-way ANOVA: *p<0.05, **p<0.005, ****p<0.0001. Scale bars: 20μm (A,B), 50μm (C-E). Genotypes: (A) y w hs-FLP/+; UAS-GFP-mCherry-Atg8a/UAS-Luc-IR; Ac>CD2>Gal4/+, (B) y w hs-FLP/+; UAS-GFP-mCherry-Atg8a/+; Ac>CD2>Gal4/ UAS-Ubpy-IR, (C-E) y w hs-FLP/+; UAS-GFP-Atg8a/+; Ac>CD2>Gal4/ UAS-Ubpy-IR.
Fig 3
Fig 3. Expression of a catalytic inactive UBPY mutant blocks the autophagy flux.
Expression of the wild-type form of UBPY has no effect on autophagy (Flag-UBPYWT, A) whereas the UBPY catalytic mutant form induces accumulation of GFP-Atg8a dots (Flag-UBPYC>S, B). Quantification of the number of GFP-Atg8a dots per cell is show in C. Confocal sections of larval fat bodies expressing the GFP-mCherry-Atg8a in combination with the wild-type (D) or catalytic inactive (E) forms of UBPY. Please note that the expressing the wild-type form of UBPY (D) were starved to induce autophagy and allow the observation of autophagosomes. (F) Quantification of the colocalization of mCherry and GFP signals using the Pearson’s correlation coefficient. Larvae expressing the wild-type (G) or the mutant (H) form of UBPY were starved to induce autophagy and stained with Lysotracker Red. Insets show the merged channels of the respective images and the clone boundaries are indicated as dotted lines. Scale bars: 20μm. N>6 larvae per experimental condition. For quantification, bars denote mean ± s.d. Statistical significance was determined using one-way ANOVA: ****p<0.0001, ns: not significant. Genotypes: (A, G) y w hs-FLP/+; UAS-GFP-Atg8a/+; Ac>CD2>Gal4/UAS-2xFlag-UBPY WT, (B, H) y w hs-FLP/+; UAS-GFP-Atg8a/+; Ac>CD2>Gal4/ UAS-2xFlag-UBPY C>S, (D) y w hs-FLP/+; UAS-GFP-mCherry-Atg8a/+; Ac>CD2>Gal4/UAS-2xFlag-UBPY WT, (E) y w hs-FLP/+; UAS-GFP-mCherry-Atg8a/+,; Ac>CD2>Gal4/ UAS-2xFlag-UBPY C>S.
Fig 4
Fig 4. Ultrastructural analysis of Ubpy silenced cells.
Control fat body cells (A) contain large autolysosomes (black arrowhead). These vesicles are characterized by their heterogeneous content and organelle remnants. In contrast, Ubpy silenced cells (B-C) contain autophagosomes whith non-degraded organelles (white arrowhead) (a mitochondria in B and endoplasmic reticulum in C), small autolysosomes (black arrowhead) and vesicles with homogenous electron-dense content (asterisks). Scale bars: 1μm. (D-E) Quantification of lysosomal diameter (D) and number of vesicles with homogenous electron-dense content (E). Bars denote mean ± s.d. Statistical significance was determined using t-test: ****p<0.0001. Genotypes: (A) Cg-Ggal4/+, (B-C) Cg-Gal4/+; UAS-Ubpy-IR/+.
Fig 5
Fig 5. Ubpy silencing induces lysomal defects.
(A,B) Confocal sections of larval fat bodies clonally expressing the lysosomal markers GFP-Lamp1 alone (A) or in combination with the Ubpy silencing transgene (B). (C,D) Confocal sections of larval fat bodies clonally expressing the autophagy reporter GFP-Atg8a alone (C) or in combination with the Ubpy silencing transgene (D) after staining for the endogenous lysosomal hydrolase Cathepsin-L. Insets show the merged channels of the respective images and the clone boundaries are indicated as dotted lines (E). Quantification of GFP-Lamp1 dots size. (F) Quantification of the mean relative intensity of the Cathepsin-L staining in GFP-Atg8a expressing cells compared to the staining intensity of the adjacent wild-type neighboring cells. N>6 larvae per experimental condition. Bars denote mean ± s.d. Statistical significance was determined using one-way Anova: *p<0.05, **p<0.005, ***p<0.0005, ****p<0.0001. Scale bar: 10μm (A-H), 50μm (J-Q). Genotypes: (A) y w hs-FLP/+; UAS-GFP-Lamp1/+; Ac>CD2>Gal4/+, (B) y w hs-FLP/+; UAS-GFP-Lamp1/+; Ac>CD2>Gal4/UAS-Ubpy-IR, (C) y w hs-FLP/+; UAS-GFP-Atg8a/+; Ac>CD2>Gal4/+ (D) y w hs-FLP/+; UAS-GFP-Atg8a/+; Ac>CD2>Gal4/ UAS-Ubpy-IR.
Fig 6
Fig 6. UBPY silencing in HeLa cells activates autophagy.
(A) The number of GFP-LC3 dots per cell was quantified in HeLa cells stably expressing the autophagy reporter GFP-LC3; cells were transfected with a control plasmid (pME-Flag) or plasmids expressing either the wild-type human UBPY protein (pME-UBPYWT) or its catalytically inactive mutant (pME-UBPYC>S). Bars denote mean ± s.d. Statistical significance was determined using t-test: ****p<0.0001 (B) The expression of UBPY was monitored by Western blot in GFP-LC3 HeLa cells stably transfected with a control shRNA or three different shRNAs targeting UBPY. (C) The number of GFP-LC3 dots per cell was quantified in GFP-LC3 HeLa cells stably transfected with a control shRNA or three different shRNAs targeting UBPY in absence (black bars) or in presence of bafilomycin A1 (BAF, gray bars). Bars denote mean ± s.d. Statistical significance was determined using t-test: ****p<0.0001; ***p<0.005 (D) The expression of the autophagy target protein p62 was monitored by Western blot in GFP-LC3 HeLa cells stably transfected with a control shRNA or three different shRNAs targeting UBPY. (E) Quantification of p62 levels in GFP-LC3 HeLa cells stably transfected with a control shRNA or three different shRNAs targeting UBPY from three independent Western blots. (F) The repartition of autolysosmes and autophagosomes was determined in mRFP-GFP-LC3 HeLa cells stably expressing either the control shRNA or the shUBPY #35 shRNA, in comparison with control transfected cells treated with bafilomycin A1.

Similar articles

Cited by

References

    1. Mulakkal NC, Nagy P, Takats S, Tusco R, Juhász G, Nezis IP. Autophagy in Drosophila: From Historical Studies to Current Knowledge. BioMed Research International. 2014;2014:24. - PMC - PubMed
    1. Yang Z, Klionsky DJ. Mammalian autophagy: core molecular machinery and signaling regulation. Current opinion in cell biology. 2010;22(2):124–31. 10.1016/j.ceb.2009.11.014 - DOI - PMC - PubMed
    1. Liang XH, Jackson S, Seaman M, Brown K, Kempkes B, Hibshoosh H, et al. Induction of autophagy and inhibition of tumorigenesis by beclin 1. Nature. 1999;402(6762):672–6. - PubMed
    1. Klionsky DJ, Codogno P. The mechanism and physiological function of macroautophagy. Journal of innate immunity. 2013;5(5):427–33. 10.1159/000351979 - DOI - PMC - PubMed
    1. Shaid S, Brandts CH, Serve H, Dikic I. Ubiquitination and selective autophagy. Cell Death Differ. 2013;20(1):21–30. 10.1038/cdd.2012.72 - DOI - PMC - PubMed

Publication types

LinkOut - more resources