. 2015 Nov 17;43(5):896-908.
doi: 10.1016/j.immuni.2015.10.011. Epub 2015 Nov 10.

CD4+ T Cell Tolerance to Tissue-Restricted Self Antigens Is Mediated by Antigen-Specific Regulatory T Cells Rather Than Deletion

Affiliations

CD4+ T Cell Tolerance to Tissue-Restricted Self Antigens Is Mediated by Antigen-Specific Regulatory T Cells Rather Than Deletion

Francois P Legoux et al. Immunity. .

Abstract

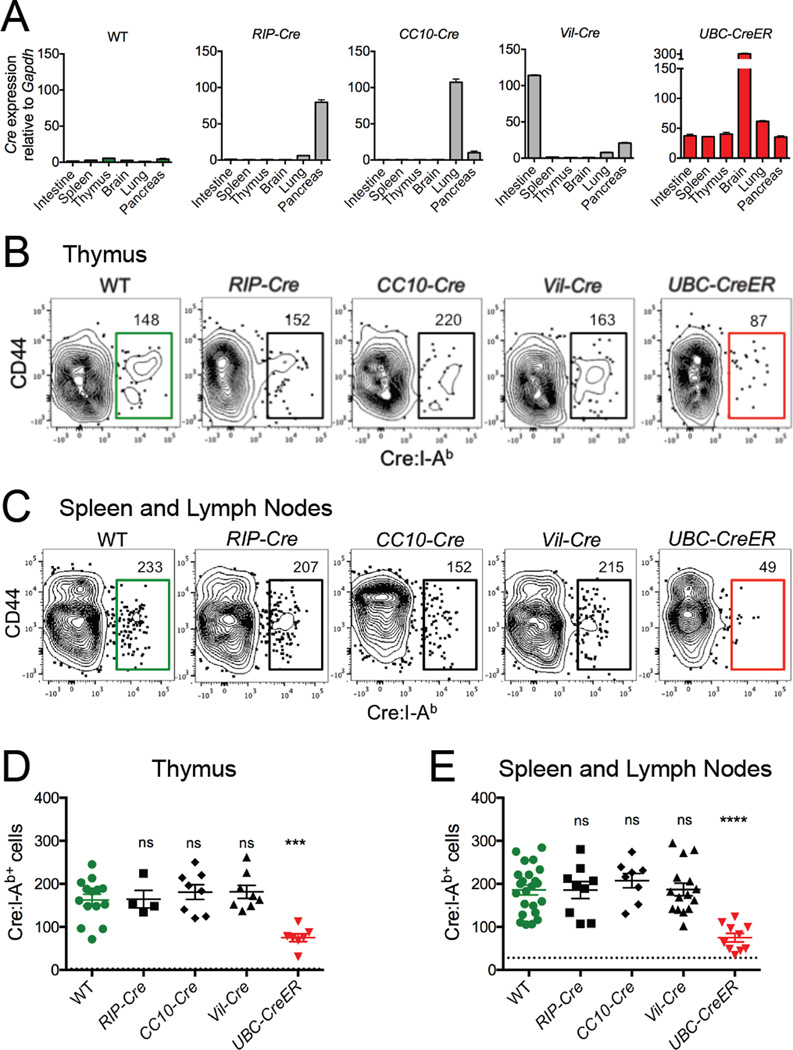
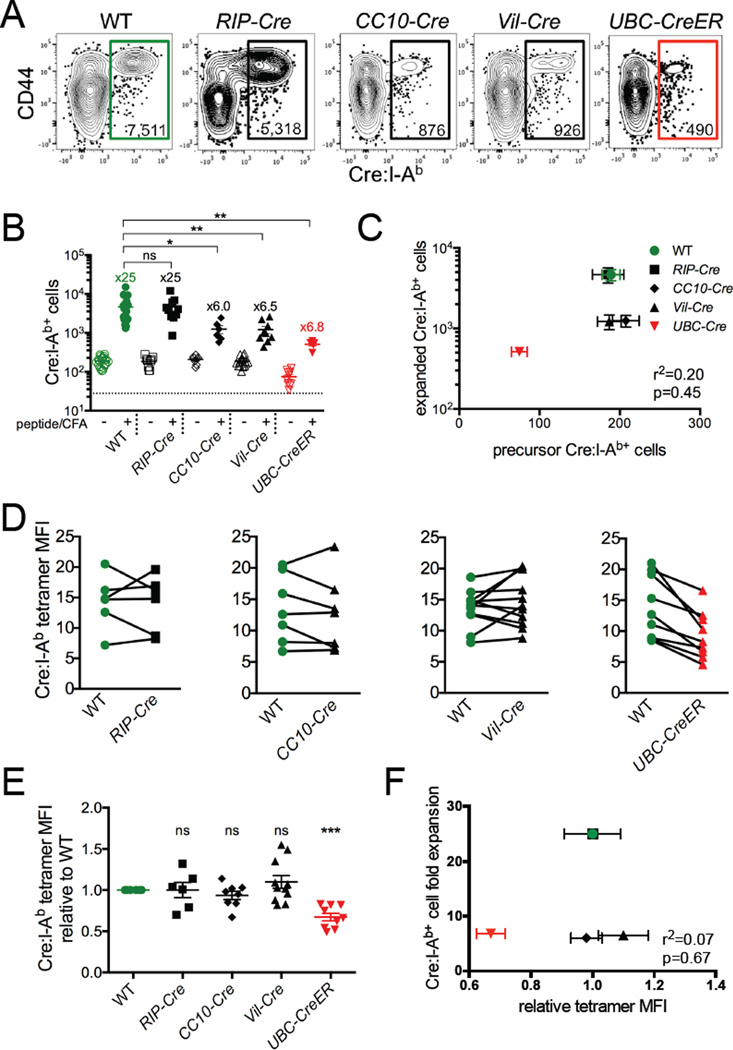
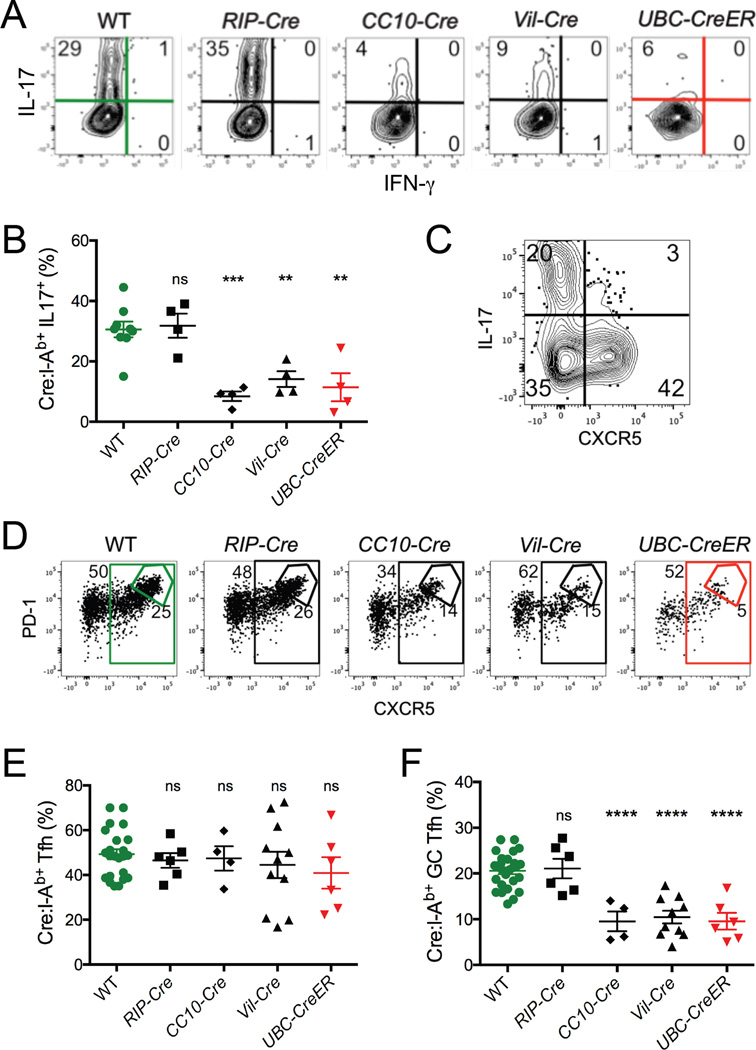
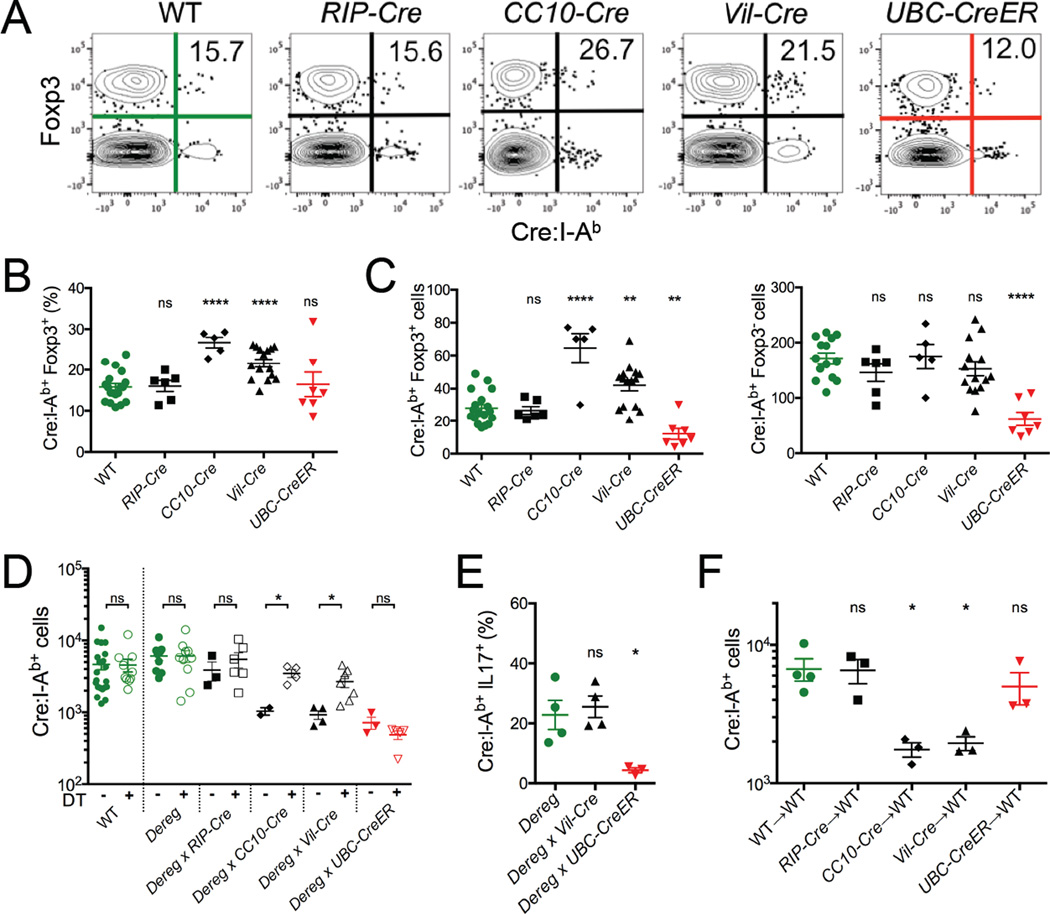
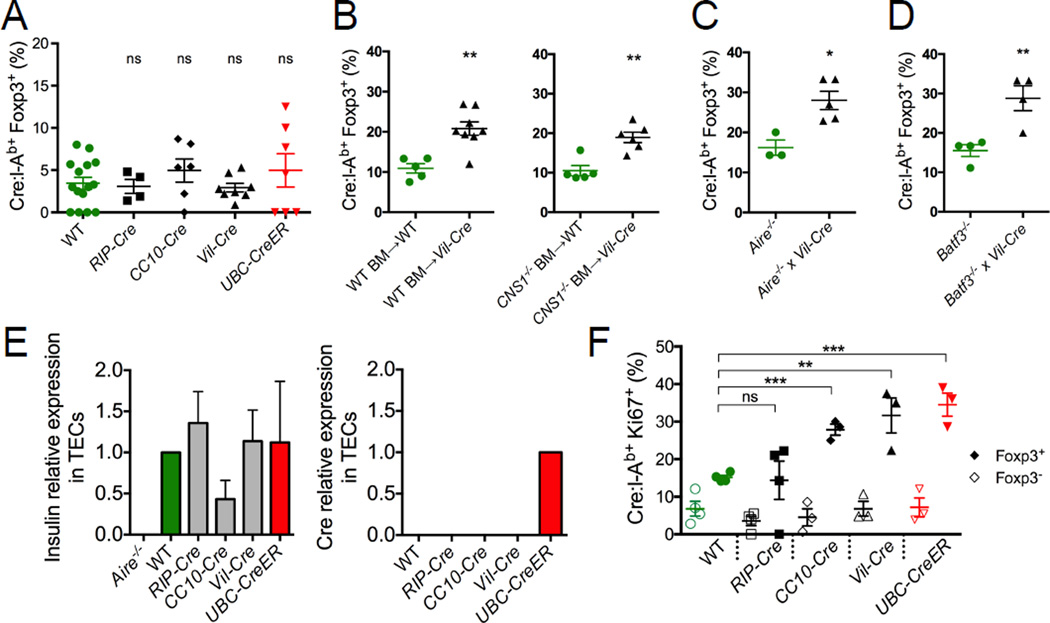
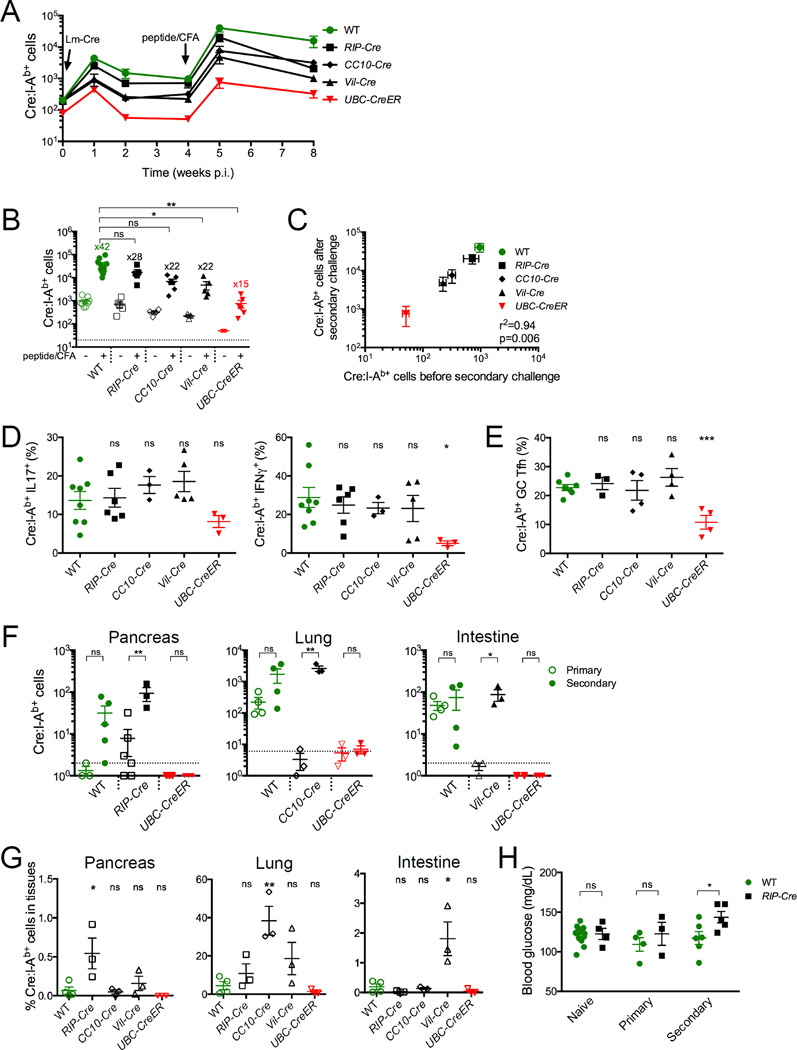
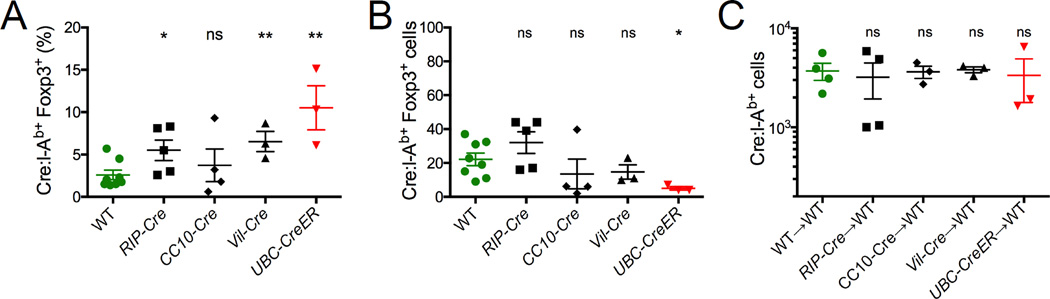
Deletion of self-antigen-specific T cells during thymic development provides protection from autoimmunity. However, it is unclear how efficiently this occurs for tissue-restricted self antigens, or how immune tolerance is maintained for self-antigen-specific T cells that routinely escape deletion. Here we show that endogenous CD4+ T cells with specificity for a set of tissue-restricted self antigens were not deleted at all. For pancreatic self antigen, this resulted in an absence of steady-state tolerance, while for the lung and intestine, tolerance was maintained by the enhanced presence of thymically-derived antigen-specific Foxp3+ regulatory T (Treg) cells. Unlike deletional tolerance, Treg cell-mediated tolerance was broken by successive antigen challenges. These findings reveal that for some tissue-restricted self antigens, tolerance relies entirely on nondeletional mechanisms that are less durable than T cell deletion. This might explain why autoimmunity is often tissue-specific, and it offers a rationale for cancer vaccine strategies targeting tissue-restricted tumor antigens.


Figures

Figure 1
Figure 1. Tissue-restricted self antigen-specific CD4+ T cells are not deleted
(A) Quantitative RT-PCR data depicting Cre mRNA expression levels normalized to GAPDH in indicated tissues of indicated mice. Mean values ±SEM of samples taken from at least two independent experiments are shown. (B) Representative flow cytometry of CD4+ single positive thymocytes following Cre:I-Ab tetramer-based cell enrichment of thymi. (C) Representative flow cytometry of peripheral CD4+ T cells following Cre:I-Ab tetramer-based cell enrichment of pooled spleen and lymph nodes. Plots represent Dump(B220, CD11b, CD11c, F4/80)CD3+CD4+ events as described in Figure S1E. Numbers above gates indicate total numbers of Cre:I-Ab-specific CD4+T cells calculated for the whole mouse. (D–E) Quantitative summaries of Cre:I-Ab-specific CD4+ (D) thymocyte or (E) peripheral T cell numbers per mouse. Each datapoint represents an individual mouse. Mean values ±SEM are shown. Dotted lines represent the limit of detection as defined by the mean frequency of CD8+tetramer+ events. ns not significant, *** p<0.001, **** p<0.0001 for unpaired t tests between WT and each Cre mouse. See also Figure S1.
Figure 2
Figure 2. Lung and intestinal self antigen-specific CD4+ T cells exhibit impaired proliferative responses
Mice were immunized with Cre peptide + CFA and analyzed 7 days later. (A) Representative flow cytometry of CD4+ T cells following Cre:I-Ab tetramer-based cell enrichment of pooled spleen and lymph nodes. Plots represent Dump(B220, CD11b, CD11c, F4/80)CD3+CD4+ events. Numbers inside gates indicate total numbers of Cre:I-Ab-specific CD4+ T cells calculated for the whole mouse. (B) Quantitative summary of total Cre:I-Ab-specific T cell numbers per mouse with fold expansion values indicated. The dotted line represents the limit of detection. (C) Linear regression analysis of Cre:I-Ab-specific T cell numbers before and after immunization for each mouse strain. SEM, r2, and p values are indicated. (D) Tetramer mean fluorescence intensity (MFI), expressed in arbitrary units, of Cre:I-Ab-specific T cells from individual WT and Cre mice. Lines connect mice analyzed within the same experiment. (E) Quantitative summary of tetramer MFI from individual mice normalized to WT controls analyzed within the same experiment. (F) Linear regression analysis of Cre:I-Ab tetramer staining intensity and Cre:I-Ab-specific T cell expansion for each mouse strain. SEM, r2, and p values are indicated. (B,E) Mean values ±SEM are shown. ns not significant, * p<0.05, ** p<0.01, *** p<0.001 for unpaired t tests between WT and each Cre mouse. See also Figure S2.
Figure 3
Figure 3. Lung and intestinal self antigen-specific CD4+ T cells exhibit impaired effector functions
Mice were immunized with Cre peptide + CFA and analyzed 7 days later. (A) Representative intracellular flow cytometry of IL-17 and IFNγ cytokine expression by Cre:I-Ab-specific CD4+ T cells from pooled spleen and lymph nodes following in vitro restimulation with PMA + ionomycin. Numbers indicate proportions of cells in each quadrant. (B) Quantitative summary of the proportion of Cre:I-Ab-specific T cells expressing IL-17 in each mouse. (C) Representative flow cytometry of IL-17 and CXCR5 expression by Cre:I-Ab-specific CD4+ T cells from a WT mouse. (D) Representative flow cytometry of PD-1 and CXCR5 expression by Cre:I-Ab-specific CD4+ T cells. Numbers indicate proportions of cells in each gate. (E–F) Quantitative summaries of proportions of Cre:I-Ab-specific T cells exhibiting (E) CXCR5+ or (F) PD-1hiCXCR5hi GC-Tfh cell phenotypes. (B,E–F) Mean values ±SEM are shown. ns not significant, ** p<0.01, *** p<0.001, **** p<0.0001 for unpaired t tests between WT and each Cre mouse. See also Figure S3.
Figure 4
Figure 4. Tolerance to lung and intestinal self antigen requires antigen-specific Tregs
(A) Representative flow cytometry depicting Foxp3EGFP reporter expression in CD4+ T cells following Cre:I-Ab tetramer-based cell enrichment of pooled spleen and lymph nodes from indicated naïve mice. Numbers indicate proportions of tetramer+ cells expressing Foxp3. (B) Quantitative summary of the proportion of Cre:I-Ab-specific CD4+ T cells expressing Foxp3 in each indicated mouse strain. (C) Quantitative summary of the total numbers of Foxp3+ and Foxp3 Cre:I-Ab-specific T cells in each indicated mouse strain. (D) Total Cre:I-Ab-specific T cell numbers and (E) proportions of IL-17+ Cre:I-Ab-specific T cells in indicated Foxp3-DEREG mice 7 days following peptide + CFA immunization with (closed symbols) or without (open symbols) concurrent Treg ablation by DT treatment. (F) WT host Cre:I-Ab-specific T cell numbers 7 days after adoptive transfer of ~4 × 10⁶ CD4+CD25+ Tregs from indicated donor mice followed by immunization with Cre peptide + CFA. (B–F) Mean values ±SEM are shown. ns not significant, * p<0.05, ** p<0.01, **** p<0.0001 for unpaired t tests between WT and each Cre mouse. See also Figure S4.
Figure 5
Figure 5. Tissue-restricted self antigen-specific Tregs are thymically derived and peripherally expanded
(A) Quantitative summary of the proportion of Cre:I-Ab-specific CD4+ SP thymocytes expressing Foxp3 in each indicated mouse strain. (B) Proportions of Cre:I-Ab-specific CD4+ T cells expressing Foxp3 in pooled spleen and lymph nodes from lethally irradiated WT or Foxp3ΔCNS1 mice reconstituted with WT or Foxp3ΔCNS1 bone marrow. (C) Proportions of Cre:I-Ab-specific T cells expressing Foxp3 in pooled spleen and lymph nodes from Aire−/− mice. (D) Proportions of Cre:I-Ab-specific T cells expressing Foxp3 in pooled spleen and lymph nodes from Batf3−/− mice. (E) Quantitative RT-PCR analysis of Insulin and Cre mRNA expression relative to β2M in flow sorted thymic epithelial cells (TECs). Mean values ±SEM of samples taken from at least two independent experiments are shown. (F) Proportions of Foxp3 (open symbols) or Foxp3+ (filled symbols) Cre:I-Ab-specific T cells expressing Ki67 in indicated mice. (A–D, F) Mean values ±SEM are shown. ns not significant, * p<0.05, ** p<0.01, *** p<0.001 for unpaired t tests between WT and each Cre mouse. See also Figure S5.
Figure 6
Figure 6. Treg mediated tolerance to tissue-restricted self antigens is lost upon secondary immune challenge
(A) Mice were infected with Lm-Cre, and 4 weeks later rechallenged with Cre peptide + CFA. (B) Quantitative summary of total Cre:I-Ab-specific T cell numbers in pooled spleen and lymph nodes before and after secondary challenge with fold expansion values indicated. The dotted line represents the limit of detection. (C) Linear regression analysis of Cre:I-Ab-specific T cell numbers before and after secondary immune challenge. SEM, r2, and p values are indicated. (D–E) Proportions of Cre:I-Ab-specific T cells (D) expressing IL-17 or IFNγ cytokines, or (E) exhibiting a GC-Tfh phenotype 7 days after secondary immune challenge. (F) Cre:I-Ab-specific T cell numbers in the pancreas, lungs, and intestines of indicated mice 7–9 days after primary or secondary immunization. Dotted lines represent the limit of detection. (G) Cre:I-Ab-specific T cell numbers in indicated tissues after secondary immunization, expressed as a percentage of total Cre:I-Ab-specific T cells from the whole mouse. (H) Blood glucose levels in naive WT or RIP-Cre mice 7–10 days after primary or secondary immunization. (B, D–H) Mean values ±SEM are shown. ns not significant, * p<0.05, ** p<0.01, *** p<0.001 for unpaired t tests between WT and each Cre mouse or between indicated conditions. See also Figure S6.
Figure 7
Figure 7. The balance between Treg and Tconv is altered after immune challenge
Mice were infected with Lm-Cre and Cre:I-Ab-specific Tregs from the pooled spleen and lymph nodes were analyzed 4 weeks later. (A) Proportions of Cre:I-Ab-specific T cells expressing Foxp3. (B) Cre:I-Ab-specific T cell numbers in indicated mice. (C) WT host Cre:I-Ab-specific T cell numbers 7 days after adoptive transfer of ~4 × 10⁶ CD4+CD25+ Tregs from indicated donor mice followed by immunization with Cre peptide + CFA. (A–C) Mean values ±SEM are shown. ns not significant, * p<0.05, ** p<0.01 for unpaired t tests between WT and each Cre mouse.

Comment in

  • Not-So-Negative Selection.
    Davis MM. Davis MM. Immunity. 2015 Nov 17;43(5):833-5. doi: 10.1016/j.immuni.2015.11.002. Immunity. 2015. PMID: 26588773

References

    1. Abbas AK, Benoist C, Bluestone JA, Campbell DJ, Ghosh S, Hori S, Jiang S, Kuchroo VK, Mathis D, Roncarolo MG, et al. Regulatory T cells: recommendations to simplify the nomenclature. Nat Immunol. 2013;14:307–308. - PubMed
    1. Anderson MS, Venanzi ES, Klein L, Chen Z, Berzins SP, Turley SJ, Boehmer, von H, Bronson R, Dierich A, Benoist C, et al. Projection of an immunological self shadow within the thymus by the aire protein. Science. 2002;298:1395–1401. - PubMed
    1. Aschenbrenner K, D'Cruz LM, Vollmann EH, Hinterberger M, Emmerich J, Swee LK, Rolink A, Klein L. Selection of Foxp3+ regulatory T cells specific for self antigen expressed and presented by Aire+ medullary thymic epithelial cells. Nat Immunol. 2007;8:351–358. - PubMed
    1. Bautista JL, Lio C-WJ, Lathrop SK, Forbush K, Liang Y, Luo J, Rudensky AY, Hsieh C-S. Intraclonal competition limits the fate determination of regulatory T cells in the thymus. Nat Immunol. 2009;10:610–617. - PMC - PubMed
    1. Choi S, Schwartz RH. Molecular mechanisms for adaptive tolerance and other T cell anergy models. Semin Immunol. 2007;19:140–152. - PMC - PubMed

Publication types

MeSH terms