Comparative Study
. 2015 Dec;58(6):638-48.
doi: 10.1016/j.ceca.2015.10.003. Epub 2015 Oct 29.

A comparison of fluorescent Ca²⁺ indicators for imaging local Ca²⁺ signals in cultured cells

Affiliations
Comparative Study

A comparison of fluorescent Ca²⁺ indicators for imaging local Ca²⁺ signals in cultured cells

Jeffrey T Lock et al. Cell Calcium. 2015 Dec.

Abstract

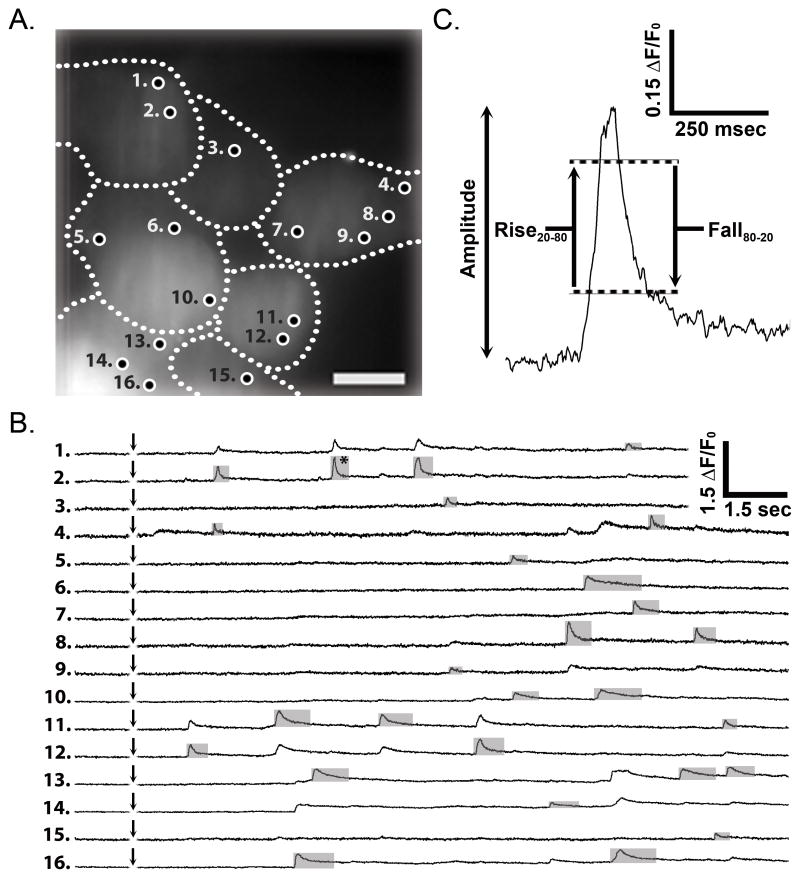
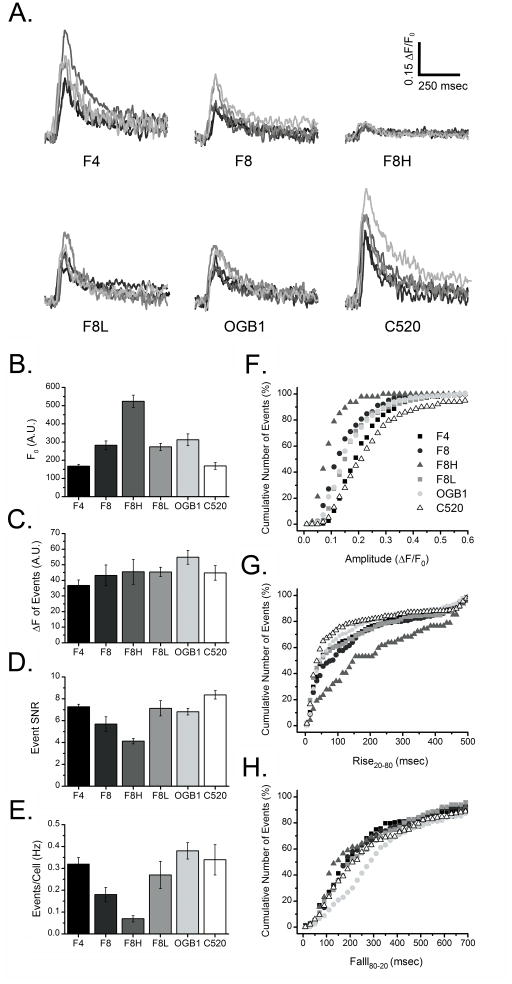
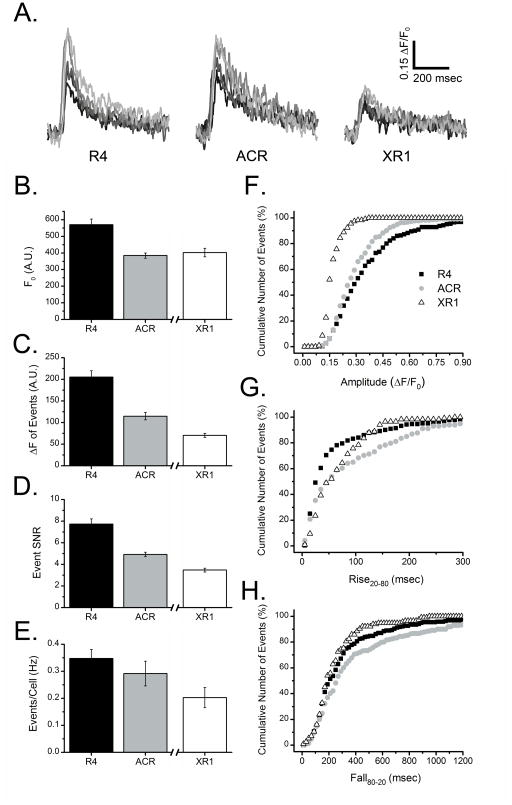
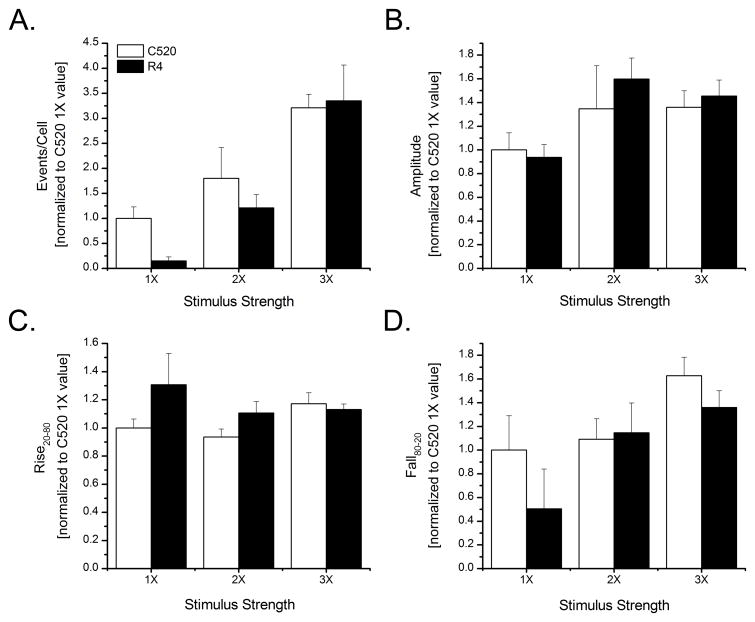
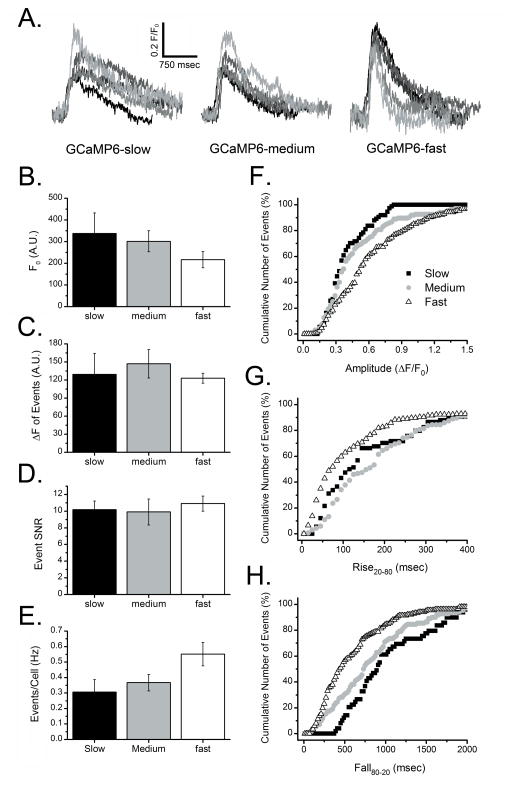
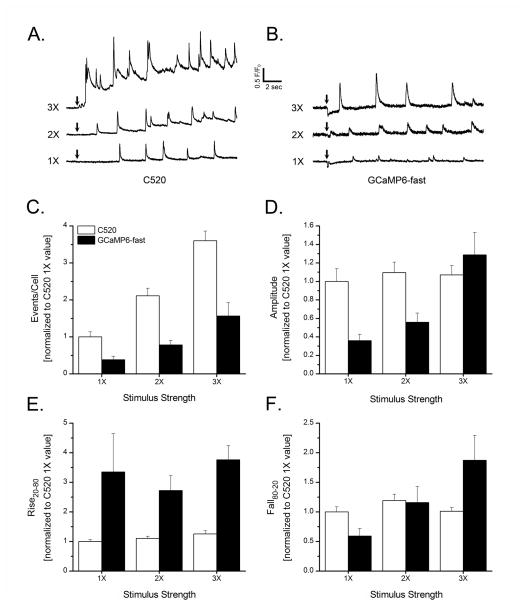
Localized subcellular changes in Ca(2+) serve as important cellular signaling elements, regulating processes as diverse as neuronal excitability and gene expression. Studies of cellular Ca(2+) signaling have been greatly facilitated by the availability of fluorescent Ca(2+) indicators. The respective merits of different indicators to monitor bulk changes in cellular Ca(2+) levels have been widely evaluated, but a comprehensive comparison for their use in detecting and analyzing local, subcellular Ca(2+) signals is lacking. Here, we evaluated several fluorescent Ca(2+) indicators in the context of local Ca(2+) signals (puffs) evoked by inositol 1,4,5-trisphosphate (IP3) in cultured human neuroblastoma SH-SY5Y cells, using high-speed video-microscopy. Altogether, nine synthetic Ca(2+) dyes (Fluo-4, Fluo-8, Fluo-8 high affinity, Fluo-8 low affinity, Oregon Green BAPTA-1, Cal-520, Rhod-4, Asante Calcium Red, and X-Rhod-1) and three genetically-encoded Ca(2+)-indicators (GCaMP6-slow, -medium and -fast variants) were tested; criteria include the magnitude, kinetics, signal-to-noise ratio and detection efficiency of local Ca(2+) puffs. Among these, we conclude that Cal-520 is the optimal indicator for detecting and faithfully tracking local events; that Rhod-4 is the red-emitting indicator of choice; and that none of the GCaMP6 variants are well suited for imaging subcellular Ca(2+) signals.

Keywords: Calcium; Fluorescent indicators; GCaMP6; Genetically encoded calcium indicators; Local calcium signals.


Conflict of interest statement

Disclosures

All authors declare that they have no competing financial interests.

Figures

Fig. 1
Fig. 1
Experimental protocol for imaging local Ca2+ puffs evoked in SH-SY5Y cells by photorelease of iIP3. (A) Resting fluorescence of several cells (outlined) which were loaded with Cal-520 and caged iIP3. Circles mark sites at which puffs were observed following photorelease of iIP3. Scale bar = 10 μm. (B) Traces depict simultaneous measurement of Cal-520 fluorescence over time (ΔF/F0) from the numbered sites in panel (A). A flash of UV light (75 ms duration) was delivered uniformly throughout the imaging field when marked by the arrows. Traces are scaled as the change in fluorescence (ΔF) divided by the resting fluorescence (F0) at that site before stimulation, and were derived using an automated algorithm to identify the site of origin of each event (marked by grey boxes). (C) A single Ca2+ puff (identified by an asterisk in B) shown on expanded scales to illustrate measurements of amplitude and rise and fall times.
Fig. 2
Fig. 2
Analysis of local Ca2+ puffs imaged by by green-emitting fluorescent Ca2+ indicator dyes. (A) Representative traces showing Ca2+ puffs recorded using different indicators; Fluo-4 (F4), Fluo-8 (F8), Fluo-8 high affinity (F8H), Fluo-8 low affinity (F8L), Oregon Green BAPTA-1 (OGB1), and Cal-520 (C520). Fluorescence signals are scaled as ΔF/F0, and superimposed traces are aligned to their peak time and depicted in different shades of grey for clarity. All events were evoked by photorelease of iIP3 under identical stimulus and recording conditions. Bar graphs (B–C) show measurements for each indicator of ; (B) background resting cell fluorescence (F0) in arbitrary camera units (A.U), (C) peak amplitudes of puffs (ΔF), (D) signal-to-noise ratio (SNR) of puffs, and (E) the number of puffs detected per cell per second. Mean values were calculated for all cells and puffs within a given imaging field (trial), and bars show mean ± 1 SEM from 6 trials for each indicator (F–G) Cumulative probability plots showing, for each indicator (depicted by different symbols), the percentage of all detected events as functions of ; (F) puff amplitude (ΔF/F0), (G) puff rise time (rise20-80 ), and (H) fall time (fall80-20). Total numbers of events analyzed for each parameter were at least 145 (Fluo-4), 100 (Fluo-8), 39 (Fluo-8H), 115-(Fluo-8L), 239 (OGB1), and 150 (Cal-520) ; in some instances signals were too small to obtain reliable measurements of fall time.
Fig. 3
Fig. 3
Analysis of local Ca2+ puffs imaged by red-emitting fluorescent Ca2+ indicator dyes; Rhod-4 (R4), Asante Calcium Red (ACR) and X-Rhod-1 (XR1). Each indicator was individually evaluated under identical conditions in SH-SY5Y cells, with the exception that Rhod-4 and ACR were excited with a 532 nm laser whereas X-Rhod-1 was excited with a 561 nm laser. For this reason, measurements of resting fluorescence of X-Rhod-1 (F0, panel B) cannot be directly compared with the other two indicators. Otherwise, results are presented in the same way as Fig. 2. Data in (B–E) are expressed as the mean SEM from 8 trials for each indicator. Total numbers of events in cumulative probability graphs (F–H) are at least 215 (Rhod-4), 211 (Asante Calcium Red), and 113 (X-Rhod-1).
Fig. 4
Fig. 4
Head-to-head comparison of Cal-520 versus Rhod-4 for detecting and measuring Ca2+ puffs evoked by varying amounts of photoreleased iIP3. UV photolysis flashes were of constant intensity and durations of 25 ms (1X), 50 ms (2X) and 75 ms (3X). Bar graphs show mean numbers of events evoked per cell per second (A), mean puff amplitudes (B), mean puff rise time (C) and mean puff fall time (D) of local Ca2+ signals detected by Cal-520 (open bars) and Rhod-4 (filled bars) in response to the different stimuli. All data are shown normalized relative to the mean values obtained using Cal-520 with the 1X flash duration. A range of 98–99 (1X), 172–178 (2X), and 271–287 (3X) local events for C520 and 7–8 (1X), 115–117 (2X), and 415–428 (3X) for R4 were analyzed from 3–6 experiments for each stimulus strength. Values were normalized to the mean Cal520 1X value for each parameter and are presented as mean ± 1 SEM.
Fig. 5
Fig. 5
Recording local Ca2+ signals with genetically-encoded GCaMP6 indicators. Slow, medium and fast variants of GCaMP6 were individually expressed in SH-SY5Y cells, which were then loaded with ci-IP3/PM and evaluated under identical conditions as described for the organic Ca2+ dyes. Results in (A–H) are presented in the same way as for Fig. 2. Data in (B–E) are expressed as the mean ± SEM from 6 trials for each GCaMP. Total numbers of events in cumulative probability graphs (F–H) are >52 (GCaMP6 slow), >110 (medium), and >150 (fast).
Fig. 6
Fig. 6
Head-to-head comparison of Cal-520 versus GCaMP6-fast for detecting and measuring Ca2+ puffs evoked by varying amounts of photoreleased iIP3. (A,B) Representative traces showing local Ca2+ signals evoked by UV photolysis flashes of constant intensity and varying durations of 25 ms (1X), 50 ms (2X) and 75 ms (3X) recorded, respectively, using Cal520 and GCaMP6-fast. Transient downward deflections in the GCaMP traces likely reflect photobleaching by the UV flashes. (C–F) Bar graphs show mean numbers of events evoked per cell per second (C), mean puff amplitudes (D), mean puff rise time (E) and mean puff fall time (F) of local Ca2+ signals detected by Cal-520 (open bars) and GCaMP6-fast (filled bars) in response to the different stimuli. All data are shown normalized relative to the mean values obtained using Cal-520 with the 1X flash duration. Measurements with Cal-520 were made from at least 175 (1X flash), 327 (2X), and 258 (3X) local events; and for GCaMP6-fast from at least 23 (1X), 62 (2X), and 105 (3X) events.

References

    1. Berridge MJ, Lipp P, Bootman MD. The versatility and universality of calcium signalling. Nat Rev Mol Cell Biol. 2000;1:11–21. - PubMed
    1. Hill-Eubanks DC, Werner ME, Heppner TJ, Nelson MT. Calcium signaling in smooth muscle. Cold Spring Harbor perspectives in biology. 2011;3:a004549. - PMC - PubMed
    1. Hagenston AM, Bading H. Calcium signaling in synapse-to-nucleus communication. Cold Spring Harbor perspectives in biology. 2011;3:a004564. - PMC - PubMed
    1. Demuro A, Parker I. Imaging the activity and localization of single voltage-gated Ca(2+) channels by total internal reflection fluorescence microscopy. Biophys J. 2004;86:3250–3259. - PMC - PubMed
    1. Smith IF, Parker I. Imaging the quantal substructure of single inositol trisphosphate receptor channel activity during calcium puffs in intact mammalian cells. Proc Natl Acad Sci U S A. 2009;106:6404–6409. - PMC - PubMed

Publication types

MeSH terms