. 2016 Jan;94(1):76-81.
doi: 10.4269/ajtmh.15-0397. Epub 2015 Nov 16.

Cholera Outbreak in Grande Comore: 1998-1999

Cholera Outbreak in Grande Comore: 1998-1999

Christopher Troeger et al. Am J Trop Med Hyg. 2016 Jan.

Abstract

In 1998, a cholera epidemic in east Africa reached the Comoros Islands, an archipelago in the Mozambique Channel that had not reported a cholera case for more than 20 years. In just a little over 1 year (between January 1998 and March 1999), Grande Comore, the largest island in the Union of the Comoros, reported 7,851 cases of cholera, about 3% of the population. Using case reports and field observations during the medical response, we describe the epidemiology of the 1998-1999 cholera epidemic in Grande Comore. Outbreaks of infectious diseases on islands provide a unique opportunity to study transmission dynamics in a nearly closed population, and they may serve as stepping-stones for human pathogens to cross unpopulated expanses of ocean.


Figures

Figure 1.
Figure 1.
Maps of Grande Comore. (A) Localities of Grande Comore are marked with circles color coded by district, with each circle's area proportional to the population. Major roads are drawn in gray, with thicker lines for primary and secondary highways and thinner lines for smaller roads. Degrees latitude and longitude are indicated on the axes. (B) Map of final reported cholera incidence. The color of the circles is based on the final reported suspected cholera incidence of each locality, from blue for low incidence to red for high (up to 25%). Black Xs indicate localities that did not report any cholera cases.
Figure 2.
Figure 2.
Cholera epidemic curves by district. (A) Reported suspected cholera cases. Each bar represents one reporting interval, with the right of the bar on the actual reporting date and the left of the bar at the date of the previous report, or January 1, 1998 in the case of the first report. The height of the bars is the number of cases in each report divided by the days since the last report and estimate of the average number of cases reported per day. Therefore, the area of each rectangle is proportional to the number of cases in a district in each report. Note that the reports are not evenly spaced in time. (B) Cumulative reported suspected cases by district from January or February 1998 to April 1999. The x axis is exact report date (not converted to weekly intervals). (C) The cumulative number of localities in each district (color coded) that have reported cholera cases.
Figure 3.
Figure 3.
The most likely spatiotemporal clusters of cholera cases. SaTScan software was used to identify spatiotemporal clusters of reported suspected cases. The maximum allowable cluster size was 25% of the total population of Grande Comore. The date and relative likeliness of the clusters are indicated. (A) Assuming circular clusters, the relative risks in each of the four clusters were 128.72, 85.41, 148.09, and 33.51. (B) Assuming elliptical clusters, the relative risks in the three clusters were 131.62, 33.75, and 84.21. (C) Clusters were identified as localities within a given driving distance from the center of the cluster. The relative risks in the four clusters were 95.99, 107.66, 115.04, and 32.75.
Figure 4.
Figure 4.
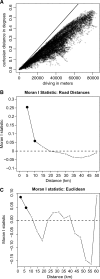
Driving distance and Euclidean distance among localities in Grande Comore. (A) Driving vs. Euclidean distance between all pairs of localities. The diagonal line assumes that 1° equals 109 km (an approximation for 11.6° S latitude). A comparison of global Moran's I scores for spatial autocorrelation of final attack rates when neighbors were defined using (B) driving distances and (C) Euclidean distances. Filled circles represent Moran's I scores that are statistically significant at P < 0.05. The distance classes for the Euclidean distance in (C) assume that 1° equals 109 km.
Figure 5.
Figure 5.
Force of invasion. The force of invasion for localities that had not reported cholera cases was associated with an increased probability of the arrival of cholera. The force of invasion is based on the number of cases reported between 1 and 2 weeks ago and the driving distance to those cases. The receiver operating curves (ROCs) and areas under the curves (AUCs) for using the force of invasion to predict the first report of cholera cases of a new locality for (A) the entire cholera epidemic, (B) only reports before July 31, 1998, and (C) only reports from August to September 1998. These curves are for the free parameters (i.e., ρ, τ1, and τ2) associated with the highest AUCs. Panels DF show the AUCs for different combinations of τ1 and τ2 are shown for the same periods and values of ρ as panels AC. AUCs are printed on the plots in dark circles when the AUCs are high, in lighter circles for low AUCs.

References

    1. Mengel MA, Delrieu I, Heyerdahl L, Gessner BD. Cholera outbreaks in Africa. Curr Top Microbiol Immunol. 2014;379:117–144. - PubMed
    1. World Health Organization Global Task Force on Cholera Control Cholera Country Profile: Comoros. 2008. http://www.who.int/cholera/countries/ComorosCountryProfile2008.pdf Available at. Accessed May 19, 2015.
    1. Piarroux R, Bompangue D. Needs for an integrative approach of epidemics: The example of cholera. In: Tibayrenc M, editor. Encyclopedia of Infectious Diseases. Hoboken, NJ: John Wiley and Sons; 2007. pp. 639–654.
    1. Ministère de la Santé Publique et de la Population, Direction de la Population . République fédérale islamique des Comores, Projet FNUAP/BIT/COI/95/PO2/UPP. Geneva: Organisation Internationale du Travail; 1997.
    1. Anselin L. Local indicators of spatial association—LISA. Geogr Anal. 1995;27:93–115.

Publication types