. 2015 Nov 17:5:16350.
doi: 10.1038/srep16350.

Sample storage conditions significantly influence faecal microbiome profiles

Affiliations

Sample storage conditions significantly influence faecal microbiome profiles

Jocelyn M Choo et al. Sci Rep. .

Abstract

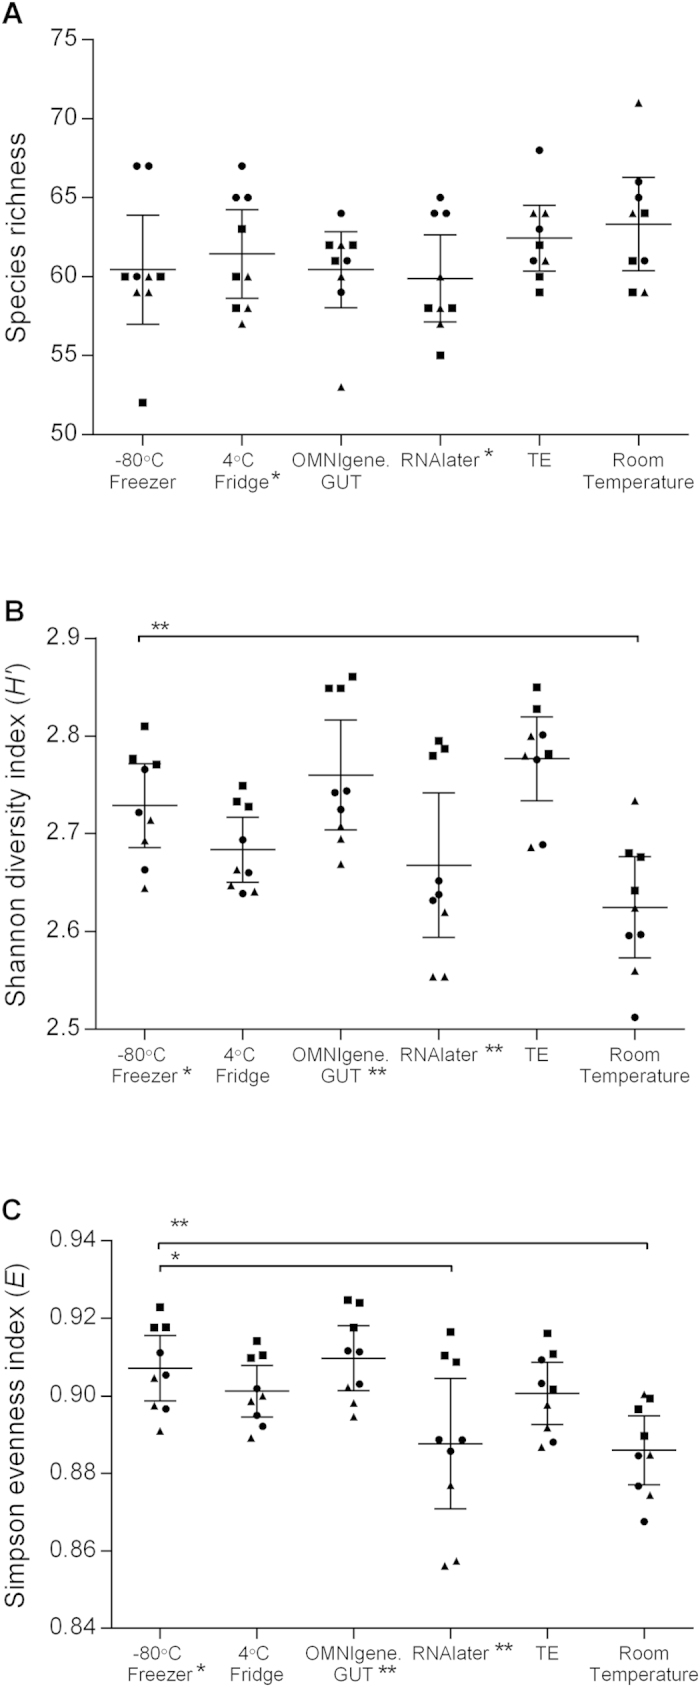
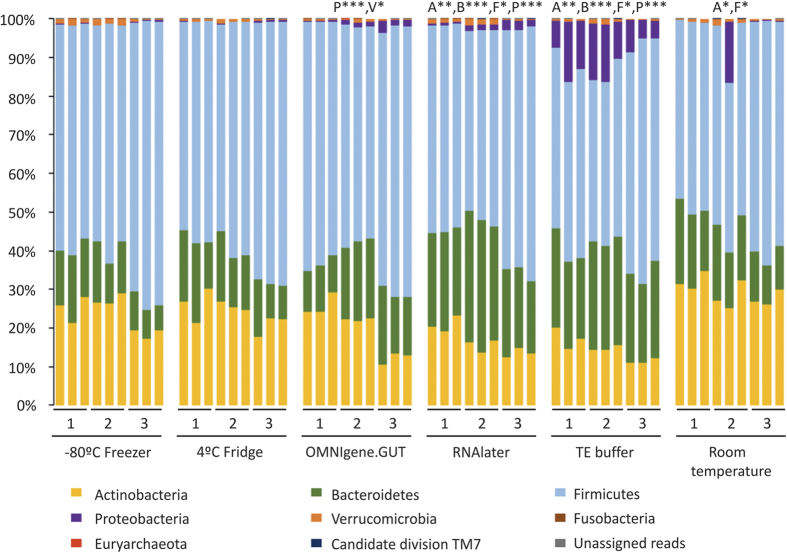
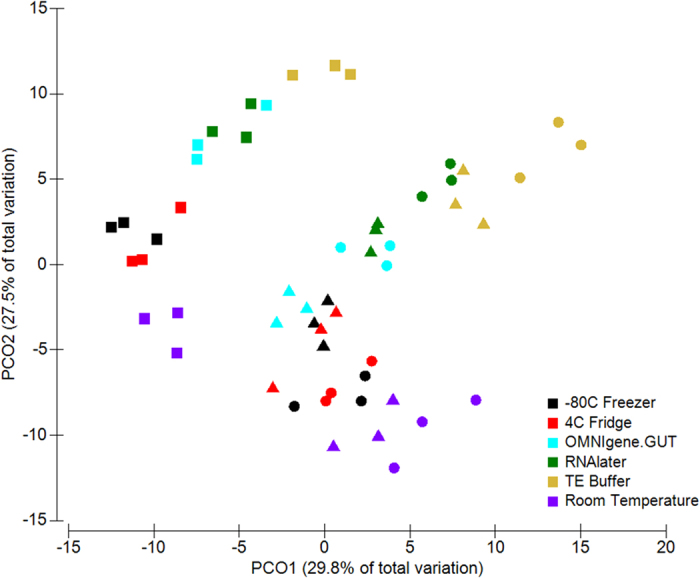
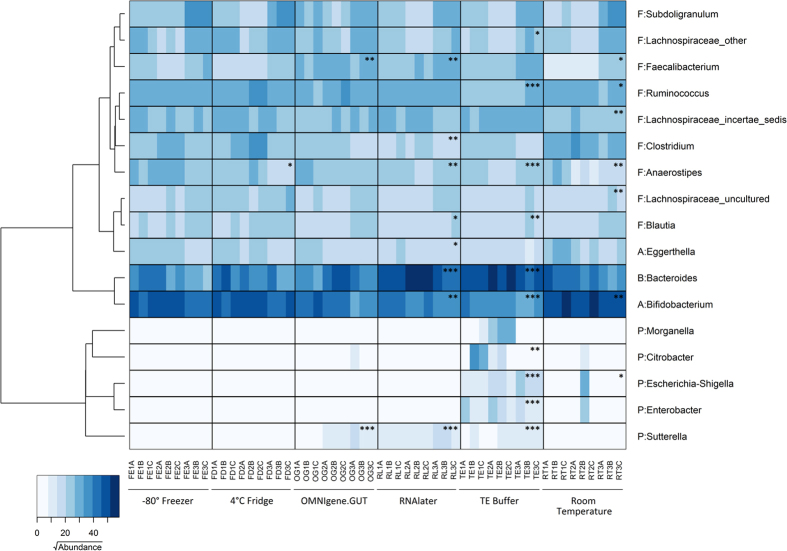
Sequencing-based studies of the human faecal microbiota are increasingly common. Appropriate storage of sample material is essential to avoid the introduction of post-collection bias in microbial community composition. Rapid freezing to -80 °C is commonly considered to be best-practice. However, this is not feasible in many studies, particularly those involving sample collection in participants' homes. We determined the extent to which a range of stabilisation and storage strategies maintained the composition of faecal microbial community structure relative to freezing to -80 °C. Refrigeration at 4 °C, storage at ambient temperature, and the use of several common preservative buffers (RNAlater, OMNIgene.GUT, Tris-EDTA) were assessed relative to freezing. Following 72 hours of storage, faecal microbial composition was assessed by 16 S rRNA amplicon sequencing. Refrigeration was associated with no significant alteration in faecal microbiota diversity or composition. However, samples stored using other conditions showed substantial divergence compared to -80 °C control samples. Aside from refrigeration, the use of OMNIgene.GUT resulted in the least alteration, while the greatest change was seen in samples stored in Tris-EDTA buffer. The commercially available OMNIgene.GUT kit may provide an important alternative where refrigeration and cold chain transportation is not available.


Figures

Figure 1
Figure 1. Species diversity following incubation under six different storage conditions
. The extent of microbiota structural and composition diversities were measured using (A) Taxa S (species richness), (B) Shannon-Weiner diversity index, (C) Simpson’s evenness index. Each point represents the diversity score for a replicate from collection 1 (●), collection 2 (▲) or collection 3 (■). Error bars represent SEM. Within-group and between-group variations were measured using Kruskal-Wallis one-way ANOVA and Mann-Whitney U-test, respectively. Significant variance is indicated by asterisks; single asterisk (*) indicates p ≤ 0.05, double asterisk (**) represents p ≤ 0.01.
Figure 2
Figure 2. Relative abundance at phylum level for each sample incubated under six different storage conditions.
Storage conditions that differed significantly from the control (−80 °C) are indicated with respective phylum abbreviation and asterisks. The respective phyla were abbreviated as follow: Actinobacteria (A), Bacteroidetes (B), Firmicutes (F), Proteobacteria (P) and Verrucomicrobia (V). Statistical significance was assessed by Mann-Whitney U-test and indicated by asterisks; single asterisk (*) represents p ≤ 0.05, double asterisk (**) represents p ≤ 0.01, and triple asterisk (***) represents p ≤ 0.001.
Figure 3
Figure 3. Clustering of samples due to storage conditions by PCoA, based on Bray-Curtis similarity distance.
The first two principal coordinates are plotted on the x- and y-axes, respectively (representing 57.3% of the total variation). Faecal collections sampled at three different time points are represented by circle (●) for collection 1, triangle (▲) for collection 2, and square (■) for collection 3. Storage conditions are indicated by colour.
Figure 4
Figure 4. The distribution of the major genera in samples incubated under six different storage conditions.
The heatmap shows square root-transformed read counts for the 17 taxa identified as contributing most to variance (86% across all samples) as determined by SIMPER analysis. The dendrogram shows the similarity relationship of genera based on Bray-Curtis distance and Ward’s hierarchical clustering method. Phyla are abbreviated as follows: Actinobacteria (A), Bacteroidetes (B), Firmicutes (F) and Proteobacteria (P). Storage conditions that differ significantly from the control (−80 °C) by Mann-Whitney U-test are indicated with asterisks; single asterisk (*) represents p ≤ 0.05, double asterisk (**) represents p ≤ 0.01, and triple asterisk (***) represents p ≤ 0.001.

References

    1. Hansen C. H. et al. Mode of delivery shapes gut colonization pattern and modulates regulatory immunity in mice. Journal of immunology 193, 1213–1222, doi: 10.4049/jimmunol.1400085 (2014). - DOI - PubMed
    1. Clarke T. B. et al. Recognition of peptidoglycan from the microbiota by Nod1 enhances systemic innate immunity. Nature medicine 16, 228–231, doi: 10.1038/nm.2087 (2010). - DOI - PMC - PubMed
    1. Yano J. M. et al. Indigenous bacteria from the gut microbiota regulate host serotonin biosynthesis. Cell 161, 264–276, doi: 10.1016/j.cell.2015.02.047 (2015). - DOI - PMC - PubMed
    1. Carabotti M., Scirocco A., Maselli M. A. & Severi C. The gut-brain axis: interactions between enteric microbiota, central and enteric nervous systems. Annals of gastroenterology: quarterly publication of the Hellenic Society of Gastroenterology 28, 203–209 (2015). - PMC - PubMed
    1. Ley R. E., Turnbaugh P. J., Klein S. & Gordon J. I. Microbial ecology: human gut microbes associated with obesity. Nature 444, 1022–1023, doi: 10.1038/4441022a (2006). - DOI - PubMed