. 2016 Feb;91(2):211-9.
doi: 10.1002/ajh.24245.

Mutant calreticulin-expressing cells induce monocyte hyperreactivity through a paracrine mechanism

Affiliations

Mutant calreticulin-expressing cells induce monocyte hyperreactivity through a paracrine mechanism

Michael R Garbati et al. Am J Hematol. 2016 Feb.

Abstract

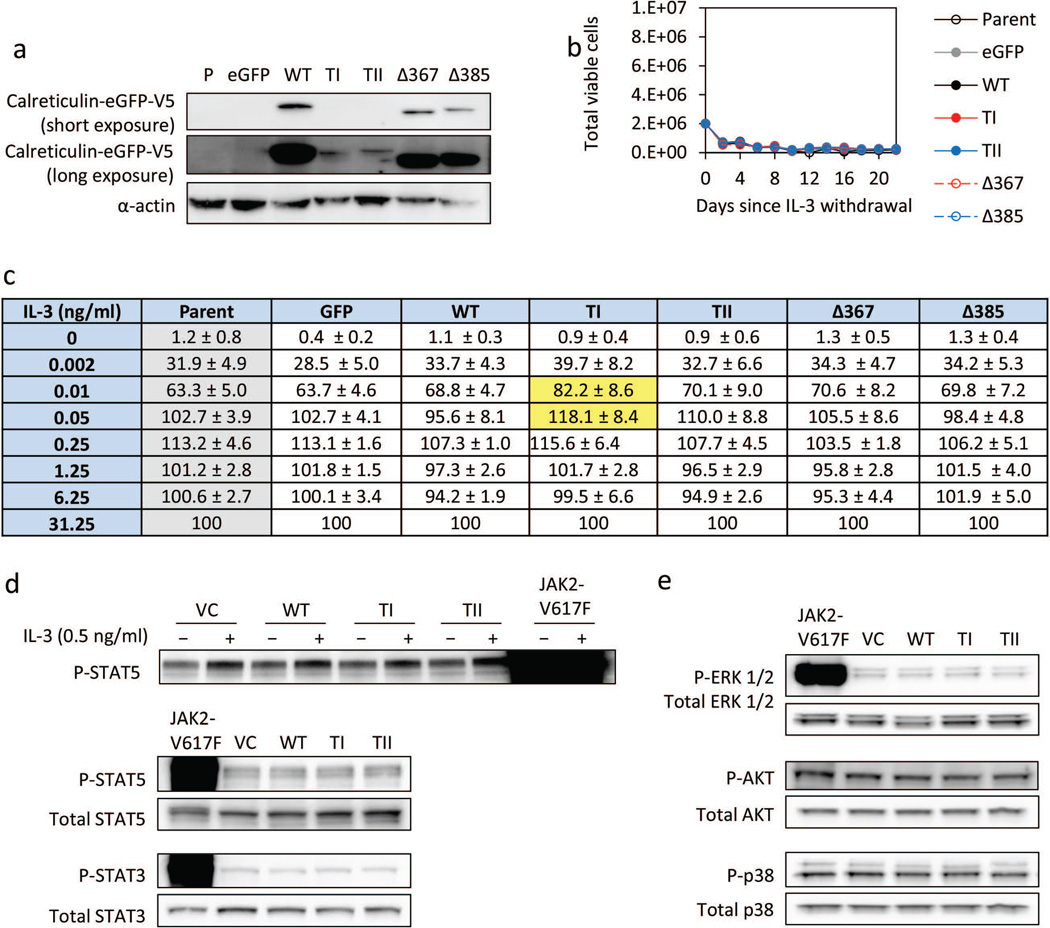
Mutations in the calreticulin gene (CALR) were recently identified in approximately 70-80% of patients with JAK2-V617F-negative essential thrombocytosis and primary myelofibrosis. All frameshift mutations generate a recurring novel C-terminus. Here we provide evidence that mutant calreticulin does not accumulate efficiently in cells and is abnormally enriched in the nucleus and extracellular space compared to wildtype calreticulin. The main determinant of these findings is the loss of the calcium-binding and KDEL domains. Expression of type I mutant CALR in Ba/F3 cells confers minimal IL-3-independent growth. Interestingly, expression of type I and type II mutant CALR in a nonhematopoietic cell line does not directly activate JAK/STAT signaling compared to wildtype CALR and JAK2-V617F expression. These results led us to investigate paracrine mechanisms of JAK/STAT activation. Here we show that conditioned media from cells expressing type I mutant CALR exaggerate cytokine production from normal monocytes with or without treatment with a toll-like receptor agonist. These effects are not dependent on the novel C-terminus. These studies offer novel insights into the mechanism of JAK/STAT activation in patients with JAK2-V617F-negative essential thrombocytosis and primary myelofibrosis.


Conflict of interest statement

Disclosure of Conflicts of Interest

While there is no perceived conflicts of interest related to the work described in this manuscript

Figures

Fig. 1
Fig. 1. Structural properties of wildtype and mutant calreticulin
(a) Protein structure models depicting the overall folding of wildtype calreticulin, type I mutant calreticulin, and type II calreticulin. The C-terminal tails are color coded according to the Lesk color scheme. The single letter code for the amino acids represented is red: DE, blue: KR, green: CVILPFYMW, magenta: NQH, orange: GAST. The number of amino acids (aa), predicted molecular weight in kiloDaltons (kD), and theoretical isolectric point (pI) for wildtype, type I and type II are listed in the table (ExPASY program Compute pI/Mw tool, Swiss Institute of Bioinformatics). (b) Schematic representation of various calreticulin mutants generated in our studies. The KDEL golgi-ER retrieval and ER-retention signal is indicated in black. (c) Western blot of steady state protein expression of Flag (vector-control), Flag-tagged wildtype calreticulin, and various Flag-tagged calreticulin mutants overexpressed in 293FT cells with α-actin as a loading control. This pattern has been observed in 293FT and HeLa cells in more than 5 blots. Quantitation relative to wildtype calreticulin is tabulated, including standard deviation (sd) and P values. (d) Western blot comparing the effects of truncating the hydrophobic region (Δ391 and Δ410) or the novel C-terminus (Δ367 and Δ385) on steady state expression of type I and type II mutant calreticulin, respectively. (e) qRT-PCR analysis of exogenous CALR mRNA levels in HeLa cells. We designed primers that were specific to exogenous CALR mRNA and removed all contaminating DNA by DNase digestion. Data are expressed relative to wildtype CALR as an average relative % from four independent experiments. *P=0.002, **P=0.089, sd for WT is 20.8, for type I is 41.7, and for type II is 40.4.
Fig. 2
Fig. 2. Calreticulin expression in bone marrow samples from type I mutant CALR MF patients
(a) 2D PAGE analysis of lysates from blood mononuclear cells of a normal control and Type I mutant CALR MF patients (P1–P4). Blots were probed for calreticulin and α-actin. A key is provided. The dashed red circle indicates the location of wildtype calreticulin and the blue dashed circle indicates α-actin. The localization of these spots was confirmed using lysates from 293FT cells expressing or not expressing wildtype calreticulin (Supplemental Fig. 1c). (b) Immunohistochemical calreticulin staining of bone marrow biopsy specimens. Shown are three controls (C1–C3) and four patient samples (P1–P4). The table on the left shows the ranking of immunohistochemical staining intensity from lightest to darkest as performed by three blinded reviewers on three independently stained slide sets (Set #1–3). The table on the right shows Aperio ImageScope quantification of slides from Set #2 showing staining intensity as described in the online methods. The P value indicated in the table compares the controls and patient samples. (c) Aperio ImageScope quantification of calreticulin staining in megakaryocytes. Shown are representative images defining megakaryocytes (circled cells) and a table showing the quantification of staining intensity in normal and type I mutant CALR MF patient samples. The P value indicated in the table compares the controls and patient samples.
Fig. 3
Fig. 3. Microscopic analysis and subcellular fractionation of mutant calreticulin
(a) Confocal microscopy of wildtype, type I and type II mutant calreticulin expression in HeLa cells, with and without 2µM thapsigargin. White arrowheads indicate cells showing intense nuclear staining in cells expressing type I or type II mutant calreticulin. Additional confocal images are provided in Supplemental Fig. 4. (b) Representative western blots from experiments fractionating cytoplasmic and nuclear fractions of HeLa cells transfected with Flag-calreticulin. α-actin and SP1 were used as loading controls. SP1, a predominantly nuclear protein, shows significant enrichment in the nuclear fractions similarly across all experimental conditions tested. (c) Quantification of western blots comparing protein levels of type I and type II mutant calreticulin, always in comparison to wildtype calreticulin, in whole cell lysates, and in cytoplasmic and nuclear extracts. Different amounts of protein were loaded for nuclear versus cytoplasmic fractions but the same amount for each calreticulin type. Fold enrichment in the nucleus is in comparison to whole cell lysate values. Data are the mean ± sd of quantitation values from three western blots per condition (whole cell lysate, cytoplasmic fraction, and nuclear fraction), taken relative to wildtype. *P = 0.06, **P = 0.04, relative to wildtype. (d) Western blot of cell culture media collected 24 (bottom panel) or 48 hours (top and bottom panel) after transfection of HeLa cells with Flag-tagged CALR cDNA constructs. Culture media (DMEM) and media from cells transfected with empty Flag vector were used as controls.
Fig. 4
Fig. 4. Evaluating IL-3-independent growth of Ba/F3 cells expressing mutant calreticulin
(a) Western blot of calreticulin tagged with eGFP-V5 at the C-terminus in Ba/F3 cells with α-actin as a loading control. Two different exposures are included to show low levels of type I and type II expression. (b) Ba/F3 cell count following IL-3 withdrawal. The initial cell count was 2×10⁶ per condition. Cultures were maintained for 3 weeks. Experiment was repeated three times. Shown is a representative experiment. (c) Relative % of total viable Ba/F3 cells expressing various CALR types three days after thorough IL-3 washout followed by addition of IL-3 at various concentrations. Each condition is normalized to its own 31.25 ng/ml IL-3 concentration using the MTS assay to quantify viable cells. Data are expressed as mean ± sd, averaging four experiments. Comparisons with P < 0.1, relative to parent Ba/F3 cell counts (gray column), are highlighted in yellow. P = 0.03 (0.01 ng/ml) and 0.08 (0.05 ng/ml). (d) Western blot showing phospho-STAT3 and phospho-STAT5 levels in 293FT cells overexpressing Flag-tagged CALR. Top panel shows cells with and without IL-3 treatment. Total STAT3 and total STAT5 were used as loading controls. (e) Western blot of 293FT cells overexpressing Flag-tagged CALR showing phospho- and total levels of ERK1/2, AKT, and p38.
Fig. 5
Fig. 5. Cytokine production in primary CD14+ monocytes cultured with conditioned media from mutant calreticulin-expressing cells
(a) ELISA quantification of TNF-α produced by normal human CD14+ monocytes cultured with 7.5% or 15% conditioned media (CM) from HeLa cells expressing wildtype or mutant calreticulin for 24 hrs with or without 3µM R848. “3µM” is the equivalent amount of DMSO vehicle used for the 3µM R848 condition and not actually the concentration of DMSO. This strategy was applied in all the experiments. Each condition had three replicates. Vector-control (VC) is the empty 3XFlag vector. Data expressed as mean TNF-α level. Error bars represent sd. Shown is the results of one experiment. Two other independent experiments are presented with this experiment in Supplemental Fig. 5. The experimental conditions were modified between experiments so the absolute amount of TNF-α varied significantly but the overall results and the interpretation are similar. (b) ELISA quantification of TNF-α from CD14+ cells isolated from a normal donor and a type I mutant MF patient treated with DMSO, R848, or lipopolysaccharide (LPS) at the indicated concentrations. Each condition had three replicates. Shown are the results of one experiment, with data expressed as mean TNF-α level. Error bars represent sd. (c) Comprehensive evaluation of cytokines produced in the experiments presented in Fig. 5a and 5b using the Luminex platform. Standard curves for each cytokine evaluated met quality control assessment. We analyzed cytokine production from CD14+ monocytes cultured with 15% conditioned media from HeLa cells expressing the various calreticulin types (left panel). Shown is the heat map of relative cytokine production of the 18 cytokines that had values generally >5 pg/ml. We excluded from this analysis: FGF-Basic, G-CSF, IL-13, RANTES, Eotaxin, IL-4, IL-17, IL-5, IL-15, IFN-g, IL-2, IP-10 because either most or all the readings were close to or <5 pg/ml. The 1µM and 5µM DMSO (vehicle equivalent) were both suitable negative controls and displayed similar cytokine levels to the same controls in the normal versus type I mutant calreticulin patient monocyte studies (right panel). We selected for analysis the 5 µM R848 and 1 ng/ml LPS conditions. (d) Venn diagram illustrating the cytokines that were particularly interesting (defined in in Supplemental Fig. 6 and 7) in both types of experiments. Cytokines that displayed ≥ 2-fold induction are highlighted in bold.
Fig. 6
Fig. 6. Model depicting the abnormal functions of mutant calreticulin
The subcellular localization of wildtype and mutant calreticulin is depicted in this figure. We propose that a non-hematopoietic or hematopoietic cell expressing mutant calreticulin can induce this effect on monocytes. The wildtype N-domain and the lectin-like P-domain that gives calreticulin its protein chaperone properties are conserved in mutant calreticulin. These domains are depicted in gray. The wildtype acidic C-terminus domain is depicted in red and the KDEL signal is in black. The more basic C-terminus domain of mutant calreticulin (type I and type II) is depicted in blue. The numbered circles depict: 1. ER localization of wildtype and mutant calreticulin. 2. Nuclear localization of wildtype and mutant calreticulin. 3. Cytoplasmic localization of wildtype and mutant calreticulin. 4. Membrane localization of wildtype and mutant calreticulin. 5. Extracellular localization of N-terminal fragments of wildtype and mutant calreticulin. One is a smaller fragment also known as vasostatin (small gray circles). The other, observed in our studies, is a larger fragment generated by cleavage at amino acid #340 by proteases as previously reported (large gray circles). 6. Secreted factor(s) induce hyperreactivity of monocytes with or without R848 (a toll-like receptor 7/8 agonist). Cytokines that were significantly elevated (see Fig. 5d and Supplemental Fig. 6 and 7 and the corresponding results section) in both the cell line work and the patient sample studies are indicated here. Highlighted in the yellow circled numbers are features that are abnormally enhanced in mutant calreticulin when compared to wildtype calreticulin.

Similar articles

Cited by

References

    1. Klampfl T, et al. Somatic mutations of calreticulin in myeloproliferative neoplasms. N Engl J Med. 2013;369:2379–2390. - PubMed
    1. Nangalia J, et al. Somatic CALR mutations in myeloproliferative neoplasms with nonmutated JAK2. N Engl J Med. 2013;369:2391–2405. - PMC - PubMed
    1. Rampal R, et al. Integrated genomic analysis illustrates the central role of JAK-STAT pathway activation in myeloproliferative neoplasm pathogenesis. Blood. 2014;123:e123–e133. - PMC - PubMed
    1. Del Cid N, et al. Modes of calreticulin recruitment to the major histocompatibility complex class I assembly pathway. J Biol Chem. 2010;285:4520–4535. - PMC - PubMed
    1. Jeffery E, Peters LR, Raghavan M. The polypeptide binding conformation of calreticulin facilitates its cell-surface expression under conditions of endoplasmic reticulum stress. J Biol Chem. 2011;286:2402–2415. - PMC - PubMed

Publication types

MeSH terms