. 2015 Nov 16:16:956.
doi: 10.1186/s12864-015-2159-z.

Gene expression and functional annotation of human choroid plexus epithelium failure in Alzheimer's disease

Affiliations

Gene expression and functional annotation of human choroid plexus epithelium failure in Alzheimer's disease

Arthur A Bergen et al. BMC Genomics. .

Abstract

Background: Alzheimer's disease (AD) is the most common form of dementia. AD has a multifactorial disease etiology and is currently untreatable. Multiple genes and molecular mechanisms have been implicated in AD, including ß-amyloid deposition in the brain, neurofibrillary tangle accumulation of hyper-phosphorylated Tau, synaptic failure, oxidative stress and inflammation. Relatively little is known about the role of the blood-brain barriers, especially the blood-cerebrospinal fluid barrier (BCSFB), in AD. The BCSFB is involved in cerebrospinal fluid (CSF) production, maintenance of brain homeostasis and neurodegenerative disorders.

Results: Using an Agilent platform with common reference design, we performed a large scale gene expression analysis and functional annotation of the Choroid Plexus Epithelium (CPE), which forms the BCSFB. We obtained 2 groups of freshly frozen Choroid Plexus (CP) of 7 human donor brains each, with and without AD: Braak stages (0-1) and (5-6). We cut CP cryo-sections and isolated RNA from cresyl-violet stained, laser dissected CPE cells. Gene expression results were analysed with T-tests (R) and the knowledge-database Ingenuity. We found statistically significantly altered gene expression data sets, biological functions, canonical pathways, molecular networks and functionalities in AD-affected CPE. We observed specific cellular changes due to increased oxidative stress, such as the unfolded protein response, E1F2 and NRF2 signalling and the protein ubiquitin pathway. Most likely, the AD-affected BCSFB barrier becomes more permeable due to downregulation of CLDN5. Finally, our data also predicted down regulation of the glutathione mediated detoxification pathway and the urea cycle in the AD CPE, which suggest that the CPE sink action may be impaired. Remarkably, the expression of a number of genes known to be involved in AD, such as APP, PSEN1, PSEN2, TTR and CLU is moderate to high and remains stable in both healthy and affected CPE. Literature labelling of our new functional molecular networks confirmed multiple previous (molecular) observations in the AD literature and revealed many new ones.

Conclusions: We conclude that CPE failure in AD exists. Combining our data with those of the literature, we propose the following chronological and overlapping chain of events: increased Aß burden on CPE; increased oxidative stress in CPE; despite continuous high expression of TTR: decreased capability of CPE to process amyloid; (pro-) inflammatory and growth factor signalling by CPE; intracellular ubiquitin involvement, remodelling of CPE tight junctions and, finally, cellular atrophy. Our data corroborates the hypothesis that increased BCSFB permeability, especially loss of selective CLDN5-mediated paracellular transport, altered CSF production and CPE sink action, as well as loss of CPE mediated macrophage recruitment contribute to the pathogenesis of AD.


Figures
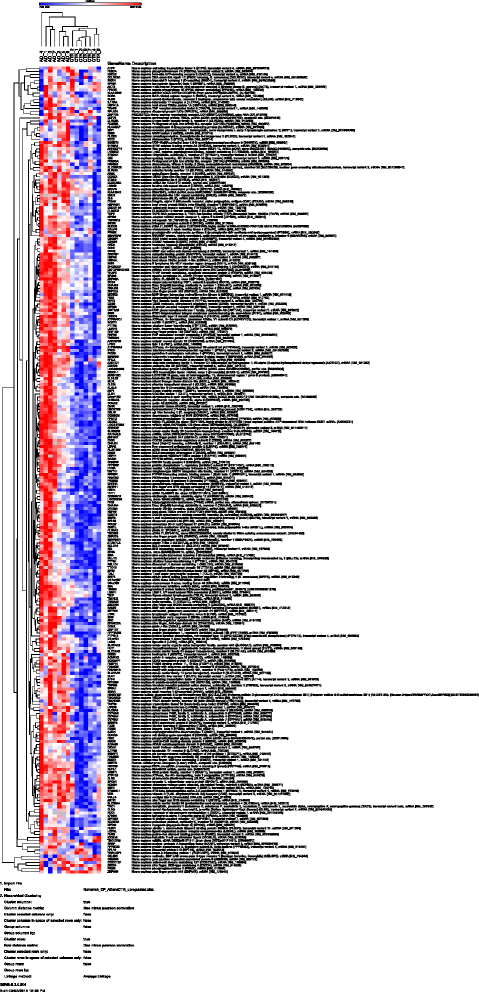
Fig. 1
Fig. 1
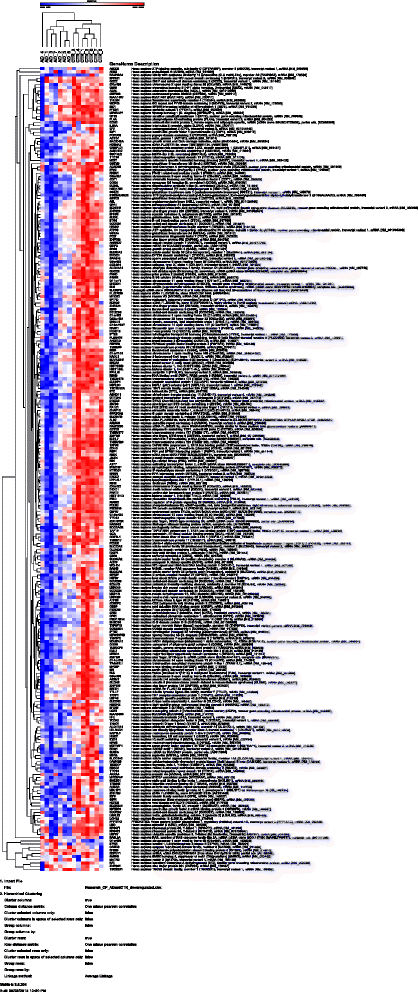
Cluster analysis of mean expression values for the up-regulated genes in AD (Br5–6) choroid plexus compared to healthy control choroid plexus (Br0–1). Cluster analysis was performed using GENE-E (version 3.0.204; analysis performed on 10/10/2015) with the “one minus Pearson correlation” and the “Average linkage method”. See also http://www.broadinstitute.org/cancer/software/GENE-E/. On the Y-axis gene names are shown, on the X-axis the individual samples. Blue and red colors indicate, respectively, relatively low and high numerical expression values. The dendograms at the top and the left side denote the (close) relationships between, respectively, the samples and the genes. Analysis parameter values are given below the figure. Both the AD and control samples cluster nicely together. Please use your PDF zoom function to evaluate details.
Fig. 2
Fig. 2
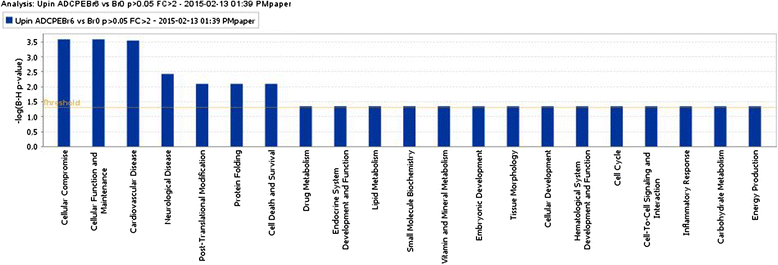
Graph of the most significant over-represented and upregulated biological pathways in (Br5-6) AD CPE. The height of the bars indicates the level of statistical significance. The straight horizontal yellow line represents the cut off value of statistical significance. The yellow line jumping up and down indicates the ratio of the number of genes present in the experimental dataset, divided by the theoretical number of genes that together would make up the functionality
Fig. 3
Fig. 3
Upregulation of the over-represented unfolded protein response in AD affected CPE. In the schematic drawing all regulated potential molecular players of the unfolded protein response are presented. The filled (red) symbols represent the entries which are actually statistically significantly upregulated in AD affected CPE (Br5–6) in our data set(s). Other entries may also be expressed by the CPE, but are not regulated between healthy and AD-affected CPE
Fig. 4
Fig. 4
Cluster analysis of mean expression values for the down-regulated genes in AD (Br5–6) choroid plexus compared to healthy control choroid plexus (Br0–1). Cluster analysis was performed using GENE-E (version 3.0.204; analysis performed on 10/10/2015) with “one minus Pearson correlation” and “Average linkage method” http://www.broadinstitute.org/cancer/software/GENE-E/. On the Y-axis the gene symbols are shown, on the X-axis the individual samples. Blue and red colors indicate, respectively relatively low and high numerical expression values. The dendograms at the top and the left side denote the (close) relationships between, respectively, the samples and the genes. Analysis parameter values are given below the figure. Both the AD and control samples cluster nicely together. To view details, please use your PDF zoom function.
Fig. 5
Fig. 5
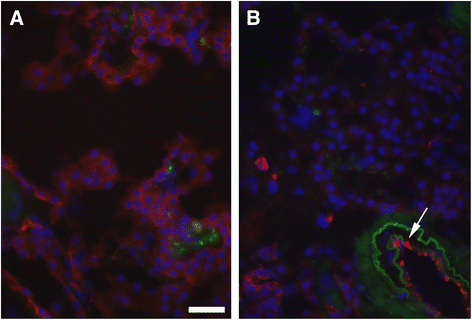
Decreased CLDN5 immunostaining in AD affected CPE. In the healthy CP (a), choroid plexus epithelial (CPE) cells stained positive for CLDN5 (red color). In the AD tissue (b) the strings of CPE cells stain much less intensely for CLDN5. Note that in the same AD tissue, CLDN5 is clearly present in the blood vessel wall (arrow). Immunohistochemistry for CLDN5 on (6 μm thick) cryo-sections of CP from a healthy donor (A, Br0) and a donor diagnosed with AD (Br6). CLDN5 was visualized with Cy3 coupled secondary antibodies after labelling with anti-claudin 5 antibody ab53765 (Abcam). Cy3 fluorescence is shown in red. Nuclei are stained with DAPI (blue). The green color shows the autofluorescence that is detected in the FITC channel. This channel was added to reveal autofluorescence possibly overlapping with the Cy3 fluorescence marking the presence of CLDN5. Bar is 20 μm

References

    1. Querfurth HW, LaFerla FM. Alzheimer’s disease. N Engl J Med. 2010;362:329–44. doi: 10.1056/NEJMra0909142. - DOI - PubMed
    1. Cruts M, Van BC. Molecular genetics of Alzheimer’s disease 421. Ann Med. 1998;30:560–5. doi: 10.3109/07853899809002605. - DOI - PubMed
    1. Guerreiro R, Wojtas A, Bras J, Carrasquillo M, Rogaeva E, Majounie E, et al. TREM2 variants in Alzheimer’s disease. N Engl J Med. 2013;368:117–27. doi: 10.1056/NEJMoa1211851. - DOI - PMC - PubMed
    1. Jonsson T, Stefansson H, Steinberg S, Jonsdottir I, Jonsson PV, Snaedal J, et al. Variant of TREM2 associated with the risk of Alzheimer’s disease. N Engl J Med. 2013;368:107–16. doi: 10.1056/NEJMoa1211103. - DOI - PMC - PubMed
    1. Naj AC, Jun G, Beecham GW, Wang LS, Vardarajan BN, Buros J, et al. Common variants at MS4A4/MS4A6E, CD2AP, CD33 and EPHA1 are associated with late-onset Alzheimer’s disease. Nat Genet. 2011;43:436–41. doi: 10.1038/ng.801. - DOI - PMC - PubMed