. 2015 Dec;5(1):41.
doi: 10.1186/s13613-015-0085-5. Epub 2015 Nov 16.

Personalizing blood pressure management in septic shock

Affiliations

Personalizing blood pressure management in septic shock

Ryotaro Kato et al. Ann Intensive Care. 2015 Dec.

Abstract

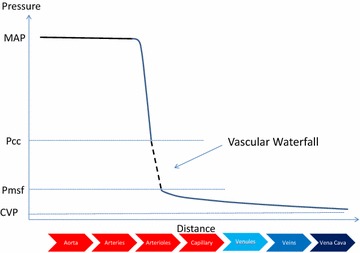
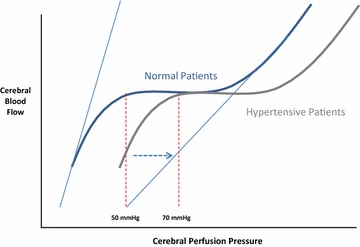
This review examines the available evidence for targeting a specific mean arterial pressure (MAP) in sepsis resuscitation. The clinical data suggest that targeting an MAP of 65-70 mmHg in patients with septic shock who do not have chronic hypertension is a reasonable first approximation. Whereas in patients with chronic hypertension, targeting a higher MAP of 80-85 mmHg minimizes renal injury, but it comes with increased risk of arrhythmias. Importantly, MAP alone should not be used as a surrogate of organ perfusion pressure, especially under conditions in which intracranial, intra-abdominal or tissue pressures may be elevated. Organ-specific perfusion pressure targets include 50-70 mmHg for the brain based on trauma brain injury as a surrogate for sepsis, 65 mmHg for renal perfusion and >50 mmHg for hepato-splanchnic flow. Even at the same MAP, organs and regions within organs may have different perfusion pressure and pressure-flow relationships. Thus, once this initial MAP target is achieved, MAP should be titrated up or down based on the measures of organ function and tissue perfusion.

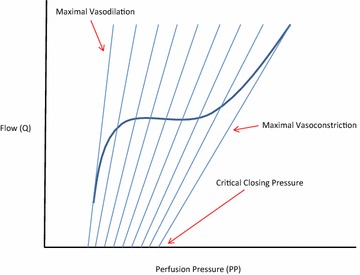
Keywords: Arterial blood pressure; Autoregulation; Critical closing pressure; Organ blood flow; Resuscitation; Sepsis; Septic shock; Vasopressor therapy.


Figures

Fig. 1
Fig. 1
Theoretical relationship between arterial input pressure (P) and blood flow (Q) for a given vascular bed or the entire body. The thick solid line represents the actual relationship between pressure and flow describing the autoregulation of vascular tone to sustain a constant blood flow despite varying arterial input pressures. The smaller straight lines reflect the theoretical instantaneous arterial input pressure to blood flow relations that exist upon this autoregulation curve showing how changes in vascular tone from maximal vasoconstriction (far left) to maximal vasodilation (far right) account for this phenomenon. Note the zero blood flow intercept points, or critical closing pressure of the arterial input circuit also varies with changes in vasomotor tone such that both slope (resistance) and zero-flow intercept (critical closing pressure) co-vary as local vasomotor tone varies
Fig. 2
Fig. 2
Theoretical vascular pressure profile from aortic values through the circulation to the great veins. Note that mean arterial pressure (MAP) is constant for most of the length of the large arteries, because those vessels serve mainly as vascular capacitors holding stored blood under pressure. Whereas vascular pressure drops rapidly as blood traverses the smallest arteries, arteriole and precapillary sphincters. The point at which arterioles spontaneously collapse limiting arterial pressure drop is referred to as the critical closing pressure (Pcc) and approximates a vascular waterfall, in that water flowing over a waterfall is unaffected by how far it falls once over the edge. Thus, shown as a dashed line, the pressure fall from arterioles to venules; changes in the downstream venous pressure do not influence either arterial pressure or blood flow. While the mean systemic filling pressure (Pmsf) represents the upstream pressure driving venous return against a downstream central venous pressure (CVP). These concepts were recently validated in post-operative humans where Pcc was estimated to be about 40 mmHg and Pmsf at 20 mmHg [14]
Fig. 3
Fig. 3
Theoretical relationship between cerebral perfusion pressure (CPP) and cerebral blood flow using the same construct as in Fig. 1. Here, the autoregulatory range for subjects without hypertension (normal patients) is in blue and that for patients with hypertension (hypertensive patients) is shown in gray. Note that the minimal CPP within the autoregulatory zone for normal is about 50 mmHg whereas for those with hypertension it is shifted rightward with CPP on the x-axis to 70 mmHg. Again the maximal vasoconstriction and vasodilation instantaneous CCP-cerebral blood flow relations for normal patients are shown as the light blue lines

Similar articles

Cited by

References

    1. Weil MH, Shubin H. The, “VIP” approach to the bedside management of shock. JAMA. 1969;207:337–340. doi: 10.1001/jama.1969.03150150049010. - DOI - PubMed
    1. Vincent JL, Ince C, Bakker J. Clinical review: circulatory shock—an update: a tribute to Professor Max Harry Weil. Crit Care. 2012;16:239. doi: 10.1186/cc11511. - DOI - PMC - PubMed
    1. Dellinger RP, Levy MM, Rhodes A, Annane D, Gerlach H, Opal SM, et al. Surviving Sepsis Campaign: international guidelines for management of severe sepsis and septic shock: 2012. Crit Care Med. 2013;41:580–637. doi: 10.1097/CCM.0b013e31827e83af. - DOI - PubMed
    1. Cecconi M, De Backer D, Antonelli M, Beale R, Bakker J, Hofer C, Jaesche R, Mebazaa A, Pinsky MR, Teboul JL, Vincent JL, Rhodes A. Consensus on circulatory shock and hemodynamic monitoring. Task Force Eur Soc Intensive Care Med Intensive Care Med. 2014;49:1795–1815. - PMC - PubMed
    1. Asfar P, Meziani F, Hamel JF, Grelon F, Megarbane B, Anguel N, et al. High versus low blood-pressure target in patients with septic shock. N Engl J Med. 2014;370:1583–1593. doi: 10.1056/NEJMoa1312173. - DOI - PubMed