. 2015 Dec 1;75(23):5046-57.
doi: 10.1158/0008-5472.CAN-15-0706. Epub 2015 Nov 16.

Obesity Contributes to Ovarian Cancer Metastatic Success through Increased Lipogenesis, Enhanced Vascularity, and Decreased Infiltration of M1 Macrophages

Affiliations

Obesity Contributes to Ovarian Cancer Metastatic Success through Increased Lipogenesis, Enhanced Vascularity, and Decreased Infiltration of M1 Macrophages

Yueying Liu et al. Cancer Res. .

Abstract

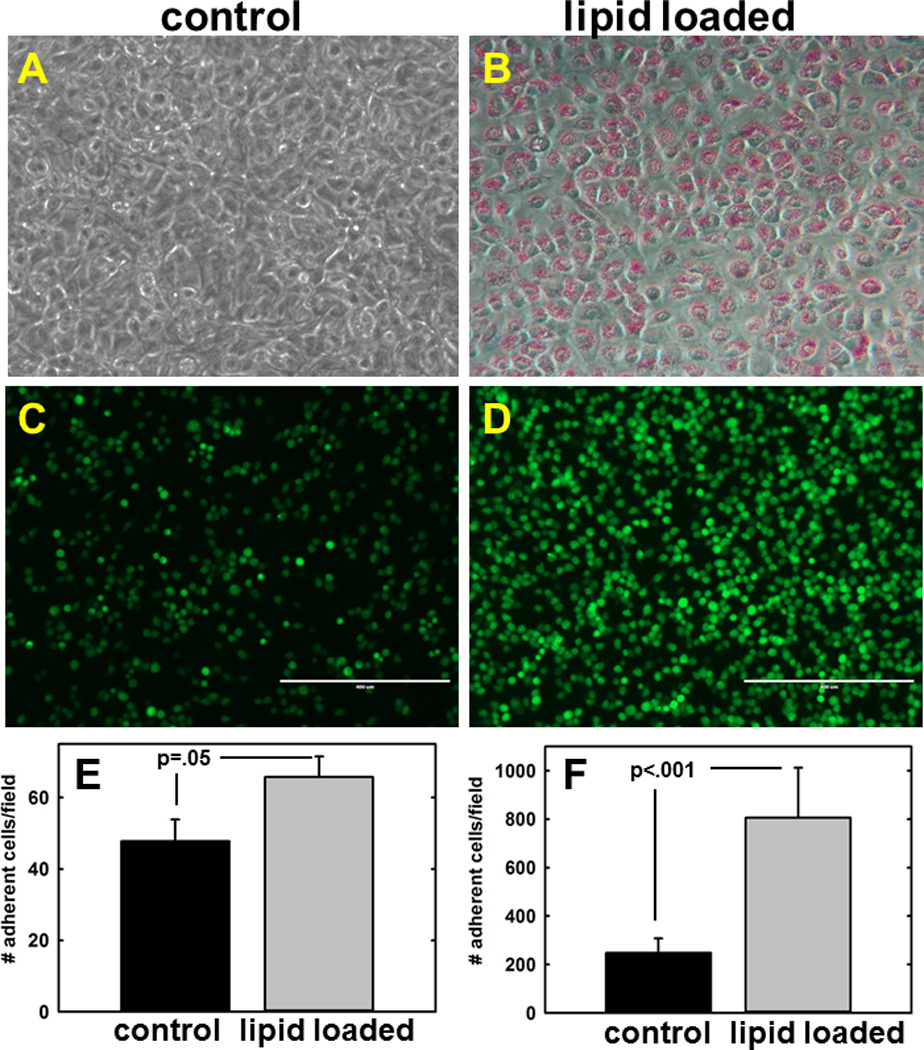
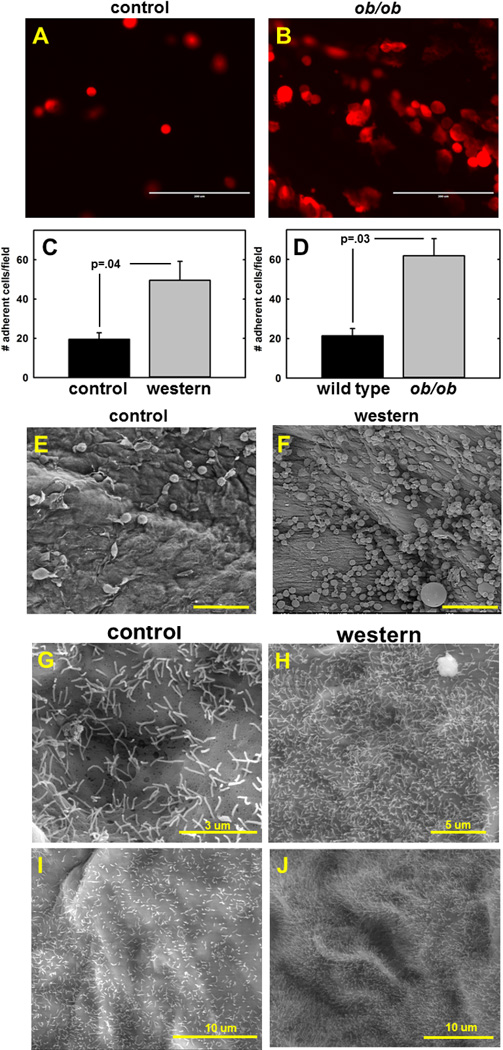
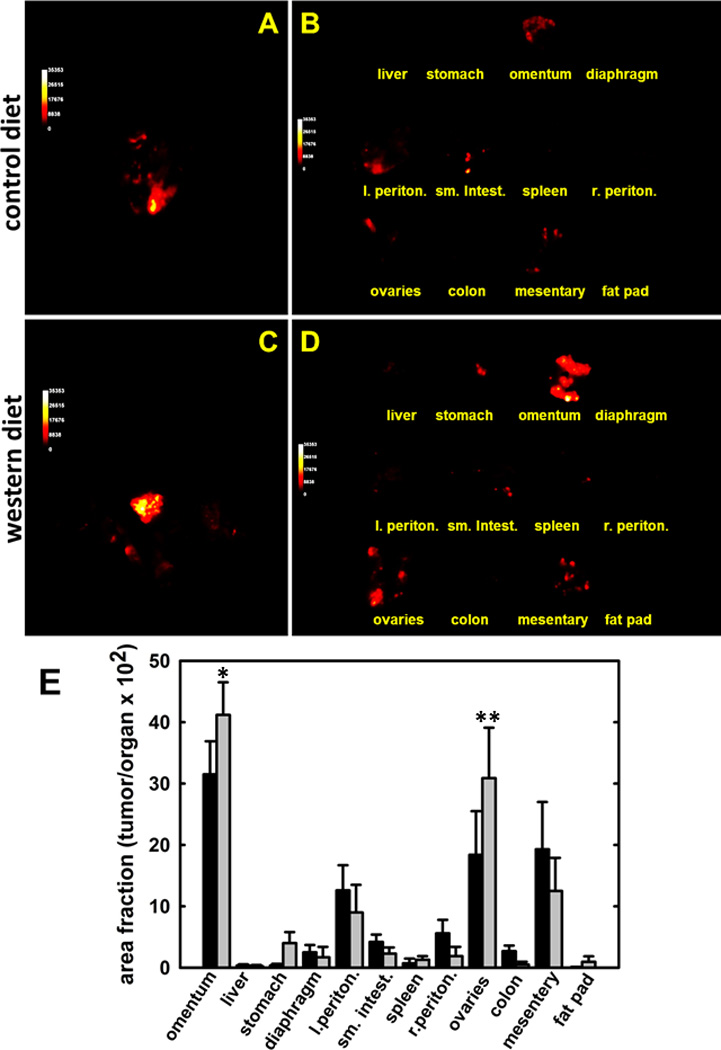
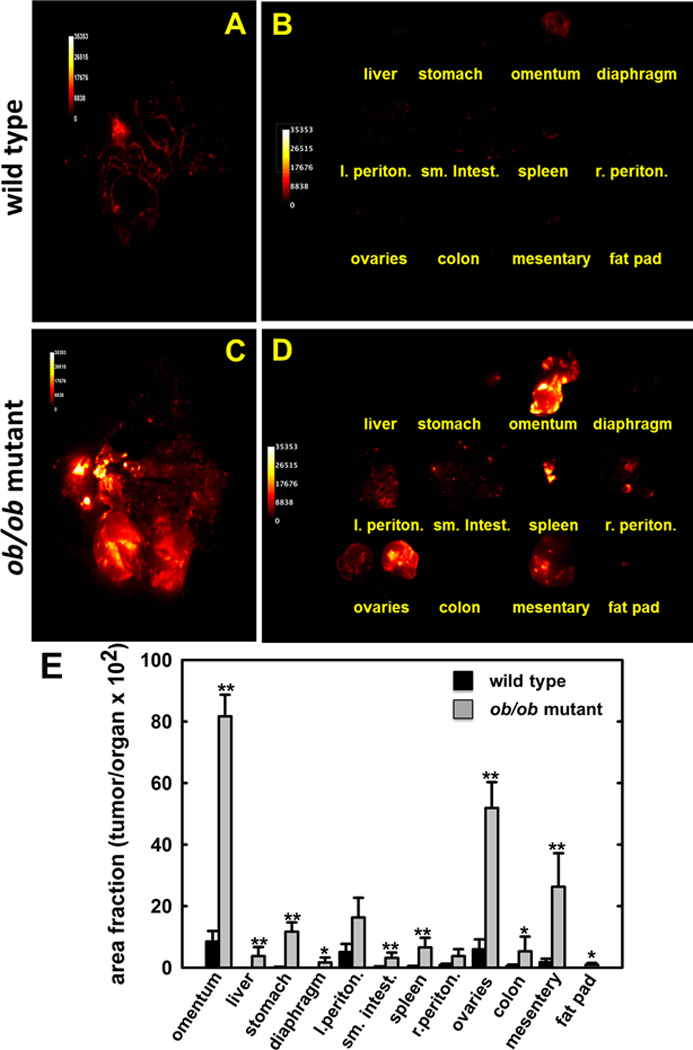
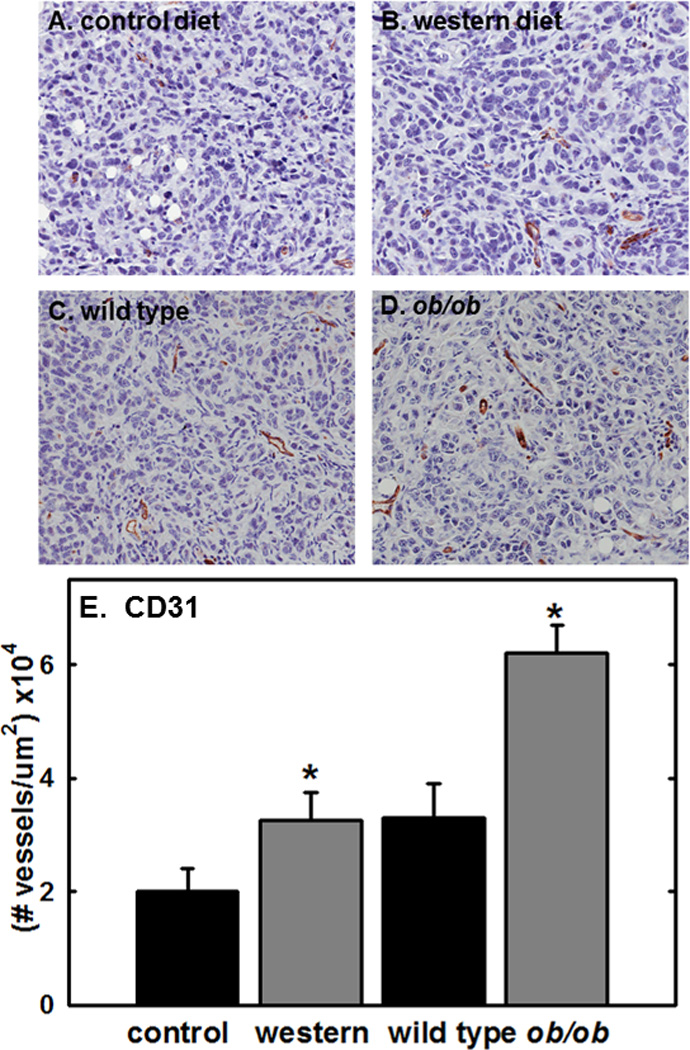
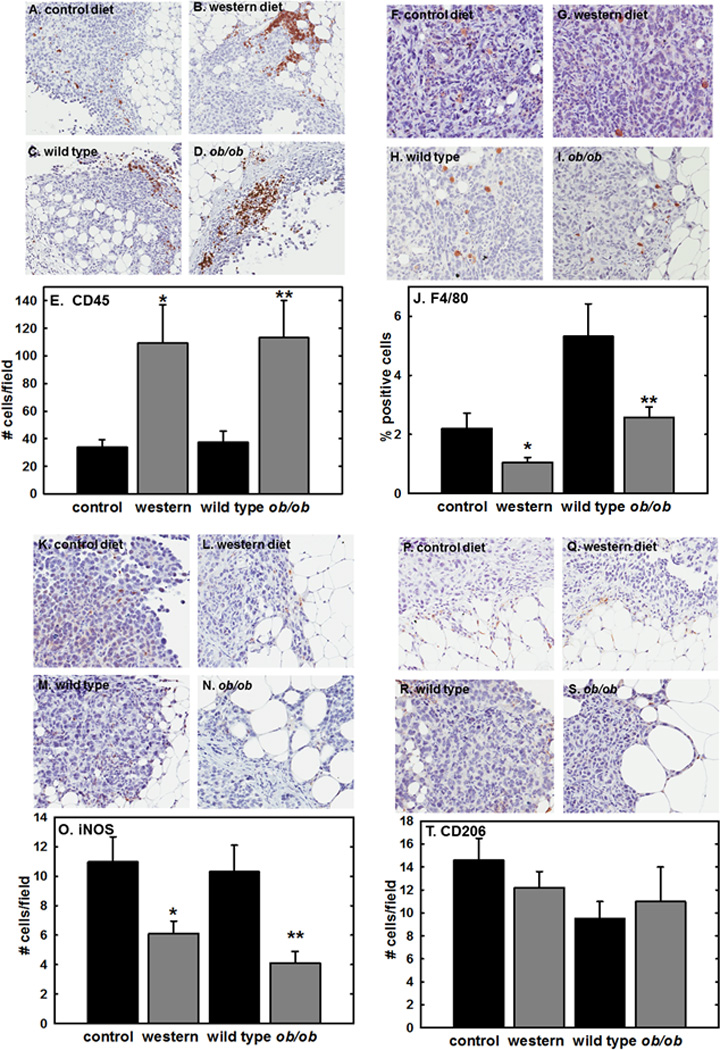
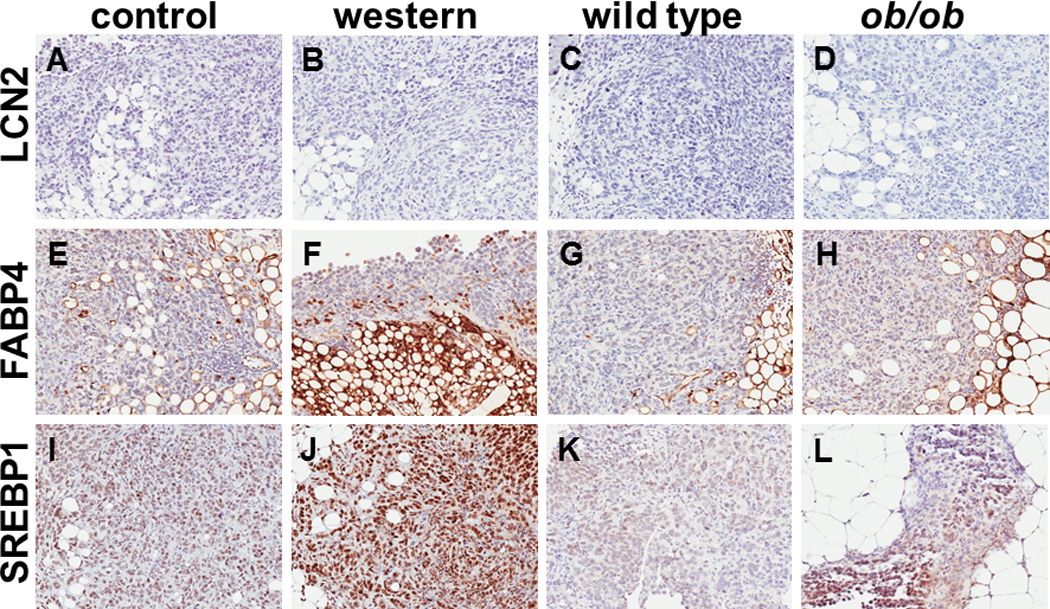
Epithelial ovarian cancer (EOC) is the leading cause of death from gynecologic malignancy, with high mortality attributable to widespread intraperitoneal metastases. Recent meta-analyses report an association between obesity, ovarian cancer incidence, and ovarian cancer survival, but the effect of obesity on metastasis has not been evaluated. The objective of this study was to use an integrative approach combining in vitro, ex vivo, and in vivo studies to test the hypothesis that obesity contributes to ovarian cancer metastatic success. Initial in vitro studies using three-dimensional mesomimetic cultures showed enhanced cell-cell adhesion to the lipid-loaded mesothelium. Furthermore, in an ex vivo colonization assay, ovarian cancer cells exhibited increased adhesion to mesothelial explants excised from mice modeling diet-induced obesity (DIO), in which they were fed a "Western" diet. Examination of mesothelial ultrastructure revealed a substantial increase in the density of microvilli in DIO mice. Moreover, enhanced intraperitoneal tumor burden was observed in overweight or obese animals in three distinct in vivo models. Further histologic analyses suggested that alterations in lipid regulatory factors, enhanced vascularity, and decreased M1/M2 macrophage ratios may account for the enhanced tumorigenicity. Together, these findings show that obesity potently affects ovarian cancer metastatic success, which likely contributes to the negative correlation between obesity and ovarian cancer survival.


Conflict of interest statement

Conflicts of Interest: The authors have no conflicts of interest to disclose.

Figures

Figure 1
Figure 1. Lipid-loading enhances adhesion of ovarian cancer cells to meso-mimetic cultures
(A,B) Primary human mesothelial cells were cultured for 10d with BSA (control) or oleic+linoleic acid as described in Methods. (C–F) Lipid-loaded mesothelial cells were assembled into 3-dimensional meso-mimetic cultures comprised of fibroblast-embedded collagen overlaid with primary human mesothelial cells. Meso-mimetic cultures were incubated with CMFDA fluorescently tagged ovarian cancer cells (example shows OVCA433; 1×10⁵ cells, 2 h, 37°C), washed with PBS to remove non-adherent cells, and adherent cells quantified using fluorescence microscopy. Scale bar 400 um. (E) Adhesion of OVCA433 cells, p=.05. (F) Adhesion of SKOVi.p. cells, p<.001.
Figure 2
Figure 2. Obesity alters ovarian cancer cell adhesion to peritoneal explants and peritoneal ultrastructure
(A–F) Ex vivo analysis of adhesion to peritoneal explants. Peritoneal tissue was pinned mesothelium-up to optically clear silastic resin prior to addition of fluorescently tagged tumor cells (6.25×10⁵) for 2h. After washing to remove non-adherent cells, adherent cells were (C,D) quantified using fluorescence microscopy or (E,F) visualized by scanning electron microscopy. (A,B) Representative results using peritoneal tissue from wild type control vs ob/ob mice and ID8-RFP murine ovarian cancer cells are shown. Experiments was performed in triplicate. Scale bar, 200 um (C) Quantitation of results from adhesion of ID8 murine ovarian cancer cells to peritoneum from C57Bl/6 mice fed a control or western diet. (p=.04). (D) Quantitation of results from adhesion of ID8-RFP murine ovarian cancer cells to peritoneum from wild type control C57Bl/6 mice or ob/ob mutant mice (p=.03). (E,F) Scanning electron micrographs of peritoneal tissue from control or DIO nude mice incubated with SKOVi.p. human ovarian cancer cells. Scale bar 100 um (G–J) Scanning electron micrographs of microvilli present on peritoneum from nude mice fed (G,I) control or (H,J) western diet.
Figure 3
Figure 3. Distribution of metastatic tumor burden in control vs DIO mice
C57Bl/6 mice were fed on control or western diet prior to i.p. injection with 8×10⁶ ID8-RFP cells. Following sacrifice, tumors were imaged (A,C) in situ and (B,D) ex vivo and (E) relative tumor burden (area fraction of tumor/organ) determined as described in Methods. (*p<.07;**p<.05)
Figure 4
Figure 4. Distribution of metastatic tumor burden in wild type control vs ob/ob mutant mice
Wild type C57Bl/6 or ob/ob mutant mice were injected i.p. with 8×10⁶ ID8-RFP cells. Following sacrifice, tumors were imaged (A,C) in situ and (B,D) ex vivo and (E) relative tumor burden (area fraction of tumor/organ) determined as described in Methods. (*p<.07;**p<.05)
Figure 5
Figure 5. Immunohistochemical analysis of vascularity in murine tumor tissues
(A–D) Representative images showing vessel staining in metastatic tumors grown in (A) control diet or (B) western diet C57Bl/6 mice or (C) wild type control or (D) ob/ob mutant mice. Tissues were stained for the presence of vessels using anti-CD31 antibody (1:600 dilution), peroxidase conjugated secondary antibody and DAB chromogen detection as described in Methods. tissue. (E) Quantitation of vessel density. Staining was quantified using an Aperio Image Scope digital pathology system as described in Methods. (*p<.05)
Figure 6
Figure 6. Immunohistochemical analysis of inflammatory cells in murine tumor tissues
(A–D) Representative images showing B lymphocyte staining in metastatic tumors grown in (A) control diet or (B) western diet C57Bl/6 mice or (C) wild type control or (D) ob/ob mutant mice. Tissues were stained for B lymphocytes using anti-CD45 antibody (1:800 dilution), peroxidase conjugated secondary antibody and DAB chromogen detection as described in Methods. (E) Quantitation of B lymphocytes. Staining was quantified by enumeration of positive cells in a minimum of 5 high powered fields per subject. (*p=.05; **p=.002) (F–I) Representative images showing macrophage staining in metastatic tumors grown in (F) control diet or (G) western diet C57Bl/6 mice or (H) wild type control or (I) ob/ob mutant mice. Tissues were stained for macrophages using anti-F4/80 antibody (1:50 dilution), peroxidase conjugated secondary antibody and DAB chromogen detection as described in Methods. (J) Quantitation of macrophages. Staining was quantified using an Aperio Image Scope digital pathology system as described in Methods. (*p=.033; **p=.011) (K–N) Representative images showing M1 macrophage staining in metastatic tumors grown in (K) control diet or (L) western diet C57Bl/6 mice or (M) wild type control or (N) ob/ob mutant mice. Tissues were stained for M1 macrophages using anti-iNOS antibody (1:2000 dilution), peroxidase conjugated secondary antibody and DAB chromogen detection as described in Methods. (O) Quantitation of M1 macrophages. Staining was quantified by enumeration of positive cells in a minimum of 5 high powered fields per subject. (*p=.05; **p=.01) (P–S) Representative images showing M2 macrophage staining in metastatic tumors grown in (P) control diet or (Q) western diet C57Bl/6 mice or (R) wild type control or (S) ob/ob mutant mice. Tissues were stained for M2 macrophages using anti-CD206 antibody (1:64000 dilution), peroxidase conjugated secondary antibody and DAB chromogen detection as described in Methods. (T) Quantitation of M2 macrophages. Staining was quantified by enumeration of positive cells in a minimum of 5 high powered fields per subject. (differences are not significant).
Figure 7
Figure 7. Immunohistochemical analysis of lipid regulatory proteins in murine tumor tissues
(A–D) Representative images showing lipocalin-2 (LCN2) staining in metastatic tumors grown in (A) control diet or (B) western diet C57Bl/6 mice or (C) wild type control or (D) ob/ob mutant mice. Tissues were stained for LCN2 using anti-LCN2 antibody (1:2000 dilution), peroxidase conjugated secondary antibody and DAB chromogen detection as described in Methods. (E–H) Representative images showing fatty acid binding protein-4 (FABP4) staining in metastatic tumors grown in (E) control diet or (F) western diet C57Bl/6 mice or (G) wild type control or (H) ob/ob mutant mice. Tissues were stained FABP4 using anti-FABP4 antibody (1:6400 dilution), peroxidase conjugated secondary antibody and DAB chromogen detection as described in Methods. (I–L) Representative images showing sterol regulatory element binding protein-1 (SREBP1) staining in metastatic tumors grown in (I) control diet or (J) western diet C57Bl/6 mice or (K) wild type control or (L) ob/ob mutant mice. Tissues were stained for SREBP1 using anti-SREBP1 antibody (1:600 dilution), peroxidase conjugated secondary antibody and DAB chromogen detection as described in Methods.

References

    1. U.S. Cancer Statistics Working Group. Incidence and Mortality Web Based Report. Department of Health and Human Services, Centers for Disease Control and Prevention, and National Cancer Institute; 2014. United States Cancer Statisitics: 1999–2011.
    1. Cramer DW. The epidemiology of endometrial and ovarian cancer. Hematol Oncol Clin North Am. 2012;26:1–12. - PMC - PubMed
    1. Jemal A, Bray F, Ferlay J. Global cancer statistics. 2011;61:69–90. - PubMed
    1. Siegel R, Naishadham D, Jemal A. Cancer statistics 2013. CA Cancer J. Clin. 2013;63:11–30. - PubMed
    1. American Cancer Society. Cancer Facts and figures. Atlanta: 2013.

Publication types

MeSH terms