. 2015 Dec 15;75(24):5355-66.
doi: 10.1158/0008-5472.CAN-14-3689. Epub 2015 Nov 16.

Targeting a Plk1-Controlled Polarity Checkpoint in Therapy-Resistant Glioblastoma-Propagating Cells

Affiliations

Targeting a Plk1-Controlled Polarity Checkpoint in Therapy-Resistant Glioblastoma-Propagating Cells

Robin G Lerner et al. Cancer Res. .

Abstract

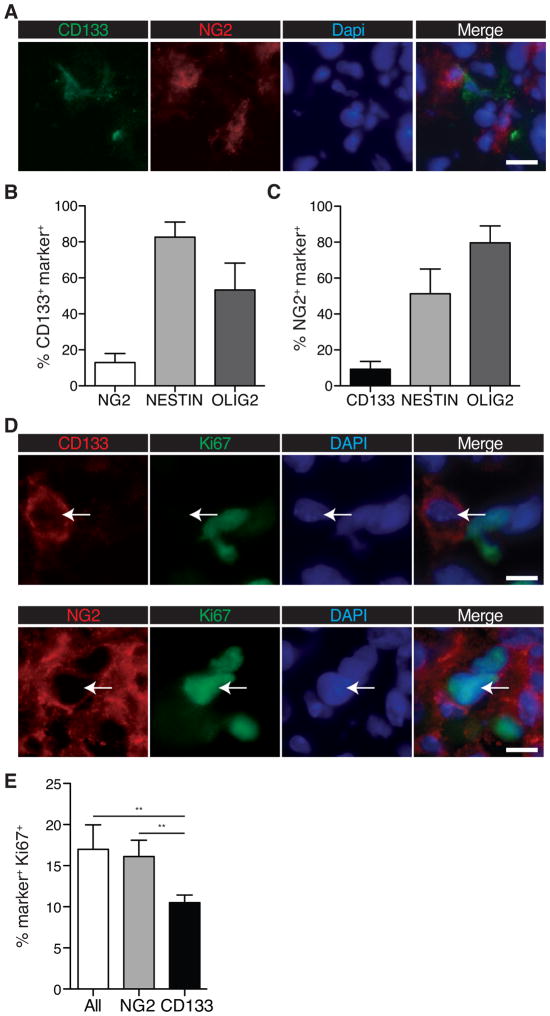
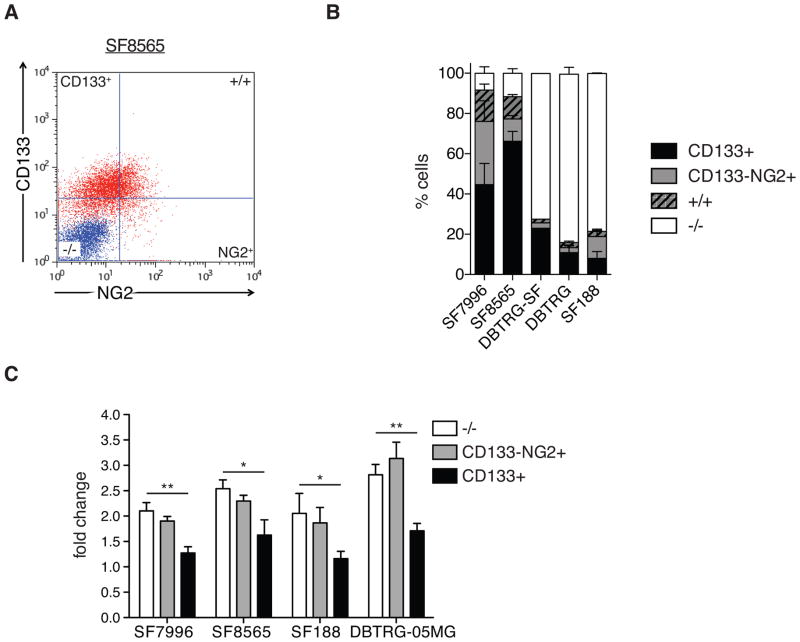
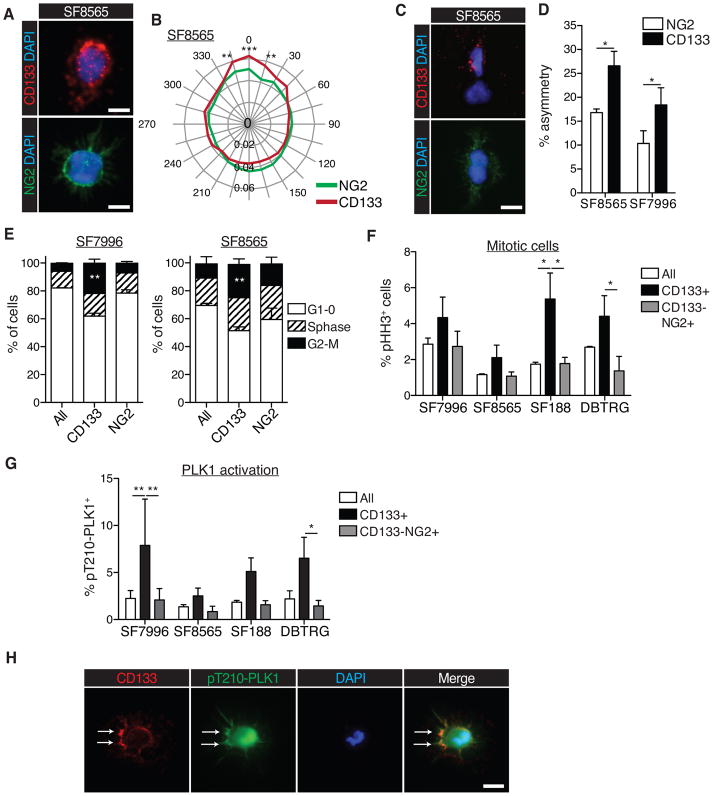
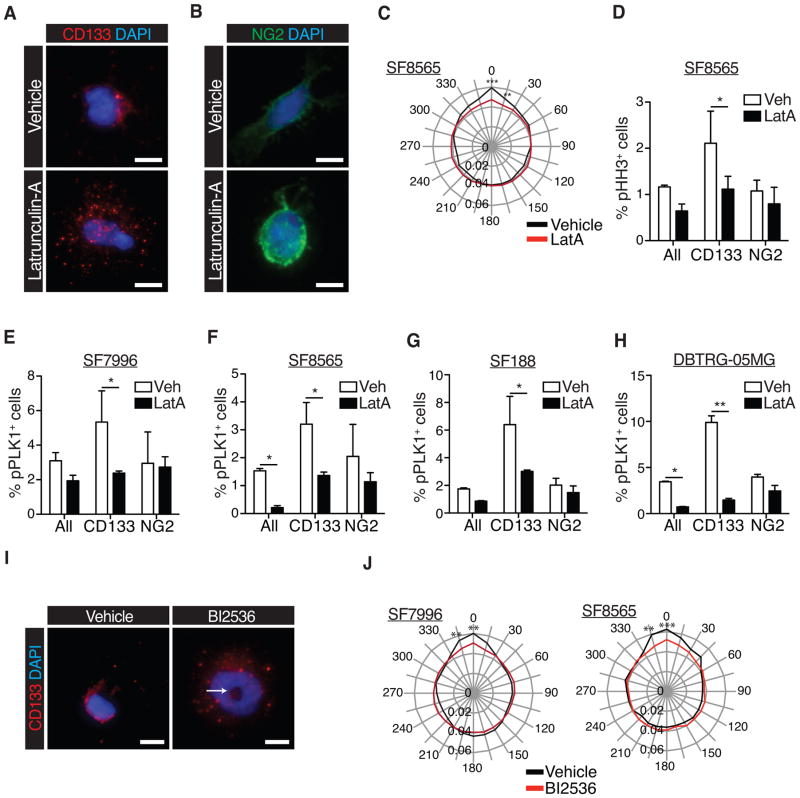
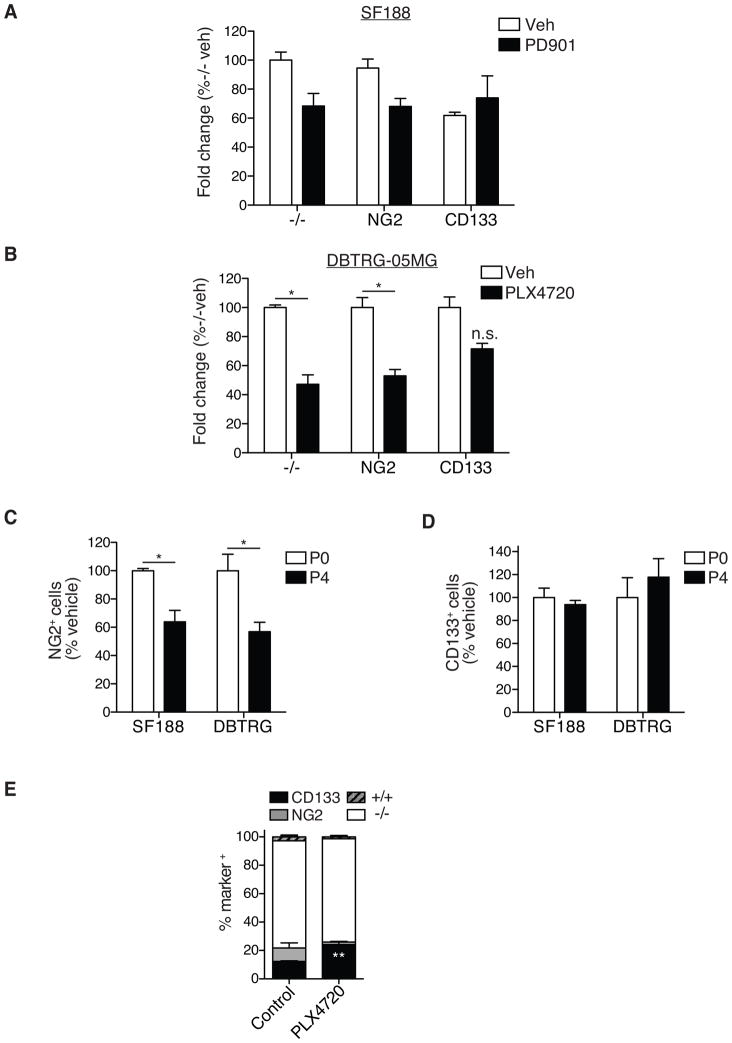
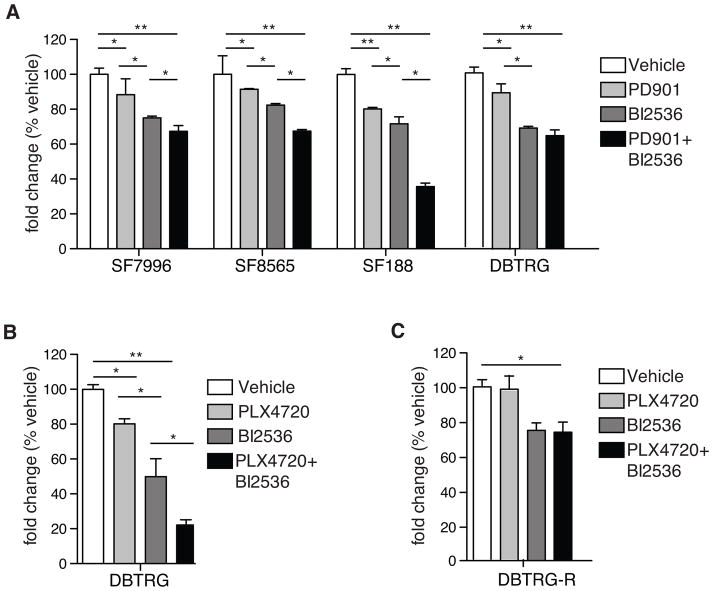
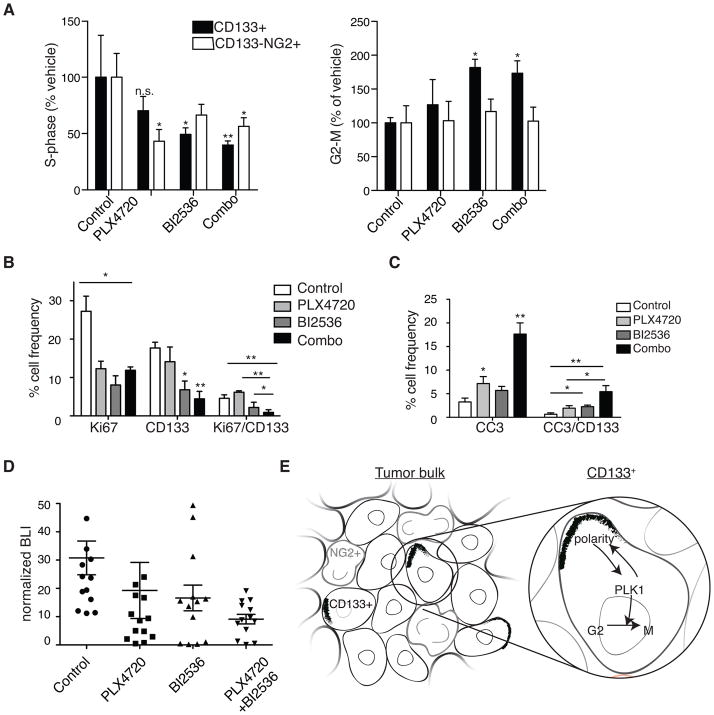
The treatment of glioblastoma (GBM) remains challenging in part due to the presence of stem-like tumor-propagating cells that are resistant to standard therapies consisting of radiation and temozolomide. Among the novel and targeted agents under evaluation for the treatment of GBM are BRAF/MAPK inhibitors, but their effects on tumor-propagating cells are unclear. Here, we characterized the behaviors of CD133(+) tumor-propagating cells isolated from primary GBM cell lines. We show that CD133(+) cells exhibited decreased sensitivity to the antiproliferative effects of BRAF/MAPK inhibition compared to CD133(-) cells. Furthermore, CD133(+) cells exhibited an extended G2-M phase and increased polarized asymmetric cell divisions. At the molecular level, we observed that polo-like kinase (PLK) 1 activity was elevated in CD133(+) cells, prompting our investigation of BRAF/PLK1 combination treatment effects in an orthotopic GBM xenograft model. Combined inhibition of BRAF and PLK1 resulted in significantly greater antiproliferative and proapoptotic effects beyond those achieved by monotherapy (P < 0.05). We propose that PLK1 activity controls a polarity checkpoint and compensates for BRAF/MAPK inhibition in CD133(+) cells, suggesting the need for concurrent PLK1 inhibition to improve antitumor activity against a therapy-resistant cell compartment.


Conflict of interest statement

The authors disclose no potential conflicts of interest

Figures

Figure 1
Figure 1. Proliferation rates and compartment overlap of CD133+ and NG2+ GBMs
(A) IF image of patient GBM specimen stained with antibodies against CD133 (green) and NG2 (red); DAPI was used to stain DNA (blue). (N=8; error bars represent SEM) Quantification of (B) CD133 and (C) NG2 co-expression with NESTIN and OLIG2. A minimum of n=77 cells were counted per tumor, for 8 specimens total. Error bars represent SEM. (D) Co-IF of a primary human GBM specimen for CD133 (red, top panels, arrow), NG2 (red, bottom panels, arrow) and the proliferative marker Ki67 (green). (E) Quantification of Ki67 expression in CD133+ and NG2+ cells of primary human GBM specimens. (N≥107 CD133+/NG2+ cells counted per tumor from each of 6 specimens; 2-tailed t-test; Error bars represent SEM. Scale bars represent 20μM.)
Figure 2
Figure 2. GBM cell cultures maintain discrete populations of CD133+ and NG2+ cells
(A) Flow cytometry plot showing CD133 and NG2 expression in SF8565 cell line. The isotype control sample is labeled in blue and antibody-stained samples are in red. (B) Quantification of frequency of CD133+NG2− (CD133), CD133−NG2+ (NG2), double-positive (+/+) and marker-negative (−/−) cells in SF8565, SF7996, SF188 and DBTRG-05MG cell lines. Error bars represent SEM. (C) Alamar Blue viability assay of FACS-enriched CD133+ and CD133−/NG2+ populations from SF7996, SF8565, SF188, and DBTRG-05MG cells. Fold changes in fluorescence after five days of growth demonstrates the lower viability of CD133+ cells compared with CD133−/NG2+ cells (n=3 individual experiments; 1-way ANOVA with Tukey post-hoc test, Error bars represent SEM; *p≤0.005; **p≤0.01).
Figure 3
Figure 3. ACD is elevated and cell cycle dynamics are different in CD133+ cells, in relation to NG2+ cells
(A) Representative image of polarized CD133 localization (red; top), unpolarized NG2 localization (green; bottom), and DAPI (blue; top and bottom), in SF8565 cells (scale bars represent 10μm). (B) Radial plot showing quantification of CD133 and NG2 polarization. Quantification was performed using the Oval Profile plugin for ImageJ and expressed as a percentage of the grey value for each cell, aligned with the maximum at 0°; values are averaged across ≥30 cells/experiment (2-way ANOVA with Bonferroni post-hoc test; *p≤0.05; **p≤0.01; ***p≤0.001; error bars represent SEM) (C) Pair assays visualizing the asymmetric distribution of CD133 (red; top panel), symmetric distribution of NG2 (green; bottom panel) and DAPI (blue; top and bottom), in SF8565 cells (scale bars represent 10μm). (D) Quantification of asymmetric division frequency of CD133+ and NG2+ cells from two different cell lines (n=4 individual experiments per cell line, ≥30 cell pairs were scored per experiment; 2-way paired t-test; error bars represent SEM; *p≤0.05). (E) Cell cycle analysis of two different GBM cell lines, stratified by expression of CD133 and NG2, and showing an increase in CD133+ cells in G2/M phase. NG2=CD133−NG2+ cells (n=3 individual experiments per cell line, 2-way ANOVA with Bonferroni post-hoc test; error bars represent SEM; **p<0.005). (F) Quantification of flow cytometry analyses to detect pHH3 in cell lines stratified by expression of CD133 and NG2 (n=2 individual experiments; 2-way ANOVA with Bonferroni post-hoc test, error bars represent SEM; *p<0.05). (G) Flow cytometry analysis to detect activated phospho-PLK1 (pT210-PLK1) in cell lines stratified by expression of CD133 and NG2. CD133+ cells show elevated levels of activated PLK1 (n=3 individual experiments; 2-way ANOVA with Bonferroni post-hoc test, error bars represent SEM; *p≤0.05; **p≤0.01). (H) Immunocytochemistry to detect phosphorylated form of PLK at T120 residue (pT210-PLK; green), CD133 (red), and DAPI staining (blue). Arrows depict enriched localization of activated PLK1 and co-localization with CD133 at the cortex (scale bar represents 10μm).
Figure 4
Figure 4. PLK1 activity controls mitotic entry and cell polarity in CD133+ cells
(A) Immunocytochemistry to detect CD133 in GBM cells treated with vehicle (DMSO) or Latrunculin-A (LatA; CD133 is in red, DAPI in blue; scale bars represent 10μm). (B) Immunocytochemistry to detect NG2 in GBM cells treated with vehicle (DMSO) or Latrunculin-A (LatA; NG2 is in green, DAPI in blue; scale bars represent 10μm). (C) Radial plot showing quantification of polarized CD133 and NG2 distribution in the SF8565 GBM cell line after treatment with vehicle or LatA (n=2 individual experiments per cell line, ≥30 cells were scored per experiment, 2-way ANOVA with Bonferroni post-hoc test; **p≤0.01; ***p≤0.001). (D) Flow cytometry analyses quantifying the frequency of pHH3+, mitotic cells in a primary GBM cell line. CD133= CD133+NG2− cells, NG2+=CD133−NG2+ cells (n=3 individual experiments per cell line; 2-way ANOVA with Bonferroni post-hoc test; error bars represent SEM). (E–H) Flow cytometry analyses quantifying the frequency of pT210-PLK1+ cells (%pPLK1+ cells) in four different cell lines, following treatment with LatA (n=4 individual experiments per cell line; 2-way ANOVA with Bonferroni post-hoc test; error bars represent SEM). (*p≤0.05 in C–H) (I) Immunocytochemistry for CD133 (red) and DAPI staining (blue) in GBM cells treated with Vehicle or 1nM BI2536 for 2hrs. Arrow depicts the typical polo arrest phenotype. (J) Quantification of CD133 and NG2 polarization in vehicle and BI2536–treated (1nM, 2h) GBM cell lines (n=2 individual experiments per cell line, ≥30 cells scored per experiment; 2-way ANOVA with Bonferroni post-hoc test; **p≤0.01; ***p≤0.001).
Figure 5
Figure 5. Decreased sensitivity of CD133+ subpopulations to MAPK pathway inhibition
Alamar Blue viability assay using FACS-enriched CD133+, NG2+ and marker-negative (−/−) cells from SF188 GBM cell lines (A) treated for 5 consecutive days with 0.5μM PD901 (MAPK inhibitor) and vehicle (VEH) (B) DBTRG-05MG treated for 5 consecutive days with 1μM PLX4720 and vehicle (VEH) (n=3 individual experiments per cell line; 2-way ANOVA with Bonferroni post-hoc test; error bars represent SEM). Flow cytometry analyses of (C) CD133−NG2+ (NG2) and (D) CD133+NG2− (CD133) cell frequency in SF188 and DBTRG-05MG GBM cell lines following treatment with 0.5μM PD901 (SF188) or 1μM PLX4720 (DBTRG-05MG) for four passages (P0=passage 0; P4= passage 4; n=2 individual experiments per cell line, 1-way ANOVA with Tukey post-hoc test; error bars represent SEM; *p≤0.05 in B and C). (E) Flow cytometry analyses of CD133+ and CD133−NG2+ (NG2) cell frequency in subcutaneous DBTRG-05MG xenografts; established tumors were transplanted into new hosts on average every 6 weeks and received 186-days of continuous treatment with vehicle or PLX4720 (10mg/kg/day). (N=4 individual tumor specimen; 2-way ANOVA with Bonferroni post-hoc test; error bars represent SEM; **p≤0.01).
Figure 6
Figure 6. Targeting PLK1 in combination with BRAF/MAPK inhibition reduces GBM cell viability
(A) Alamar Blue viability assay of four GBM cell lines treated with vehicle (VEH), 1μM PD901, 5nM BI2536, or a combination of PD901 and BI2536 for five days (n=4 individual experiments/cell line; error bars represent SEM). (B) Growth assay of DBTRG-05MG cells treated with vehicle, PLX4720, BI2536 or a combination of PLX4720 and BI2536 (n=3 individual experiments/cell line; 1-way ANOVA with Tukey post-hoc tests for A and B; error bars represent SEM). (C) Growth assay of DBTRG-05MG cells pre-treated with an escalating dosage of PLX4720, treated with vehicle, PLX4720, BI2536 or a combination of PLX4720 and BI2536 (n=3 individual experiments/cell line; 1-way ANOVA with Tukey post-hoc tests for A and B; error bars represent SEM). *P≤0.05; **p≤0.01 in A, B.
Figure 7
Figure 7. Effect of combined inhibition of BRAFV600E and PLK1 on CD133+ cells and tumor growth in vivo
(A) Ex vivo flow cytometry analyses of subcutaneous DBTRG xenografts treated for five days with PLX4720 daily at 20mg/kg, BI2536 twice at 50mg/kg or a combination of both inhibitors (Combo). Dissociated tumor cells were analyzed for incorporation of EdU (S-phase) or G2/M following an EdU pulse 30 min before tumors were harvested. (N=5 individual experiments; 2-way ANOVA with Bonferroni post-hoc test, values compared to vehicle treated conditions for each cell type.) (B) Quantification of Ki67+, CD133+ and CD133+Ki67+ double positive cells by IF performed on intracranial xenograft tumor samples of treated mice. (N ≥ 3 individual tumors from each treatment group; a minimum of three sections for each treatment group were counted.) (C) Quantification of cleaved caspase 3 (CC3)+, CD133+ and CD133+CC3+ double-positive cells by IF performed on intracranial xenograft tumor samples of treated mice. (N ≥ 3 individual tumors from each treatment group; a minimum of three sections for each treatment group were counted) *P≤0.05; **p≤0.005 in A–C. (D) Normalized bioluminescence (BLI) readings from intracranial DBTRG-05MG tumors at 7–9 days post-treatment initiation. Mice were either untreated (control) or treated with either daily PLX4720 at 20mg/kg, twice-weekly BI2536 at 50mg/kg, or a combination (n=12–13 animals per treatment group, 1-way ANOVA with Tukey post-hoc test). (E) Model for a PLK1 inhibitor-sensitive polarity checkpoint in a heterogeneous GBM tumor where CD133+ cells co-exist with CD133−NG2+ (NG2+) cells. NG2+ cells are outlined in grey; polarized CD133 are black crescents.

Similar articles

Cited by

References

    1. Weller M, van den Bent M, Hopkins K, Tonn JC, Stupp R, Falini A, et al. EANO guideline for the diagnosis and treatment of anaplastic gliomas and glioblastoma. Lancet Oncol. 2014 - PubMed
    1. Brennan C, Momota H, Hambardzumyan D, Ozawa T, Tandon A, Pedraza A, et al. Glioblastoma subclasses can be defined by activity among signal transduction pathways and associated genomic alterations. PLoS One. 2009;4:e7752. - PMC - PubMed
    1. Verhaak RGW, Hoadley KA, Purdom E, Wang V, Qi Y, Wilkerson MD, et al. Integrated Genomic Analysis Identifies Clinically Relevant Subtypes of Glioblastoma Characterized by Abnormalities in PDGFRA, IDH1, EGFR, and NF1. Cancer Cell. 2010;17:98–110. - PMC - PubMed
    1. Patel AP, Tirosh I, Trombetta JJ, Shalek AK, Gillespie SM, Wakimoto H, et al. Single-cell RNA-seq highlights intratumoral heterogeneity in primary glioblastoma. Science. 2014;344:1396–1401. - PMC - PubMed
    1. Snuderl M, Fazlollahi L, Le LP, Nitta M, Zhelyazkova BH, Davidson CJ, et al. Mosaic amplification of multiple receptor tyrosine kinase genes in glioblastoma. Cancer Cell Elsevier Inc. 2011;20:810–7. - PubMed

Publication types

MeSH terms