. 2016 Jul;27(7):2035-48.
doi: 10.1681/ASN.2014121200. Epub 2015 Nov 16.

Defective Store-Operated Calcium Entry Causes Partial Nephrogenic Diabetes Insipidus

Affiliations

Defective Store-Operated Calcium Entry Causes Partial Nephrogenic Diabetes Insipidus

Mykola Mamenko et al. J Am Soc Nephrol. 2016 Jul.

Abstract

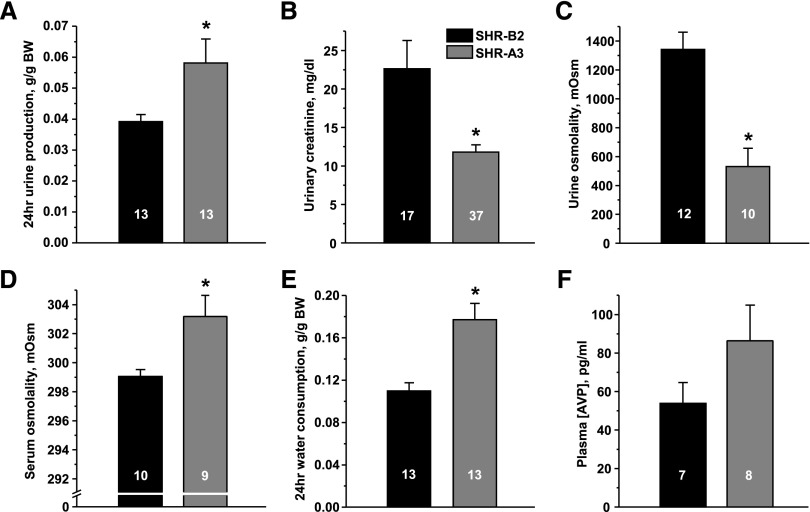
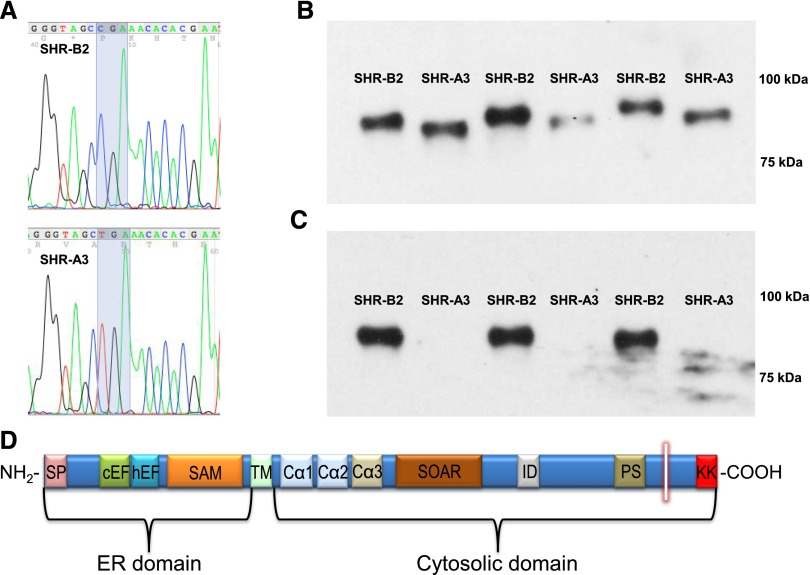
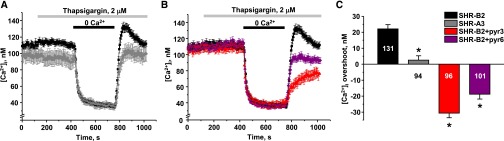
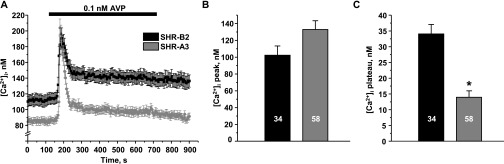
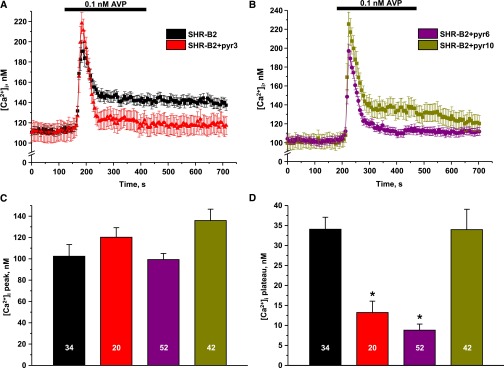
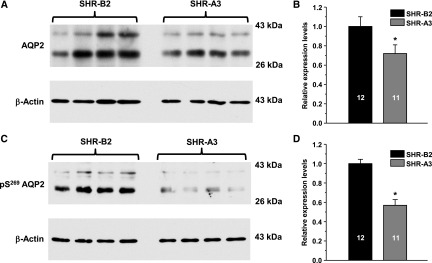
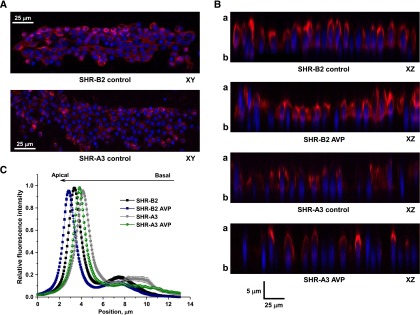
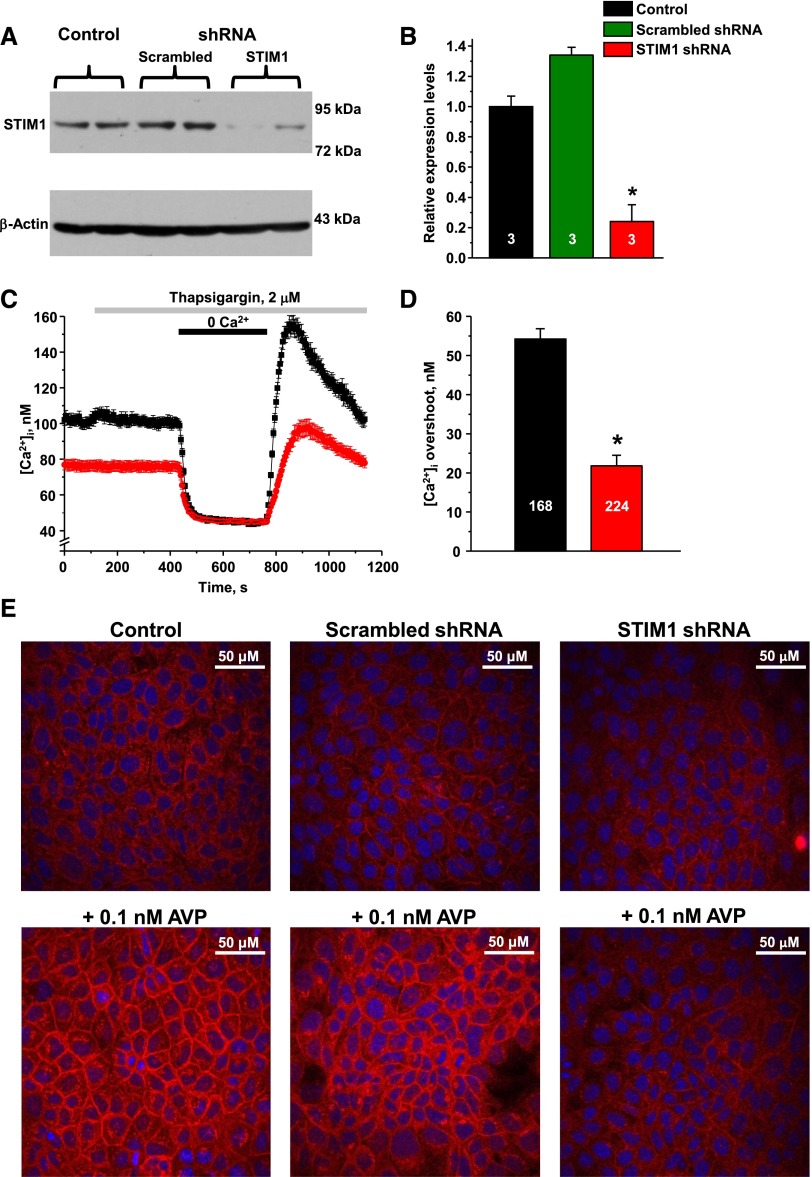
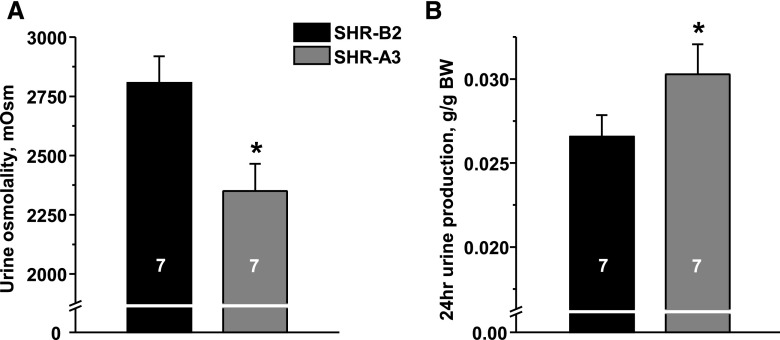
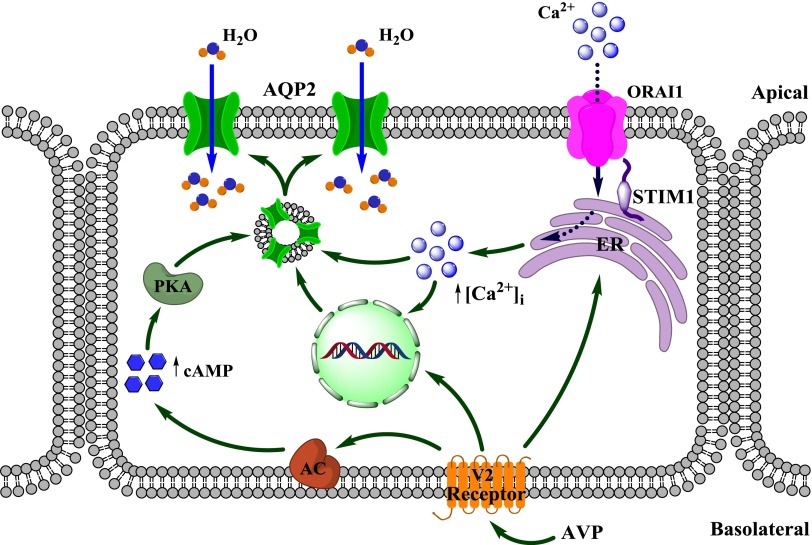
Store-operated calcium entry (SOCE) is the mechanism by which extracellular signals elicit prolonged intracellular calcium elevation to drive changes in fundamental cellular processes. Here, we investigated the role of SOCE in the regulation of renal water reabsorption, using the inbred rat strain SHR-A3 as an animal model with disrupted SOCE. We found that SHR-A3, but not SHR-B2, have a novel truncating mutation in the gene encoding stromal interaction molecule 1 (STIM1), the endoplasmic reticulum calcium (Ca(2+)) sensor that triggers SOCE. Balance studies revealed increased urine volume, hypertonic plasma, polydipsia, and impaired urinary concentrating ability accompanied by elevated circulating arginine vasopressin (AVP) levels in SHR-A3 compared with SHR-B2. Isolated, split-open collecting ducts (CD) from SHR-A3 displayed decreased basal intracellular Ca(2+) levels and a major defect in SOCE. Consequently, AVP failed to induce the sustained intracellular Ca(2+) mobilization that requires SOCE in CD cells from SHR-A3. This effect decreased the abundance of aquaporin 2 and enhanced its intracellular retention, suggesting impaired sensitivity of the CD to AVP in SHR-A3. Stim1 knockdown in cultured mpkCCDc14 cells reduced SOCE and basal intracellular Ca(2+) levels and prevented AVP-induced translocation of aquaporin 2, further suggesting the effects in SHR-A3 result from the expression of truncated STIM1. Overall, these results identify a novel mechanism of nephrogenic diabetes insipidus and uncover a role of SOCE in renal water handling.

Keywords: calcium; collecting ducts; diabetes insipidus; vasopressin; water transport.


Figures

Figure 1.
Figure 1.
Truncation of STIM1 results in abnormal systemic water homeostasis. (A) Summary graph showing average 24-hour urine production in SHR-B2 (black) and SHR-A3 (gray). (B) Summary graph comparing U[creat] in SHR-B2 and SHR-A3. (C) Summary graph demonstrating averaged urine osmolality in SHR-B2 and SHR-A3. (D) Summary graph showing serum osmolality in SHR-B2 and SHR-A3. (E) Summary graph comparing water consumption by SHR-A3 and SHR-B2 within a 24-hour interval. (F) Summary graph showing averaged AVP levels in plasma samples taken from SHR-A3 and SHR-B2. *P<0.05 versus SHR-B2, estimated with one-way ANOVA test. The number of animals in each group is indicated on top of the respective bars.
Figure 2.
Figure 2.
A novel nonsense mutation of Stim1 gene truncates C-terminal domain of STIM1 protein. (A) Targeted resequencing to verify next-generation sequence variant in Stim1. SHR-B2 possesses the wild-type codon 640 encoding Arg, in SHR-A3 the cytosine residue is mutated to thymidine creating a stop codon. (B) Western blot using N-terminal–directed antibodies (antigen includes human STIM1 residues 61–74) detects STIM1 protein in both SHR-A3 and SHR-B2. (C) Western blot using C-terminal–directed antibodies (antigen includes human STIM1 residues 657–683) detects STIM1 protein in SHR-B2 but not in SHR-A3. (D) Domain structure of STIM1. A short transmembrane spans the ER membrane. The ER resident portion contains two EF hand domains including a Ca2+-binding canonical cEF domain and a non-Ca2+–binding hidden domain (hEF) and a sterile α-motif (SAM). The cytosolic domain contains coiled-coil regions with the CC1 region divided into Ca1, Ca2, and Ca3. Ca2 and Ca3 comprise part of the STIM1-ORAI (SOAR) activating region. An acidic inhibitory domain (ID) mediates calcium-dependent ORAI1 inactivation. A Pro/Ser-rich domain (PS) is followed by a poly-basic lysine-rich C-terminus (KK). The stop codon created in SHR-A3 terminates the STIM1 protein between the PS and KK domains (shown by the vertical white bar). The C-terminal polybasic region may serve in spatial coordination between STIM1 anchored in the ER membrane and ORAI1 in the plasma membrane. The KK domain has also been proposed to serve as a gating region of STIM1 controlling TRPC channel activation (see Discussion).
Figure 3.
Figure 3.
Defect in STIM1 or inhibition of ORAI1 disrupts SOCE in CD cells. (A) The average time courses of [Ca2+]i changes in response to Ca2+ removal–Ca2+ readdition protocol upon depletion of [Ca2+]i stores with thapsigargin recorded in CD cells from SHR-B2 (black) and SHR-A3 (gray). (B) The average time courses of [Ca2+]i changes in response to Ca2+ removal–Ca2+ readdition protocol upon depletion of [Ca2+]i stores with thapsigargin recorded in CD cells from SHR-B2 in control (black, reproduced from A), on the background of nonspecific TRPC3/ORAI1 inhibitor pyr3 (6 μM, shown in red) and specific ORAI1 inhibitor pyr6 (5 μM, shown in purple). (C) Summary graph comparing average magnitudes of [Ca2+]i overshoots observed in SHR-B2 in control, SHR-A3, SHR-B2 treated with pyr3 and pyr6. *P<0.05 versus [Ca2+]i overshoot in SHR-B2, estimated with one-way ANOVA test. The number of cells in each group is indicated on top of the respective bars. At least six CDs from three different animals were used for each treatment.
Figure 4.
Figure 4.
The sustained phase of AVP-activated [Ca2+]i response is significantly impaired in CD cells with defective STIM1. (A) The average time courses of [Ca2+]i responses to application of 0.1 nM AVP (shown with a black bar on top) recorded in CD cells from SHR-B2 (black) and SHR-A3 (gray). (B,C) Summary graphs comparing the average magnitudes of (B) transient and (C) sustained phases of AVP-induced response in SHR-B2 and SHR-A3. *P<0.05 versus [Ca2+]i plateau in SHR-B2, estimated with one-way ANOVA test. The number of cells in each group is indicated on top of the respective bars. At least six CDs from three different experimental animals were used for each treatment.
Figure 5.
Figure 5.
Ca2+ entry via ORAI1 channel sustains AVP-induced [Ca2+]i response in CD cells. (A) The average time course of [Ca2+]i elevation after application of AVP (shown with a black bar) in CD cells from SHR-B2 in control (shown in black) and on the background of nonspecific TRPC3/ORAI1 channel inhibitor pyr3 (6 μM, shown in red). (B) The average time course of [Ca2+]i responses to AVP in CD cells from SHR-B2 on the background of selective TRPC3 inhibitor pyr10 (5 μM, shown in dark yellow), and ORAI1 inhibitor pyr6 (5 μM, shown in purple). Summary graphs comparing the average magnitudes of (C) transient and (D) sustained phases of AVP-induced responses recorded in CD cells from SHR-B2 in control and upon treatment with pyr3, pyr6, and pyr10. CDs were preincubated with TRPC3/ORAI1 inhibitors for 5 minutes before AVP application. *P<0.05 versus [Ca2+]i plateau in SHR-B2, estimated with one-way ANOVA test. The number of cells in each group is indicated on top of the respective bars. At least six CDs from three different rats were tested for each treatment.
Figure 6.
Figure 6.
Compromised SOCE markedly diminishes AQP2 abundance in the kidney. (A) Representative Western blot from whole-kidney lysates of SHR-B2 and SHR-A3 probed with anti-AQP2 and anti-actin antibodies. AQP2 is present as a duplet of the upper glycosylated (approximately 37 kDa) and lower nonglycosylated (approximately 29 kDa) bands. (B) Summary graph comparing total renal AQP2 expression (both glycosylated and nonglycosylated forms) in SHR-B2 (black) and SHR-A3 (gray) from Western blots similar to that shown in (A). (C) Representative Western blot from whole-kidney lysates of SHR-B2 and SHR-A3 probed with anti–phospho-Ser269 AQP2 (retained in the plasma membrane) and anti-actin antibodies. (D) Summary graph comparing renal expression of phospho-Ser269 AQP2 (both glycosylated and nonglycosylated forms) in SHR-B2 (black) and SHR-A3 (gray) from Western blots similar to that shown in (C). Samples were run in duplicates. Intensities of AQP2-reporting bands were normalized to the intensities of the respective actin bands. *P<0.05 versus SHR-B2, estimated with one-way ANOVA test. The number of animals in each group is indicated on top of the respective bars.
Figure 7.
Figure 7.
CD cells with impaired SOCE have a drastically reduced sensitivity to AVP. (A) Representative confocal plane micrographs of split-opened CDs from SHR-B2 and SHR-A3 showing AQP2 localization (pseudocolor red). Nuclear staining with 4′,6-diamidino-2-phenylindole is shown in pseudocolor blue. (B) Representative micrographs of XZ planes reconstructed from three-dimensional stacks of confocal images, visualizing AQP2 distribution along apical-basal axis in SHR-B2 and SHRA3 in control and after treatment with AVP. (C) The distribution of averaged relative fluorescent signals representing AQP2 localization along Z-axis in CD cells from SHR-B2 and SHR-A3 in control and after treatment with AVP. For each individual cell, the fluorescent signal was normalized to its corresponding maximal value. Position of the apical and basal sides is shown with “a” and “b,” respectively. At least six CDs from three different rats were used to obtain statistics for any given treatment.
Figure 8.
Figure 8.
Stim1 knockdown interferes with AVP-induced AQP2 trafficking in mpkCCDc14 cells. (A) Representative Western blot from mpkCCDc14 cell lysates probed with anti-STIM1 and anti-β-actin antibodies in the control, upon stable transfection with scrambled shRNA, and shRNA targeting Stim1, respectively. (B) Summary graph comparing total STIM1 expression from Western blots similar to that shown in (A). (C) The average time courses of [Ca2+]i changes in response to Ca2+ removal–Ca2+ readdition protocol upon depletion of [Ca2+]i stores with thapsigargin recorded in nontransfected controls (black) and cells transfected with shRNA targeting Stim1 (red). (D) Summary graph comparing average magnitudes of [Ca2+]i overshoots observed in nontransfected controls (black) and cells transfected with Stim1-targeting shRNA (red). (E) Representative micrographs of confocal planes monitoring AQP2 (pseudocolor red) distribution in control (upper row) and after 30 minutes of treatment with AVP (bottom row) for nontransfected control (left column), transfected with scrambled shRNA (central column), and shRNA targeting Stim1 (right column), respectively. Nuclear staining with 4′,6-diamidino-2-phenylindole is shown in pseudocolor blue. *P<0.05 versus control, estimated with one-way ANOVA test. The number of samples/cells in each group is indicated on top of the respective bars. At least three different culture plates were used for each treatment.
Figure 9.
Figure 9.
STIM1 truncation impairs urinary concentrating ability. Summary graphs comparing averaged (A) urine osmolality and (B) volume in SHR-B2 (black) and SHR-A3 (gray), which were deprived of water for 24 hours. *P<0.05 versus SHR-B2, estimated with one-way ANOVA test. The number of animals in each group is indicated on top of the respective bars.
Figure 10.
Figure 10.
AVP-induced signal transduction in the CD. AVP stimulates the expression and apical translocation of AQP2 in CD cells via cAMP- and Ca2+-dependent pathways. Ca2+ release from ER cannot maintain a prolonged [Ca2+]i mobilization required for an adequate response of CD cells to AVP. The Ca2+ necessary to sustain cellular response to AVP is provided by means of SOCE via ORAI1 channel. AC, adenylate cyclase.

Comment in

References

    1. Moeller HB, Fenton RA: Cell biology of vasopressin-regulated aquaporin-2 trafficking. Pflugers Arch 464: 133–144, 2012 - PubMed
    1. Robertson GL: Physiology of ADH secretion. Kidney Int Suppl 21: S20–S26, 1987 - PubMed
    1. Nielsen S, Frøkiaer J, Marples D, Kwon TH, Agre P, Knepper MA: Aquaporins in the kidney: from molecules to medicine. Physiol Rev 82: 205–244, 2002 - PubMed
    1. Staruschenko A: Regulation of transport in the connecting tubule and cortical collecting duct. Compr Physiol 2: 1541–1584, 2012 - PMC - PubMed
    1. Wilson JL, Miranda CA, Knepper MA: Vasopressin and the regulation of aquaporin-2. Clin Exp Nephrol 17: 751–764, 2013 - PMC - PubMed

Publication types

LinkOut - more resources