

Acetazolamide Attenuates Lithium-Induced Nephrogenic Diabetes Insipidus
- PMID: 26574046
- PMCID: PMC4926986
- DOI: 10.1681/ASN.2015070796
Acetazolamide Attenuates Lithium-Induced Nephrogenic Diabetes Insipidus
Abstract
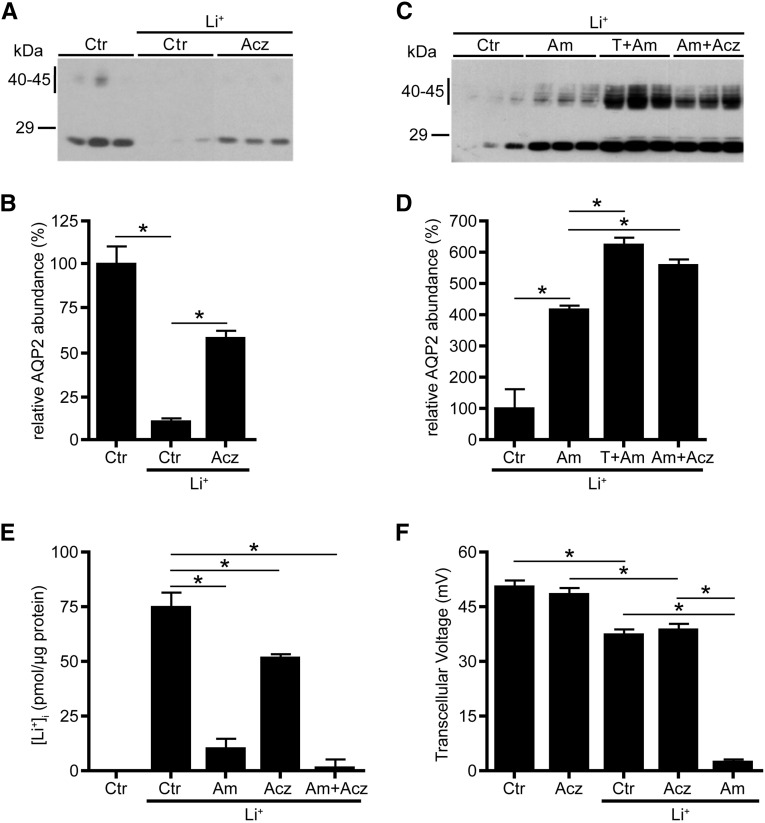
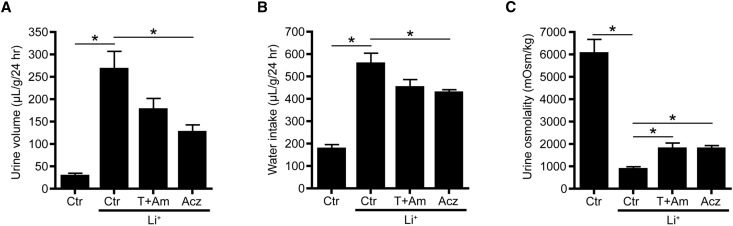
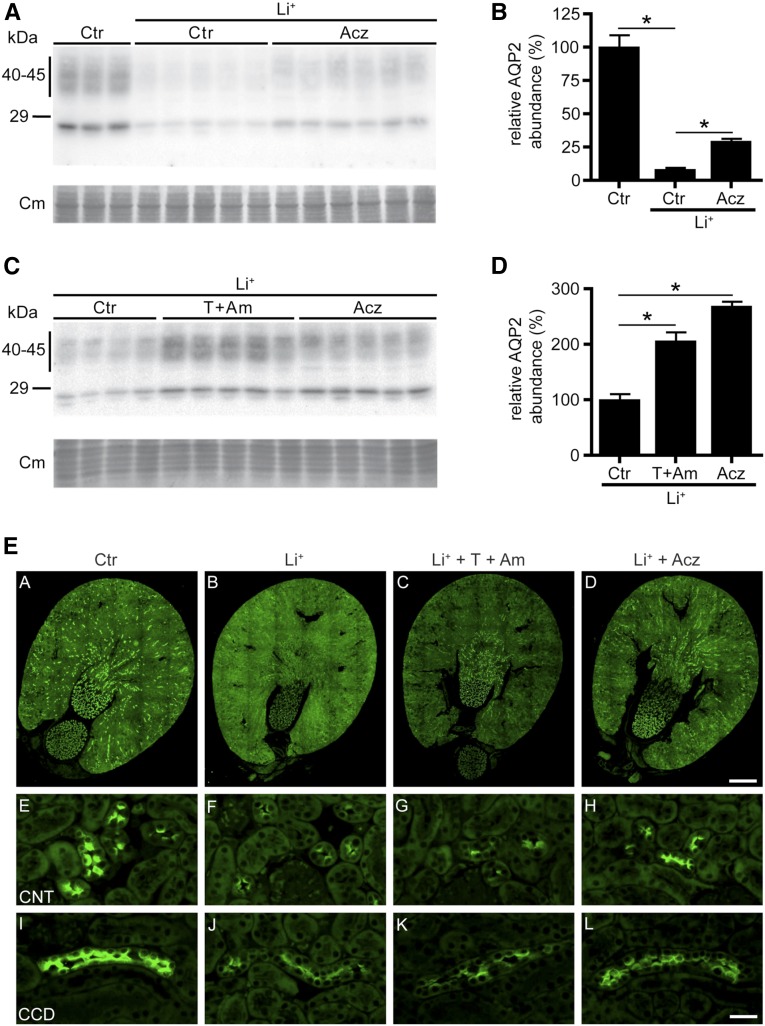
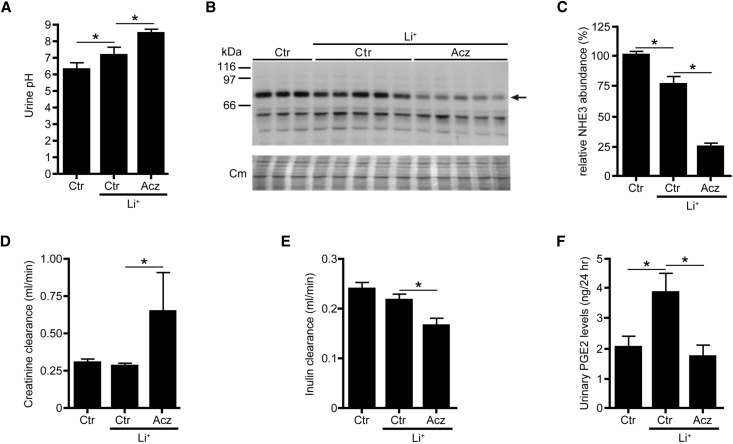
To reduce lithium-induced nephrogenic diabetes insipidus (lithium-NDI), patients with bipolar disorder are treated with thiazide and amiloride, which are thought to induce antidiuresis by a compensatory increase in prourine uptake in proximal tubules. However, thiazides induced antidiuresis and alkalinized the urine in lithium-NDI mice lacking the sodium-chloride cotransporter, suggesting that inhibition of carbonic anhydrases (CAs) confers the beneficial thiazide effect. Therefore, we tested the effect of the CA-specific blocker acetazolamide in lithium-NDI. In collecting duct (mpkCCD) cells, acetazolamide reduced the cellular lithium content and attenuated lithium-induced downregulation of aquaporin-2 through a mechanism different from that of amiloride. Treatment of lithium-NDI mice with acetazolamide or thiazide/amiloride induced similar antidiuresis and increased urine osmolality and aquaporin-2 abundance. Thiazide/amiloride-treated mice showed hyponatremia, hyperkalemia, hypercalcemia, metabolic acidosis, and increased serum lithium concentrations, adverse effects previously observed in patients but not in acetazolamide-treated mice in this study. Furthermore, acetazolamide treatment reduced inulin clearance and cortical expression of sodium/hydrogen exchanger 3 and attenuated the increased expression of urinary PGE2 observed in lithium-NDI mice. These results show that the antidiuresis with acetazolamide was partially caused by a tubular-glomerular feedback response and reduced GFR. The tubular-glomerular feedback response and/or direct effect on collecting duct principal or intercalated cells may underlie the reduced urinary PGE2 levels with acetazolamide, thereby contributing to the attenuation of lithium-NDI. In conclusion, CA activity contributes to lithium-NDI development, and acetazolamide attenuates lithium-NDI development in mice similar to thiazide/amiloride but with fewer adverse effects.
Keywords: cell and transport physiology; diabetes insipidus; diuretics; osmolality; pathophysiology of renal disease and progression; water transport.
Copyright © 2016 by the American Society of Nephrology.
Figures
Comment in
-
Water, Water Everywhere: A New Cause and a New Treatment for Nephrogenic Diabetes Insipidus.J Am Soc Nephrol. 2016 Jul;27(7):1872-4. doi: 10.1681/ASN.2015111223. Epub 2015 Dec 28. J Am Soc Nephrol. 2016. PMID: 26712528 Free PMC article. No abstract available.
References
-
- Grünfeld JP, Rossier BC: Lithium nephrotoxicity revisited. Nat Rev Nephrol 5: 270–276, 2009 - PubMed
-
- Walker RJ, Weggery S, Bedford JJ, McDonald FJ, Ellis G, Leader JP: Lithium-induced reduction in urinary concentrating ability and urinary aquaporin 2 (AQP2) excretion in healthy volunteers. Kidney Int 67: 291–294, 2005 - PubMed
-
- Rej S, Herrmann N, Shulman K: The effects of lithium on renal function in older adults--a systematic review. J Geriatr Psychiatry Neurol 25: 51–61, 2012 - PubMed
-
- Farres MT, Ronco P, Saadoun D, Remy P, Vincent F, Khalil A, Le Blanche AF: Chronic lithium nephropathy: MR imaging for diagnosis. Radiology 229: 570–574, 2003 - PubMed
-
- Laursen UH, Pihakaski-Maunsbach K, Kwon TH, Østergaard Jensen E, Nielsen S, Maunsbach AB: Changes of rat kidney AQP2 and Na,K-ATPase mRNA expression in lithium-induced nephrogenic diabetes insipidus. Nephron, Exp Nephrol 97: e1–e16, 2004 - PubMed
Publication types
MeSH terms
Substances
LinkOut - more resources
Full Text Sources
