. 2015 Dec 8;54(48):7098-109.
doi: 10.1021/acs.biochem.5b00994. Epub 2015 Nov 25.

H-NOX from Clostridium botulinum, like H-NOX from Thermoanaerobacter tengcongensis, Binds Oxygen but with a Less Stable Oxyferrous Heme Intermediate

Affiliations

H-NOX from Clostridium botulinum, like H-NOX from Thermoanaerobacter tengcongensis, Binds Oxygen but with a Less Stable Oxyferrous Heme Intermediate

Gang Wu et al. Biochemistry. .

Abstract

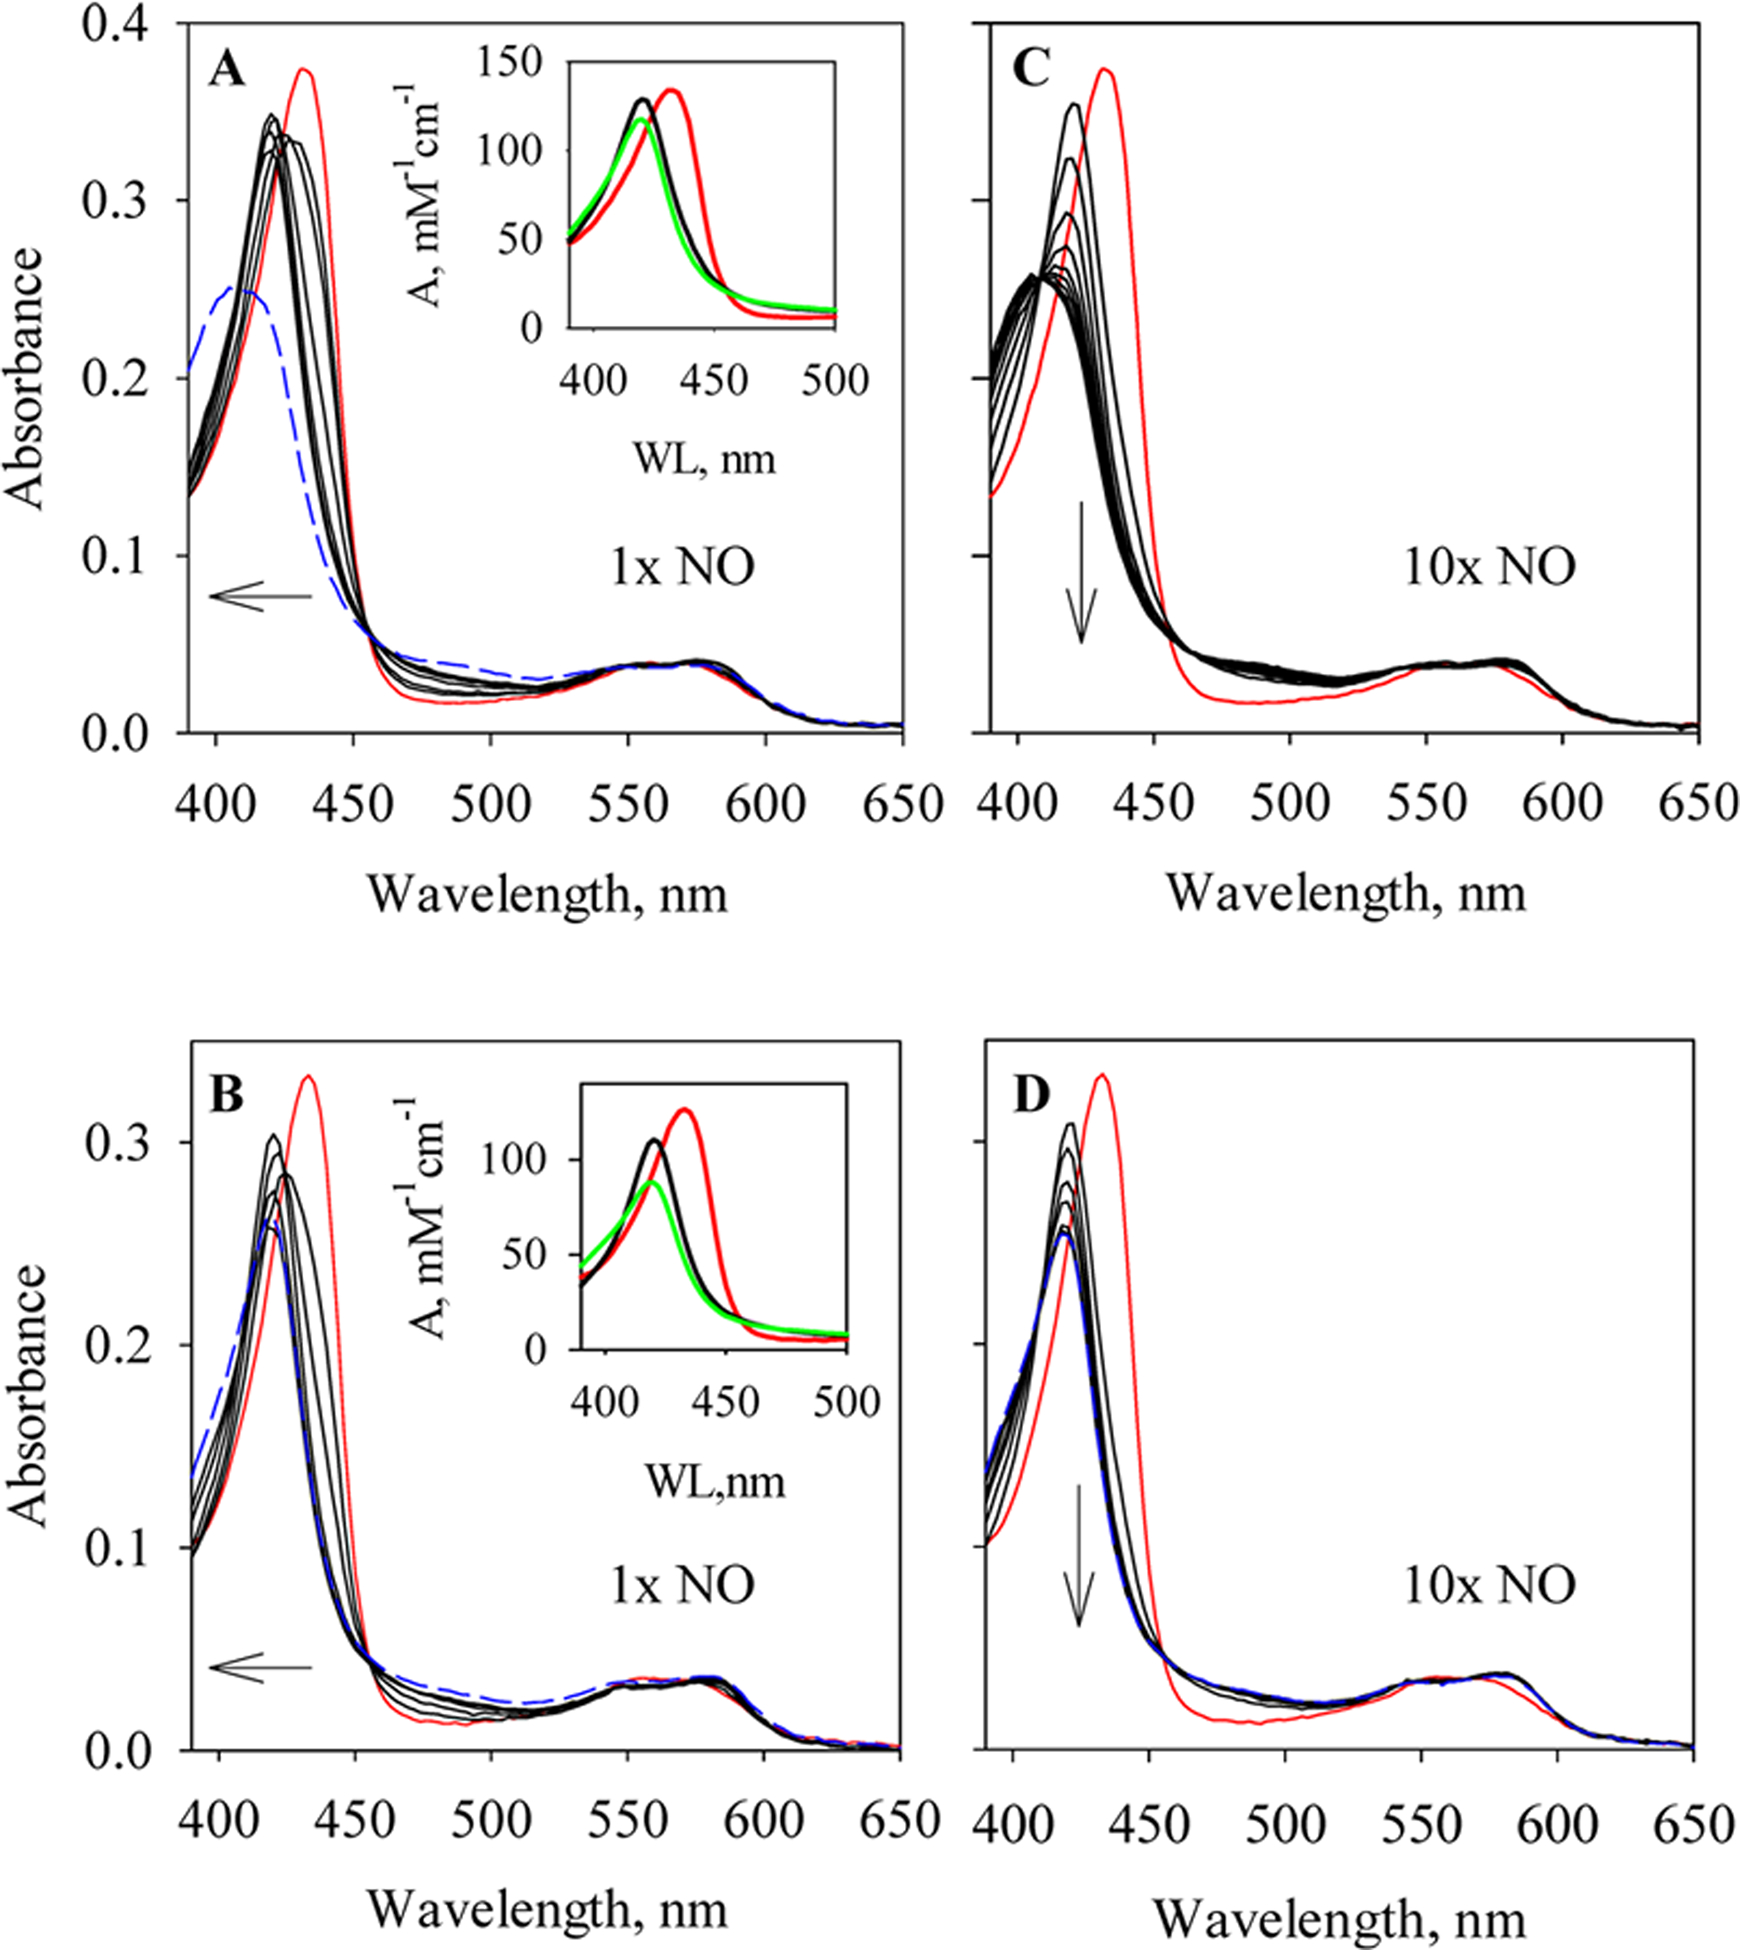
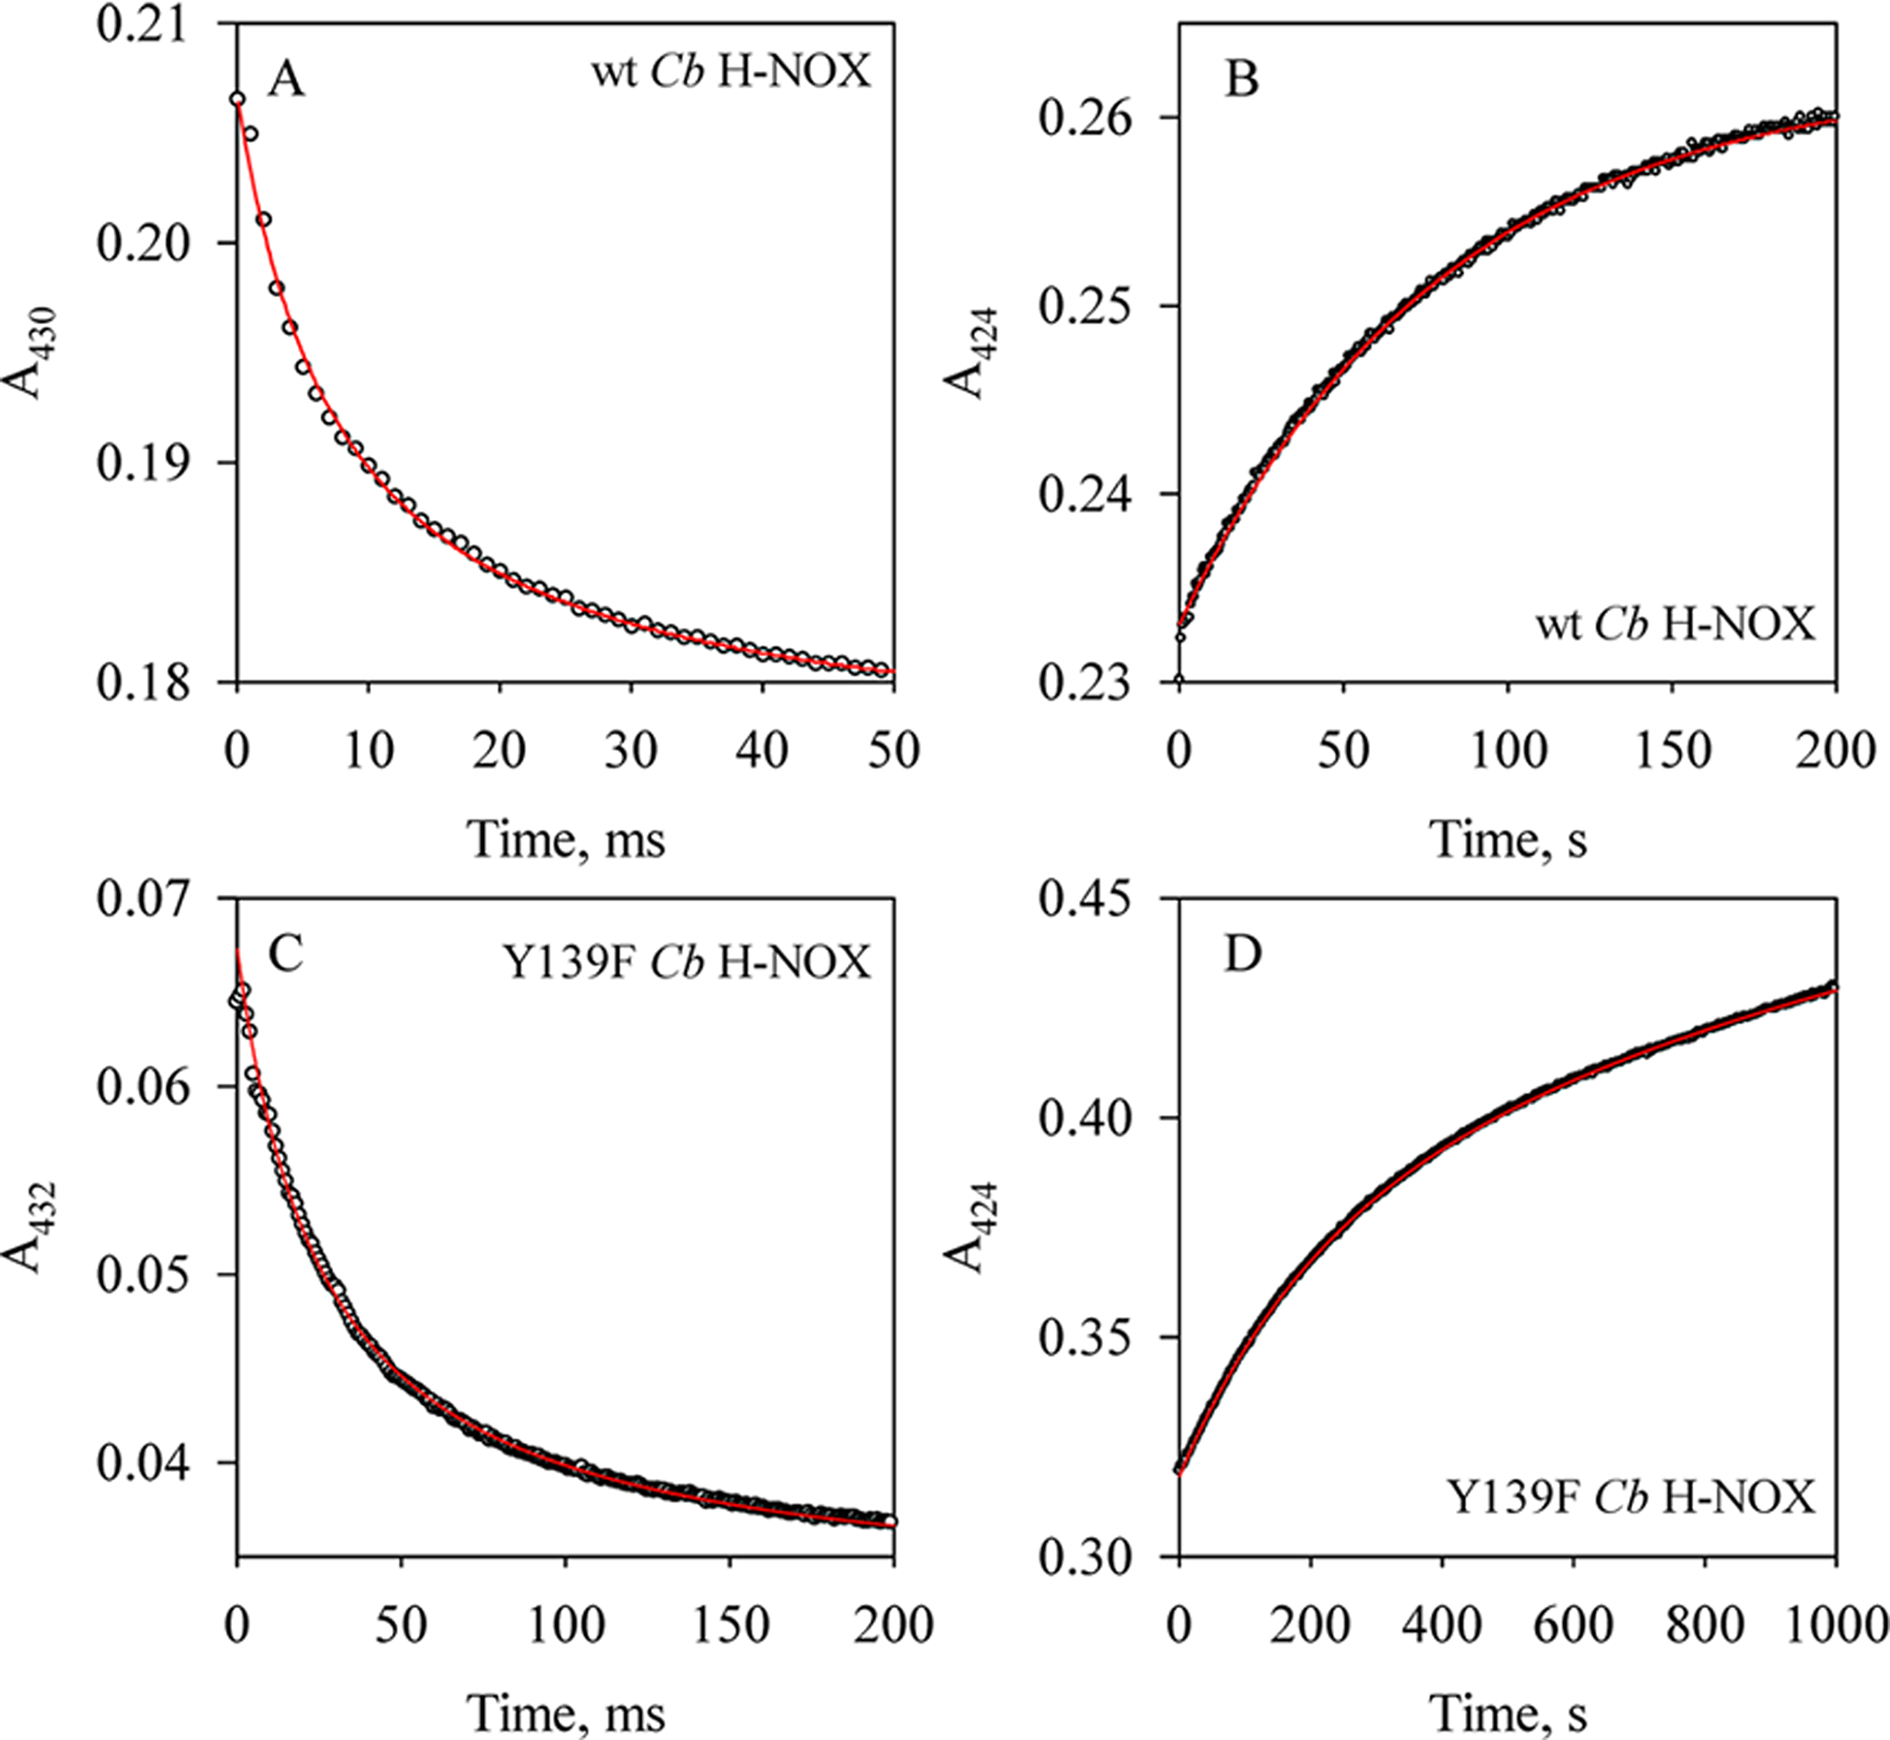
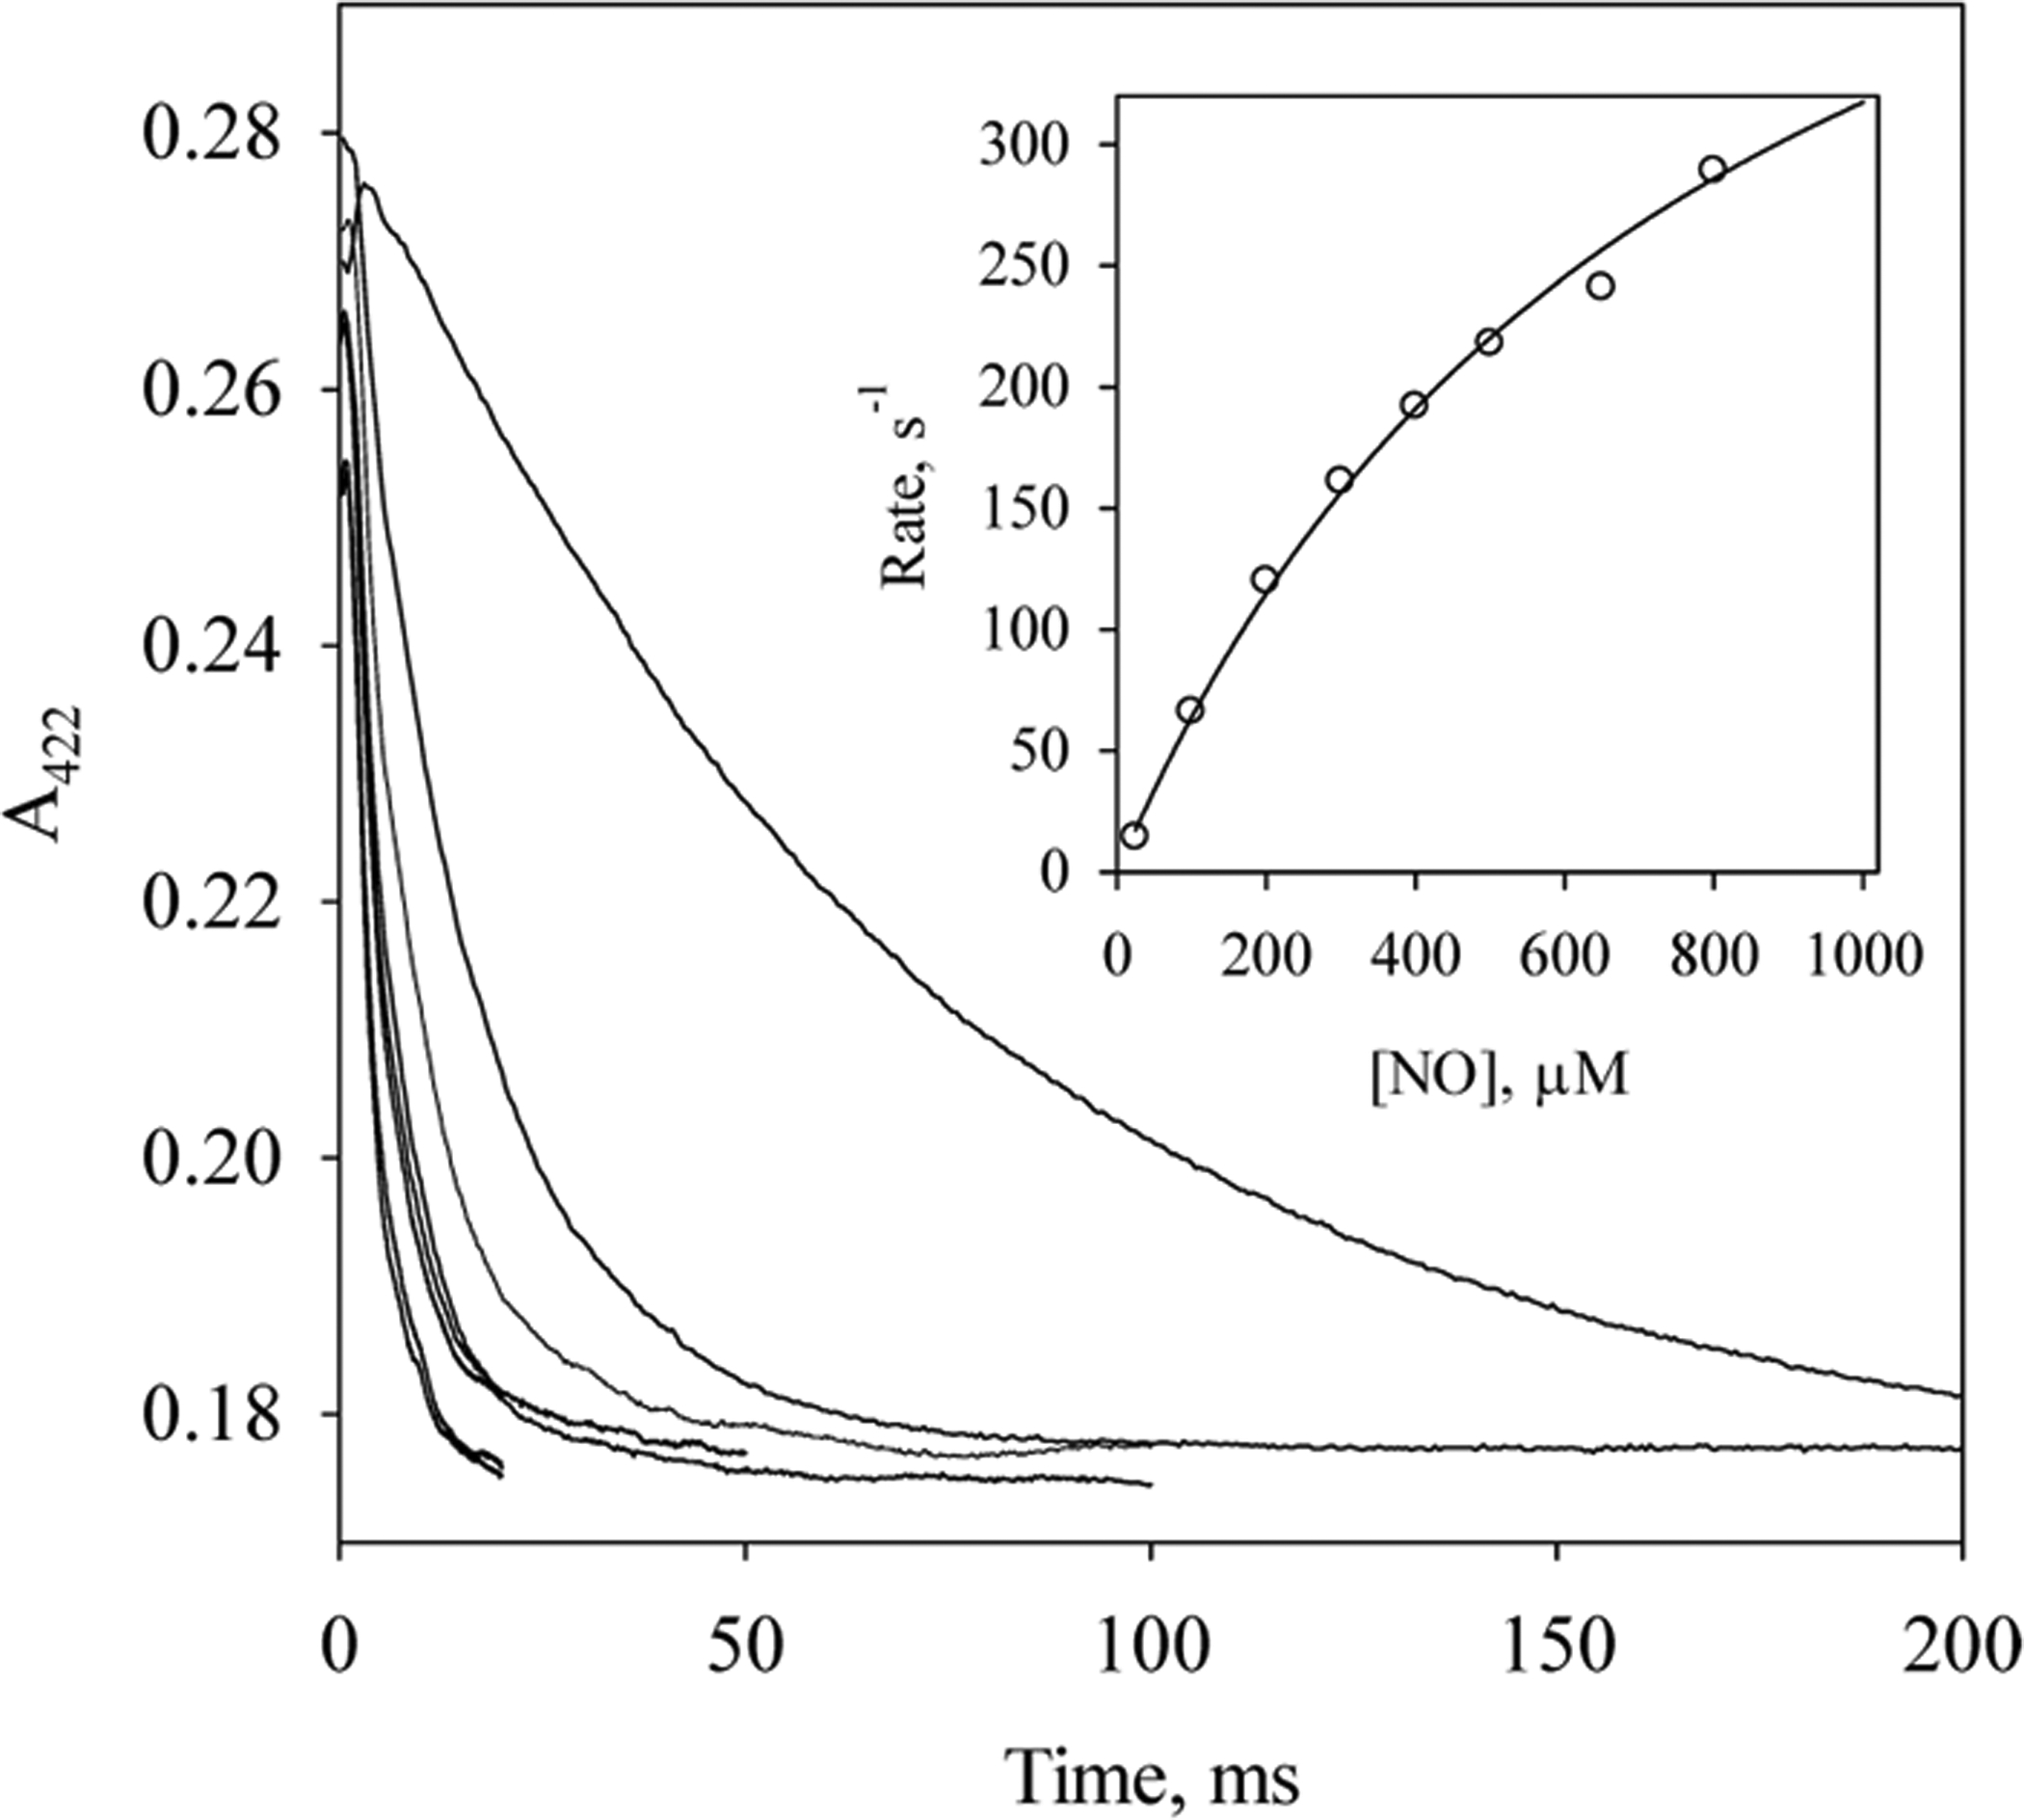
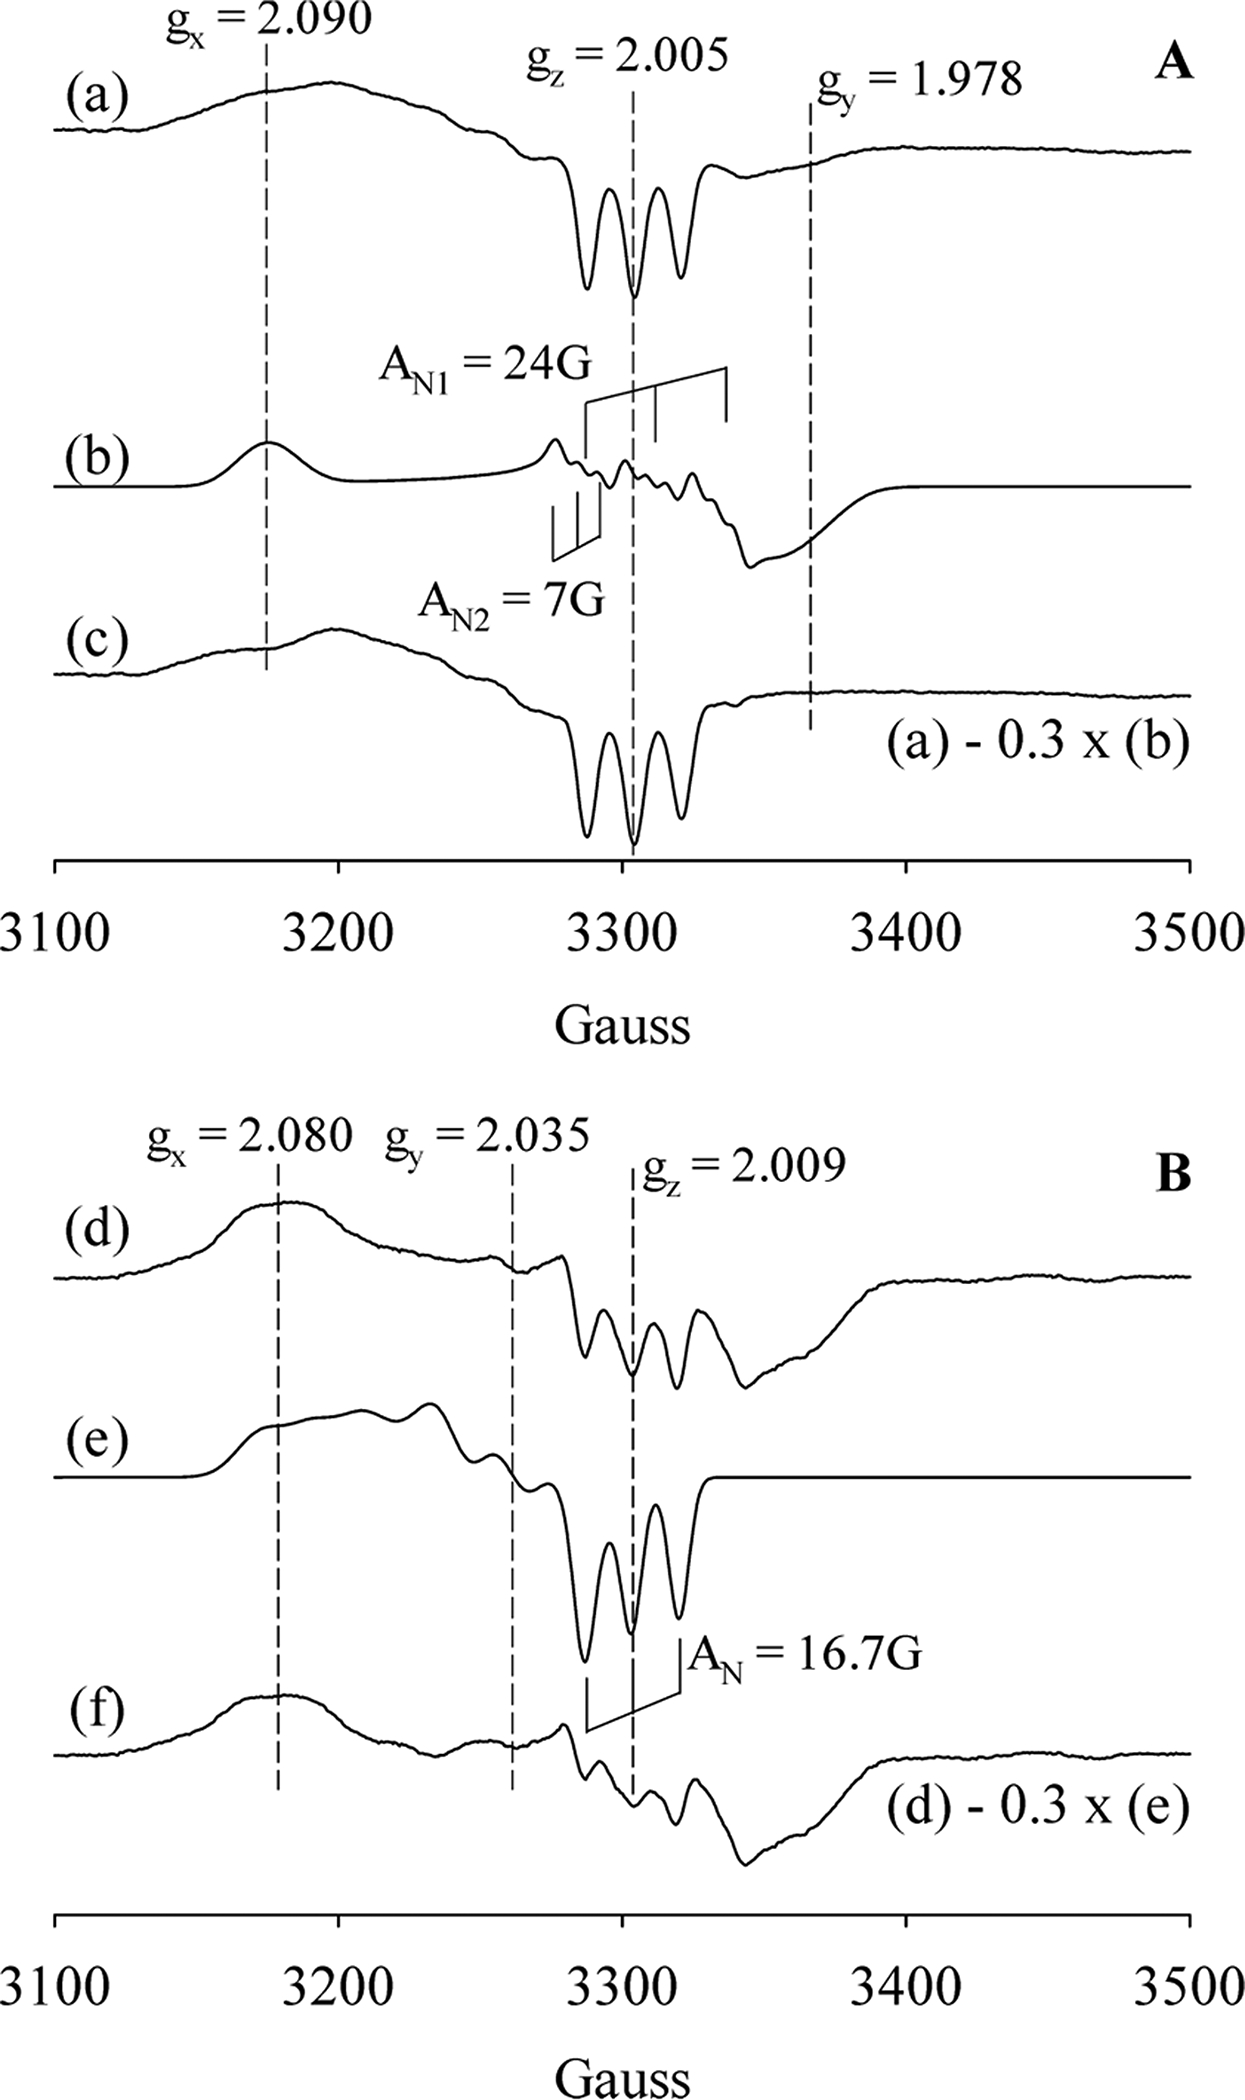
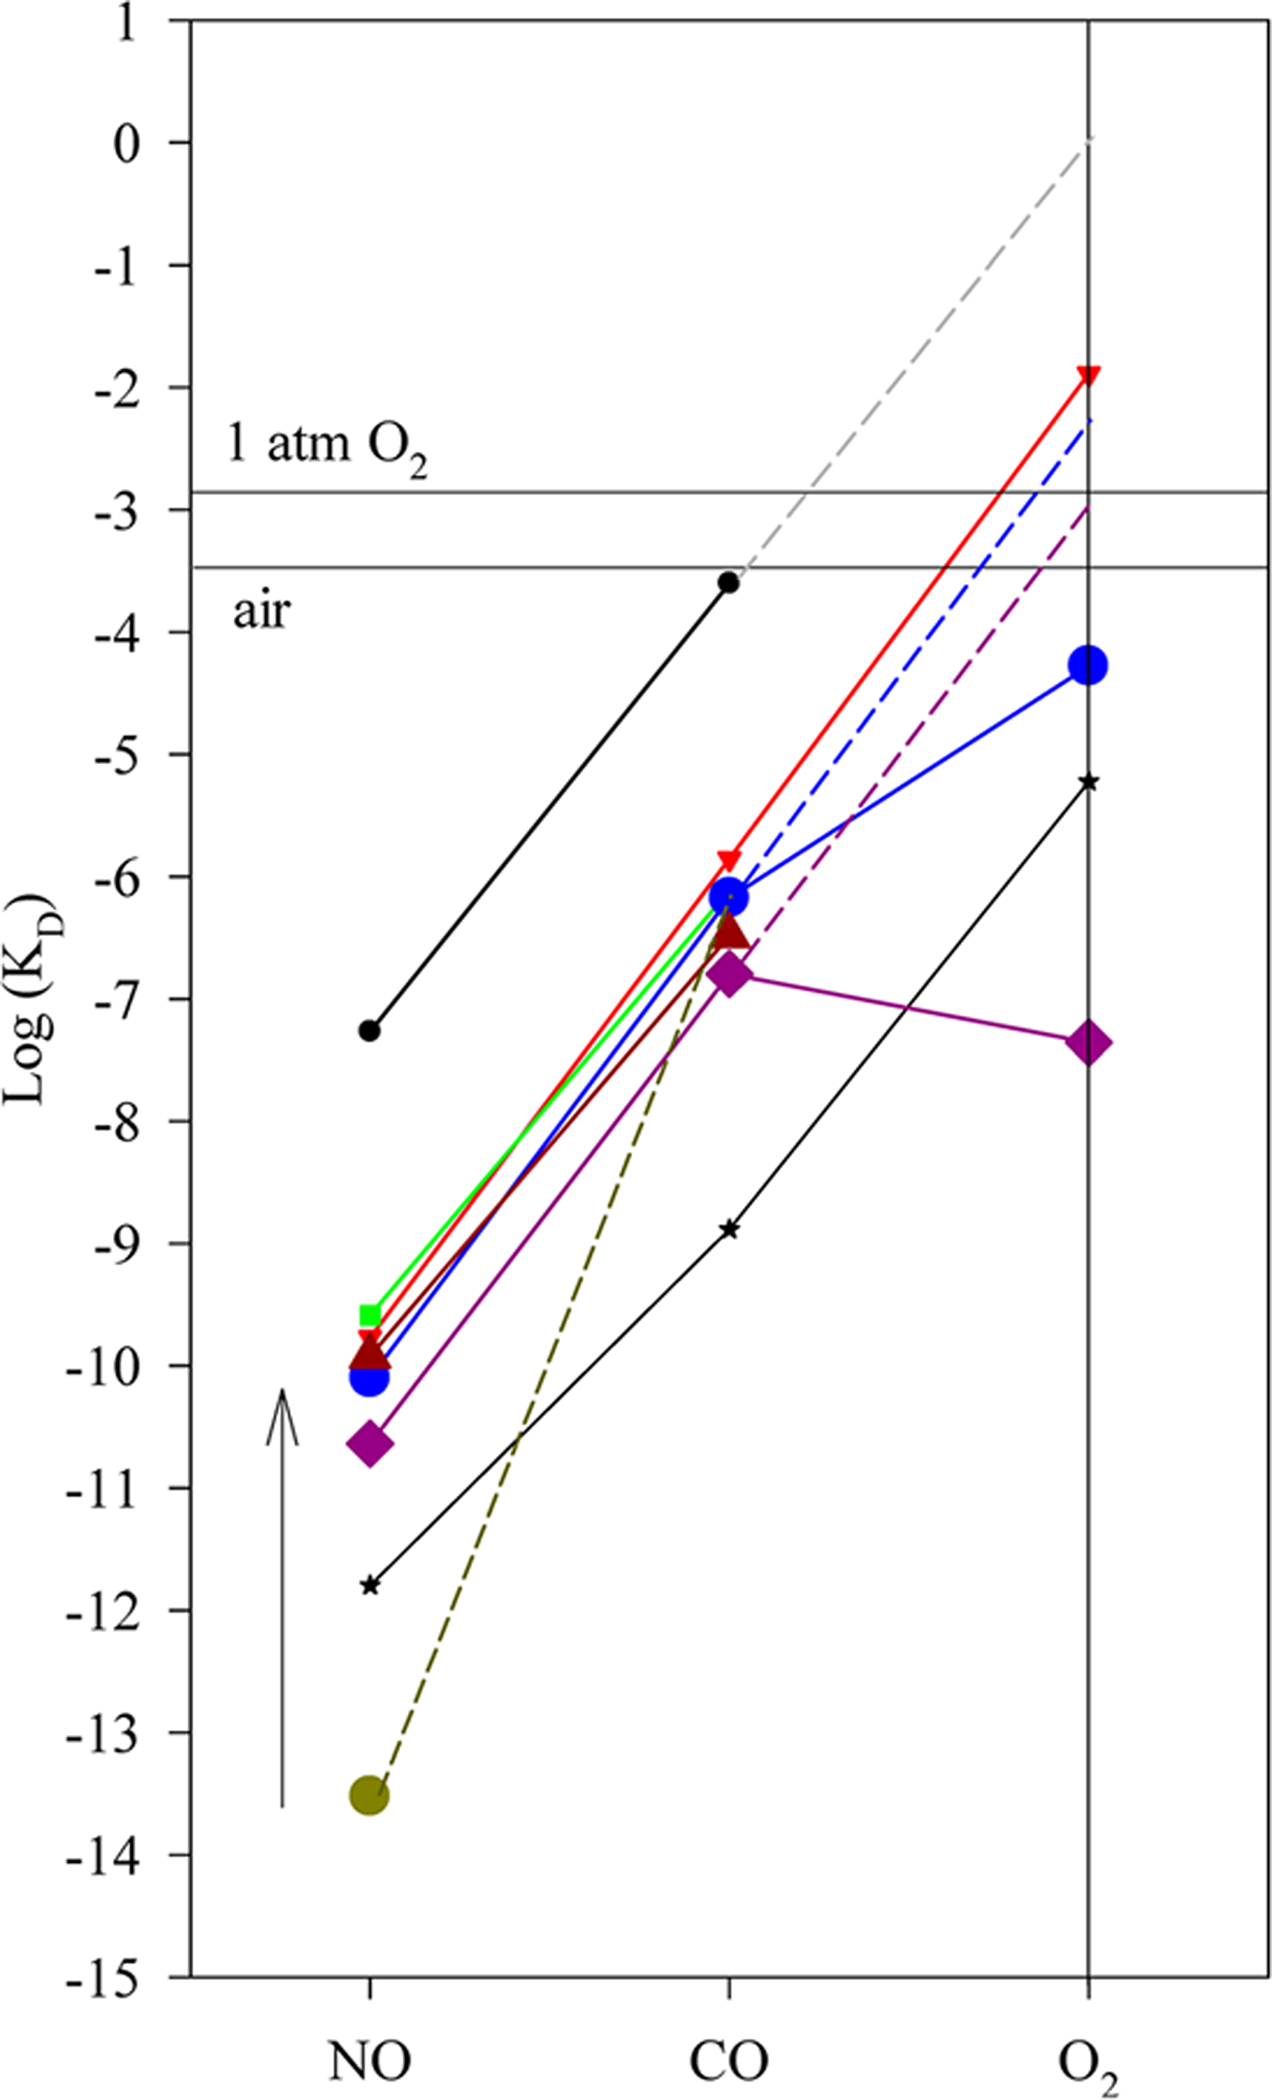
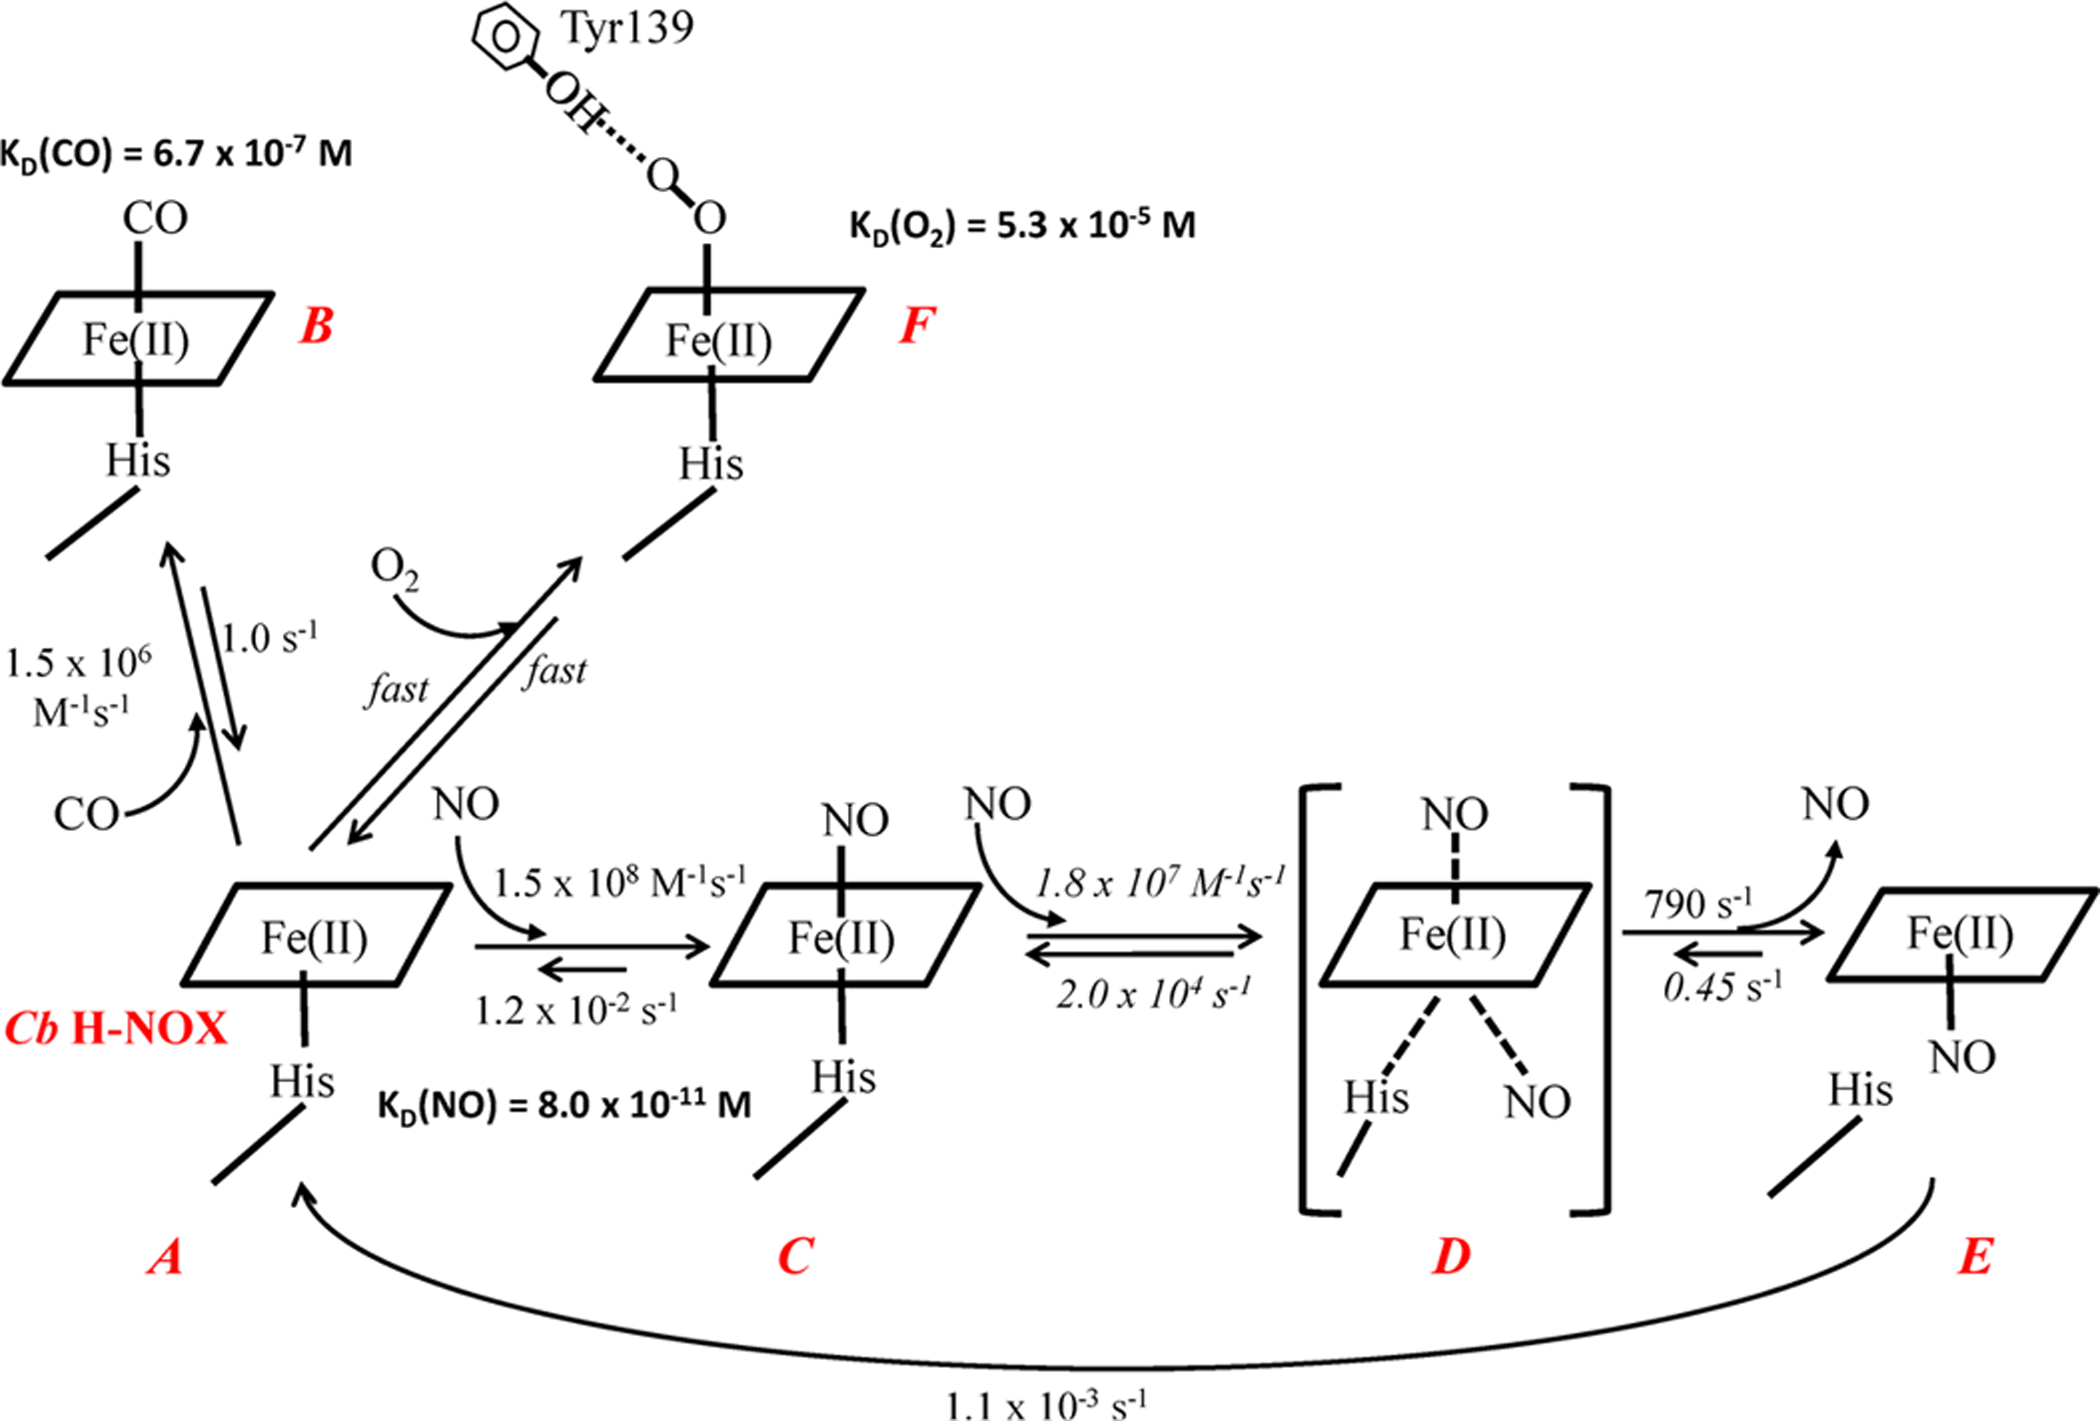
Heme nitric oxide/oxygen binding protein isolated from the obligate anaerobe Clostridium botulinum (Cb H-NOX) was previously reported to bind NO with a femtomolar K(D) (Nioche, P. et al. Science 2004, 306, 1550-1553). On the other hand, no oxyferrous Cb H-NOX was observed despite full conservation of the key residues that stabilize the oxyferrous complex in the H-NOX from Thermoanaerobacter tengcongensis (Tt H-NOX) (the same study). In this study, we re-measured the kinetics/affinities of Cb H-NOX for CO, NO, and O2. K(D)(CO) for the simple one-step equilibrium binding was 1.6 × 10(-7) M. The K(D)(NO) of Cb H-NOX was 8.0 × 10(-11) M for the first six-coordinate NO complex, and the previous femtomolar K(D)(NO) was actually an apparent K(D) for its multiple-step NO binding. An oxyferrous Cb H-NOX was clearly observed with a K(D)(O2) of 5.3 × 10(-5) M, which is significantly higher than Tt H-NOX's K(D)(O2) = 4.4 × 10(-8) M. The gaseous ligand binding of Cb H-NOX provides another supportive example for the "sliding scale rule" hypothesis (Tsai, A.-L. et al. Antioxid. Redox Signal. 2012, 17, 1246-1263), and the presence of hydrogen bond donor Tyr139 in Cb H-NOX selectively enhanced its affinity for oxygen.


Conflict of interest statement

The authors declare no competing financial interest.

Figures

Figure 1.
Figure 1.
Rapid-scan of NO binding to wt and Y139F Cb H-NOXs. (A) Reaction of 3.3 μM wt Cb H-NOX with 1 equiv of NO monitored for 0.3 s (black). Spectra at selected time points, 1.28, 3.84, 11.5, 49.9, 152.3, and 254.7 ms, are presented. The spectrum of wt Cb H-NOX mixed with anaerobic buffer (red) represents the spectrum at 0 s of the reaction. The Soret peak shifts from 432 to 420 nm; and further shifts to 409 nm after 6 s (blue dashed). Inset. The Soret region of the two intermediates resolved from the 0.3 s reaction, B (black) and C (green), based on model ABC, are plotted together with that of ferrous wt Cb H-NOX (A, red). (B) Reaction of 3.4 μM Y139F Cb H-NOX with 1 equiv NO monitored for 0.3 s (black). Spectra at selected time points, 1.28, 3.84, 24.3, 126.7, and 254.7 ms, are presented. The spectrum of Y139F Cb H-NOX mixed with anaerobic buffer (red) represents the spectrum at 0 s of the reaction. The Soret peak shifts from 432 to 420 nm, and does not shift further up to 524 s (blue dashed). Inset. The Soret region of the two optically resolved intermediates from the 0.3 s reaction, B (black) and C (green), based on model ABC, are plotted together with that of ferrous Y139F Cb H-NOX (A, red). (C) Reaction of 3.3 μM wt Cb H-NOX with 10 equiv of NO monitored for 0.3 s (black). Spectra at selected time points, 1.28, 11.5, 24.3, 37.1, 49.9, 62.7, 75.5, 101.1, 152.3, 203.5, and 254.7 ms, are presented. Red line, same as in (A). The Soret peak shifts from 432 to 409 nm. (D) Reaction of 3.4 μM Y139F Cb H-NOX with 10 equiv NO monitored for 0.3 s (black). Spectra at selected time points, 1.28, 11.5, 24.3, 37.1, 75.5, 126.7, and 254.7 ms, are presented. Red line, same as in (B). The Soret peak shifts from 432 to 420 nm without any further shift after 524 s (blue dashed). The arrows indicate the directions of spectral changes.
Figure 2.
Figure 2.
Kinetics of the formation/dissociation of 6c NO complexes of wt and Y139F Cb H-NOXs. (A) Time course of A430 during the reaction of 2.3 μM wt Cb H-NOX with 1 equiv of NO (circles) and its fit to the eq 3 (red line). (B) Time course of A424 during the sequential stopped-flow reaction, 2.3 μM wt Cb H-NOX was first reacted with 1 equiv of NO, aged for 100 ms and then reacted with 50 mM dithionite with 1 mM CO (circles), and fitting to equation A=Amax×(1ekobst) (red line), where Amax is the maximal level of A424 and t is the reaction time. (C) Time course of A432 during the reaction of 0.5 μM Y139F Cb H-NOX with 1 equiv of NO (circles), and kobs obtained by fitting to eq 3 (red line). (D) Time course of A424 during the reaction of 3.0 μM Y139F Cb H-NOX with 1 equiv of NO then reacted with 50 mM dithionite with 1 mM CO (circles), and kobs obtained by fitting to the same equation as in (B) (red line).
Figure 3.
Figure 3.
Saturation kinetics for the reaction of wt Cb H-NOX with excess NO. Time courses of A422 during the reactions of 2.3 μM Cb H-NOX with 25, 100, 200, 300, 400, 500, 650, 800, and 1000 μM NO (from top to bottom, respectively) at 24 °C. Inset. Dependence of observed rate constants, kobs (○) on [NO] and its fit to eq 5 (line).
Figure 4.
Figure 4.
EPR of wt and Y139F Cb H-NOXs with excess NO. Panel A. (a) Reaction of 4.5 μM wt Cb H-NOX with 20 equiv of NO for 1 min, exhibiting EPR signatures of the majority a 5c NO-heme complex plus a minor portion of a 6c NO-heme-His complex. (b) EPR spectrum of a 6c NO-heme-His complex simulated using the following parameters: gx = 2.090, gy = 1.978, gz = 2.005; AN1: Ax = 6 G; Ay = 10 G and Az = 24.0 G; AN2: Ax = 6 G; Ay = 10 G and Az = 7 G. (c) Subtraction of 30% of (b) from (a) yields an EPR spectrum of a pure 5c NO-heme complex. Panel B. (d) Reaction of 6.0 μM Y139F Cb H-NOX reacted with 20 equiv NO for 1 min, exhibiting EPR signatures of the majority a 6c NO-heme-His complex with a minor portion of a 5c NO-heme complex. (e) EPR spectrum of a 5c NO-heme complex simulated using the following parameters: gx = 2.080, gy = 2.035, gz = 2.009; AN: Ax = 18 G; Ay = 20 G and Az = 16.7 G. (f) Subtraction of 30% of (e) from (d) yields an EPR spectrum of a pure 6c NO-heme-His complex.
Figure 5.
Figure 5.
EPR of wt and Y140F Tt H-NOXs with excess NO. (A) NO-heme-His complex trapped after 13 μM wt Tt H-NOX reaction with 30 equiv of NO for 1 min. (B) Simulation of the EPR spectrum A using the following parameters: gx = 2.090, gy = 1.978, gz = 2.005; AN1: Ax = 6 G; Ay = 10 G and Az = 24.0 G; AN2: Ax = 6 G; Ay = 10 G and Az = 7 G. (C) NO-heme-His complex trapped after 95 μM Y140F Tt H-NOX reaction with 5 equiv of NO for 1 min. (D) Simulation of the EPR spectrum C using the following parameters: gx = 2.069, gy = 1.965, gz = 2.000; AN1: Ax = 10 G; Ay = 13 G, and Az = 22.2 G; AN2: Ax = 6 G; Ay = 13 G, and Az = 6.7 G.
Figure 6.
Figure 6.
Interaction of O2 with wt and Y139F Cb H-NOXs. (A) Spectra of 3.6 μM anaerobic ferrous Cb H-NOX (black) and the first spectrum of rapid-scan reaction with aerobic buffers (red), [O2]final ≈ 120 μM. The y-axis represents the extinction coefficients. (B) The change of A432, the Soret of Cb H-NOX, in the reaction of 3.3 μM Cb H-NOX with various concentrations of O2 (circle) and its fit using eq 6 (solid line). (C) Spectra of 2.2 μM anaerobic Y139F Cb H-NOX before (black) and after (red) mixing with O2-saturated buffer, [O2]final ≈ 600 μM. The y-axis represents the extinction coefficients.
Figure 7.
Figure 7.
Relationship of log KD’s for H-NOXs versus ligand type. The measured logarithm values of KD(NO), KD(CO), and KD(O2) of H-NOXs are plotted versus ligand type. KD’s measured for sGC and heme model ferrous PPIX(1-MeIm) are also plotted for comparisons. Wt Cb H-NOX (blue circle); Y139F Cb H-NOX (brown triangle); Tt H-NOX (purple diamond); Vc H-NOX (green square); Ns H-NOX (red triangle); sGC (black circle) (an extrapolation from sGC log KD(NO)-log KD(CO) line, gray dashed line, predicts its KD(O2) ≈ 1.1 M) and ferrous PPIX (1-MeIm) (black star). The KD(NO) (dark yellow circle) of Cb H-NOX previously measured is connected to its KD(CO) by the broken line; the change between the KD(NO) measured in this study, and the previously measured value is represented by the arrow. The blue and purple dashed lines represent the prediction of KD(O2)’s of Cb and Tt H-NOXs, respectively, based on the extrapolation from their log KD(NO)-log KD(CO) lines.
Scheme 1.
Scheme 1.. Binding of Gaseous Ligands to Ferrous Cb H-NOXa
aEach heme species is labeled in red. The rate constants labeled in italic are estimated by computer modeling. Both association and dissociation of O2 to ferrous Cb H-NOX (A) are assumed to be fast, and the rate constants are not determined, although KD(O2) of Cb H-NOX was measured by stopped-flow titration method. KD(NO) is the affinity for 6c NO-heme-His complex. The putative hydrogen bonding from the hydroxyl group of Y139 to O2-heme is represented by a dashed line. Intermediate D, bracketed in parentheses, is a quaternary complex as proposed before and is not observed in experiment, for its extreme transient nature.

References

    1. Boon EM, and Marletta MA (2005) Ligand specificity of H-NOX domains: from sGC to bacterial NO sensors. J. Inorg. Biochem 99, 892–902. - PubMed
    1. Shimizu T, Huang D, Yan F, Stranava M, Bartosova M, Fojtikova V, and Martinkova M (2015) Gaseous O2, NO, and CO in signal transduction: structure and function relationships of heme-based gas sensors and heme-redox sensors. Chem. Rev 115, 6491–6533. - PubMed
    1. Tsai A-L, Martin E, Berka V, and Olson JS (2012) How do heme-protein sensors exclude oxygen? Lessons learned from cytochrome c’, Nostoc puntiforme heme nitric oxide/oxygen-binding domain, and soluble guanylyl cyclase. Antioxid. Redox Signaling 17, 1246–1263. - PMC - PubMed
    1. Derbyshire ER, and Marletta MA (2009) Biochemistry of soluble guanylate cyclase. Handb Exp Pharmacol 191, 17–31. - PubMed
    1. Wu G, Liu W, Berka V, and Tsai A-L (2013) The Selectivity of Vibrio cholerae H-NOX for Gaseous Ligands Follows the ″Sliding Scale Rule″ Hypothesis. Ligand Interactions with both Ferrous and Ferric Vc H-NOX. Biochemistry 52, 9432–9446. - PMC - PubMed

Publication types