. 2015 Dec 8;112(49):15148-53.
doi: 10.1073/pnas.1518008112. Epub 2015 Nov 2.

Pericentromeric satellite repeat expansions through RNA-derived DNA intermediates in cancer

Affiliations

Pericentromeric satellite repeat expansions through RNA-derived DNA intermediates in cancer

Francesca Bersani et al. Proc Natl Acad Sci U S A. .

Abstract

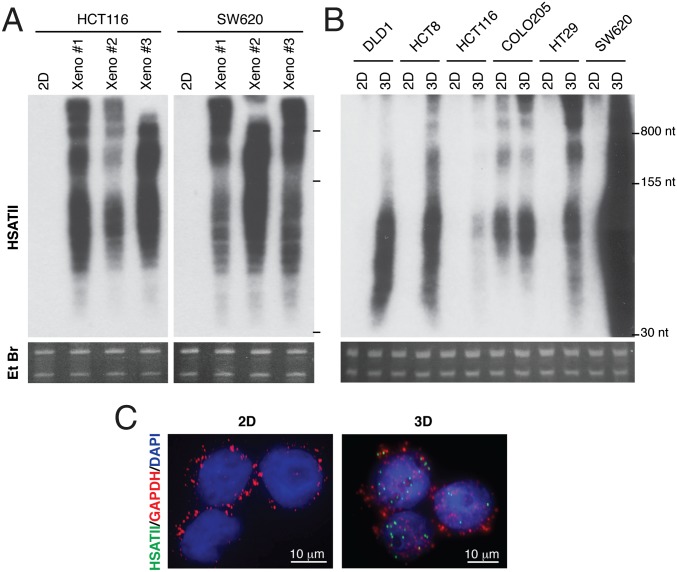
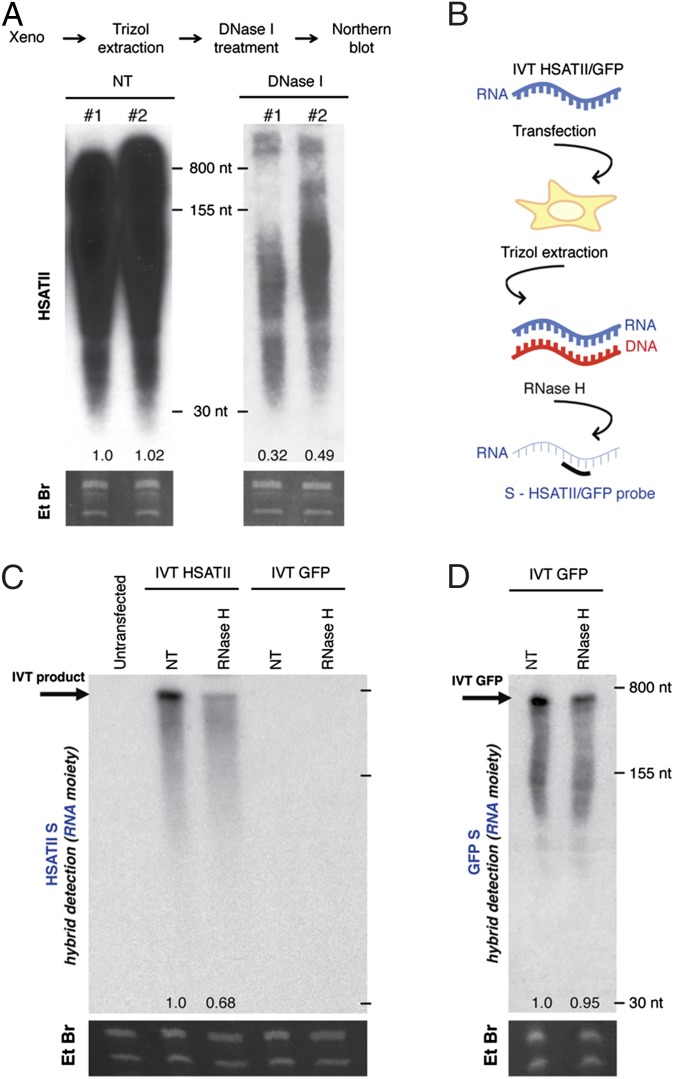
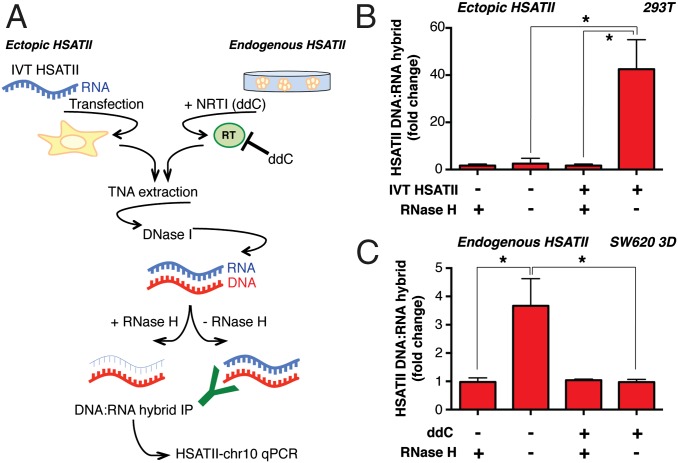
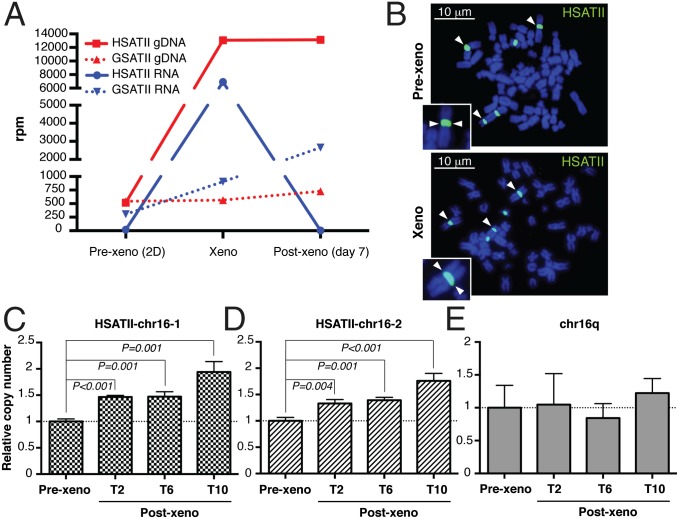
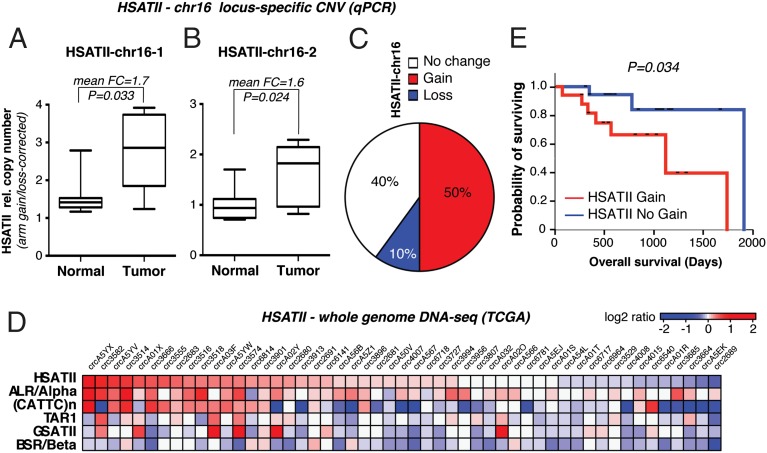
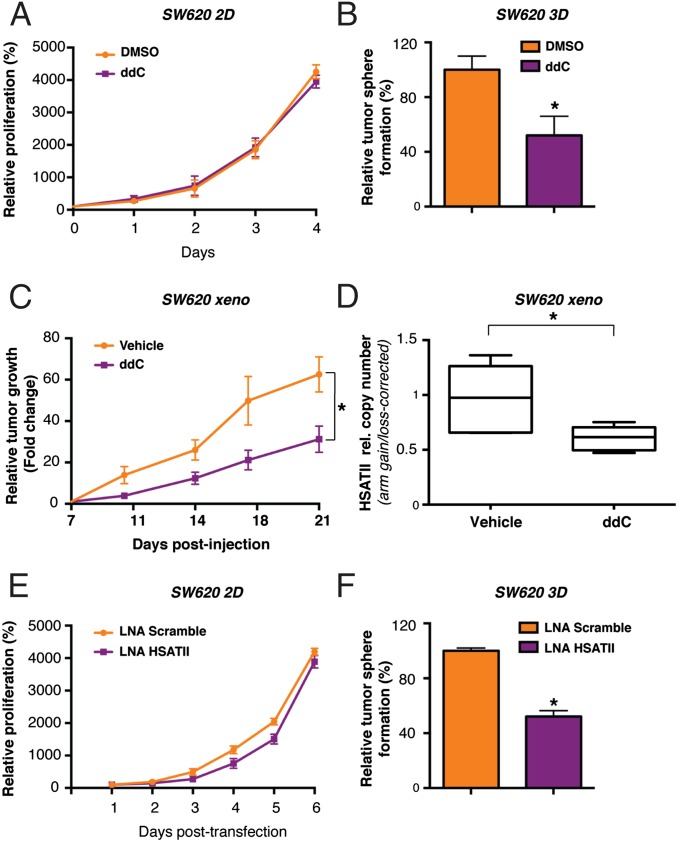
Aberrant transcription of the pericentromeric human satellite II (HSATII) repeat is present in a wide variety of epithelial cancers. In deriving experimental systems to study its deregulation, we observed that HSATII expression is induced in colon cancer cells cultured as xenografts or under nonadherent conditions in vitro, but it is rapidly lost in standard 2D cultures. Unexpectedly, physiological induction of endogenous HSATII RNA, as well as introduction of synthetic HSATII transcripts, generated cDNA intermediates in the form of DNA/RNA hybrids. Single molecule sequencing of tumor xenografts showed that HSATII RNA-derived DNA (rdDNA) molecules are stably incorporated within pericentromeric loci. Suppression of RT activity using small molecule inhibitors reduced HSATII copy gain. Analysis of whole-genome sequencing data revealed that HSATII copy number gain is a common feature in primary human colon tumors and is associated with a lower overall survival. Together, our observations suggest that cancer-associated derepression of specific repetitive sequences can promote their RNA-driven genomic expansion, with potential implications on pericentromeric architecture.

Keywords: cancer; repeats; reverse transcription; satellites.


Conflict of interest statement

The authors declare no conflict of interest.

Figures

Fig. 1.
Fig. 1.
HSATII is expressed in human tumors and 3D cancer cell models. (A) Northern blot analysis of HSATII expression in HCT116 and SW620 cells grown as 2D cultures or xenografts (Xeno). (B) Northern blot analysis of HSATII expression in colon cancer cell lines grown as 2D cultures or tumor spheres (3D). Ethidium bromide (Et Br) stainings of gels are shown for each Northern blot analysis as loading controls. (C) RNA in situ hybridization (with the indicated fluorescent probes) of SW620 cells cultured under 2D conditions or as tumor spheres (3D). HSATII/DAPI colocalization coefficient measured by confocal imaging: R = 0.6 ± 0.04.
Fig. 2.
Fig. 2.
Ectopic HSATII RNA gives rise to DNA/RNA intermediates. (A) Northern blot analysis of HSATII in untreated (NT) or DNase I-treated extracts obtained from SW620 xenografts. Numbers below indicate relative signal quantitation. (B) TRIzol extracts obtained from 293T cells 24 h after transfection with HSATII/GFP IVT products were subjected to RNase H treatment, followed by Northern blotting and hybridization to detect the RNA strand (S-HSATII) of the hybrid. (C) Northern blot analysis of extracts from 293T cells either untransfected or transfected with IVT HSATII or GFP, subjected to the indicated nuclease treatment and probed for HSATII S. (D) Northern blot analysis of extracts from 293T cells after transfection with IVT GFP, treated with RNase H and probed for GFP S. Numbers below indicate relative signal quantitation.
Fig. 3.
Fig. 3.
DRIP reveals the presence of ectopic as well as endogenous HSATII hybrids whose production is affected by RT inhibition. (A) Outline of the experimental layout. Total nucleic acids (TNAs) were isolated from IVT HSATII-transfected 293T cells or SW620 tumor spheres cultured in the presence of ddC or DMSO (ddC). TNAs were treated with DNase I digestion to remove all potential gDNA contamination. DNA/RNA hybrids were then purified by immunomagnetic pull-down using a hybrid-specific antibody, and their relative quantities were measured by HSATII-chr10 qPCR. Pretreatment of TNA samples with RNase H as indicated demonstrates abrogation of DNA/RNA hybrid detection. (B) Fold change in the enrichment of DNA/RNA hybrids in HSATII-transfected 293T cells measured by qPCR after DRIP. (C) Fold enrichment of endogenous HSATII DNA/RNA hybrids in SW620 tumor spheres analyzed by HSATII-chr10 qPCR after DRIP. Fold changes were calculated based on percent input values, and the RNase H-treated samples were set at 1. For all charts, values represent the average of three independent experiments ± SEM. *P < 0.05 (t test).
Fig. 4.
Fig. 4.
HSATII rdDNA is reintegrated at the same original loci in the genome, leading to pericentromere elongation in colon cancer xenografts. (A) DGE (RNA) and copy number (gDNA) analysis of satellite repeats (HSATII and GSATII) in the indicated samples (SW620) quantitated by single molecule sequencing. (B) Representative HSATII DNA FISH (white arrowheads) on metaphase spreads of prexenograft (Pre-xeno) 2D cultures and xenografts obtained from SW620 cells. (Insets) Enlarged (1,000×) HSATII-positive chromosomes. CNV in SW620 cells was assessed by qPCR on the HSATII–chr16-1 locus (C), HSATII–chr16-2 locus (D), and chromosome 16q arm (E). Cycle threshold values for all samples were normalized against β-actin, and DNA CNV is expressed relative to SW620 cells before xenograft implants, which was set at 1 (T2, T6, T10 = 1 wk of culture after the second, sixth, and 10th serial transplants, respectively). Error bars represent SD (n = 3).
Fig. 5.
Fig. 5.
Pericentromeric HSATII repeats expand both locally and genome-wide in primary human colon cancer samples. CNV analysis of HSATII–chr16-1 (A) and HSATII–chr16-2 (B) loci on the indicated paired colon specimens (n = 10) is shown. For each sample, values were normalized for β-actin DNA and corrected for chr16q arm changes. Probability was measured by the paired t test. FC, mean fold change. (C) Relative percentage of HSATII copy number changes in colon tumor/normal pairs according to combined HSATII–chr16-1 and HSATII–chr16-2 CNV analysis, including correction for chr16 arm gains/losses. (D) Heat map of whole-genome sequencing data on the indicated primary colon cancer specimens based on a log2 ratio cutoff of 0.1. (E) Kaplan–Meier curve of overall survival (days) of patients with primary colon cancers with HSATII CNV gain or no gain. P = 0.034 (log-rank P value).
Fig. 6.
Fig. 6.
RT blockage, as well as LNA-mediated inhibition of HSATII transcripts, affects tumor sphere growth, impairs tumorigenesis, and prevents pericentromeric copy number gains in vivo. (A) Proliferation assay on DMSO- and ddC-treated SW620 cells. Values (%) were normalized against the signal derived from viable cells on the day of seeding, which was set at 100%. (B) Tumor sphere-forming ability of SW620 cells was tested upon culture in the presence of ddC for 15 d. Values (%) were normalized against the amount of spheres in the DMSO control, which was set at 100%. *P < 0.05 (t test). (C) In vivo tumor growth of SW620 cell xenografts. Mice were treated daily by i.p. injection of 25 mg/kg ddC or vehicle alone, starting 1 wk after tumor cell injection. Tumor size at this stage was set at 1 to calculate relative size fold change over time. Error bars represent SEM (n = 6). *P < 0.05 (t test). (D) CNV analysis of HSATII by qPCR on the chr16-1 locus in tumors recovered from untreated (Vehicle) or ddC-treated mice (n = 6). Values were normalized for β-actin and expressed as HSATII/chr16q arm ratios. *P < 0.05 (t test). (E) Proliferation assay on SW620 cells upon transfection with an HSATII-specific or Scramble LNA. Values (%) were normalized against the signal derived from viable cells 1 d after transfection, which was set at 100%. (F) Tumor sphere-forming ability of SW620 cells was tested upon transfection with an HSATII-specific or Scramble LNA. Values (%) were normalized against the amount of spheres in the control, which was set at 100%. *P < 0.05 (t test). In A, B, E, and F, error bars represent SD (n = 3).

Comment in

  • Silent pericentromeric repeats speak out.
    Younger ST, Rinn JL. Younger ST, et al. Proc Natl Acad Sci U S A. 2015 Dec 8;112(49):15008-9. doi: 10.1073/pnas.1520341112. Epub 2015 Nov 18. Proc Natl Acad Sci U S A. 2015. PMID: 26582791 Free PMC article. No abstract available.

References

    1. Bierhoff H, Postepska-Igielska A, Grummt I. 2013. Noisy silence: Non-coding RNA and heterochromatin formation at repetitive elements. Epigenetics 9(1):53–61. - PMC - PubMed
    1. Eymery A, Callanan M, Vourc’h C. The secret message of heterochromatin: New insights into the mechanisms and function of centromeric and pericentric repeat sequence transcription. Int J Dev Biol. 2009;53(2-3):259–268. - PubMed
    1. Ting DT, et al. Aberrant overexpression of satellite repeats in pancreatic and other epithelial cancers. Science. 2011;331(6017):593–596. - PMC - PubMed
    1. Eymery A, et al. A transcriptomic analysis of human centromeric and pericentric sequences in normal and tumor cells. Nucleic Acids Res. 2009;37(19):6340–6354. - PMC - PubMed
    1. Zhu Q, et al. BRCA1 tumour suppression occurs via heterochromatin-mediated silencing. Nature. 2011;477(7363):179–184. - PMC - PubMed

Publication types