. 2015 Nov 17;10(11):e0143000.
doi: 10.1371/journal.pone.0143000. eCollection 2015.

454 Pyrosequencing of Olive (Olea europaea L.) Transcriptome in Response to Salinity

Affiliations

454 Pyrosequencing of Olive (Olea europaea L.) Transcriptome in Response to Salinity

Christos Bazakos et al. PLoS One. .

Abstract

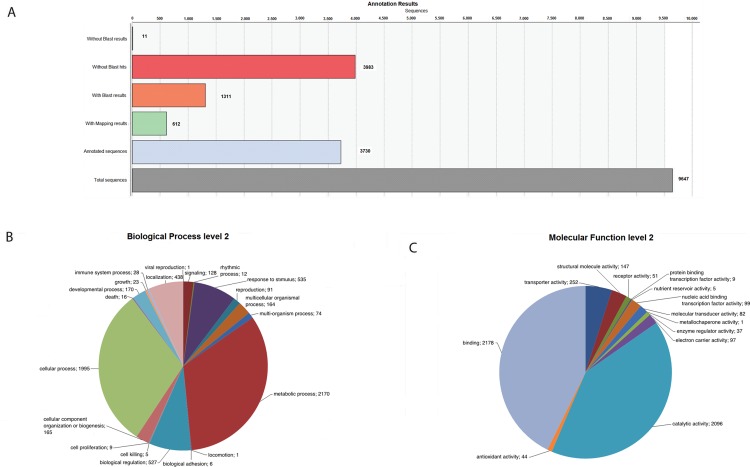
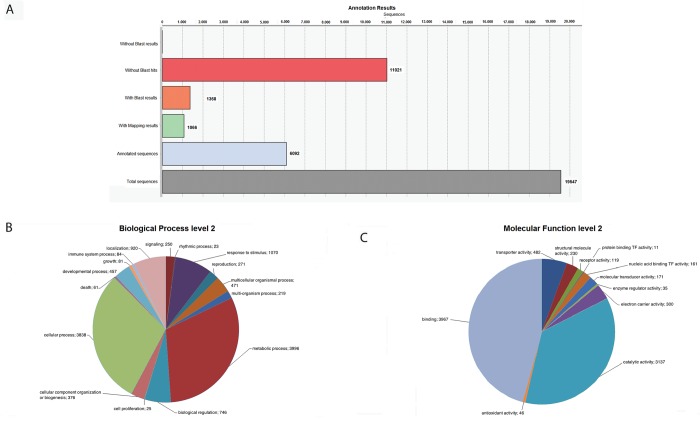
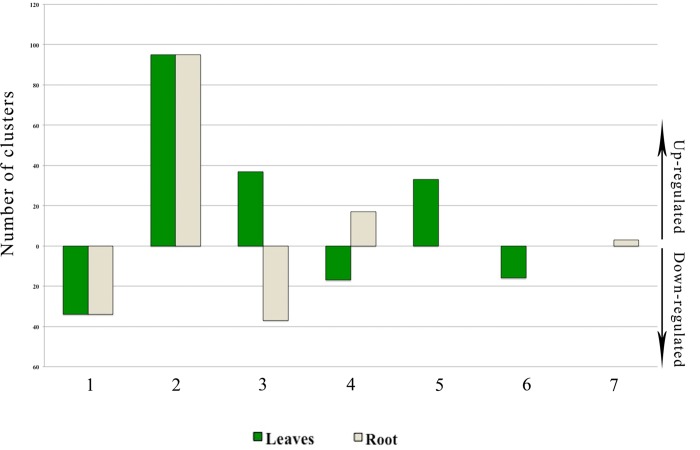
Olive (Olea europaea L.) is one of the most important crops in the Mediterranean region. The expansion of cultivation in areas irrigated with low quality and saline water has negative effects on growth and productivity however the investigation of the molecular basis of salt tolerance in olive trees has been only recently initiated. To this end, we investigated the molecular response of cultivar Kalamon to salinity stress using next-generation sequencing technology to explore the transcriptome profile of olive leaves and roots and identify differentially expressed genes that are related to salt tolerance response. Out of 291,958 obtained trimmed reads, 28,270 unique transcripts were identified of which 35% are annotated, a percentage that is comparable to similar reports on non-model plants. Among the 1,624 clusters in roots that comprise more than one read, 24 were differentially expressed comprising 9 down- and 15 up-regulated genes. Respectively, inleaves, among the 2,642 clusters, 70 were identified as differentially expressed, with 14 down- and 56 up-regulated genes. Using next-generation sequencing technology we were able to identify salt-response-related transcripts. Furthermore we provide an annotated transcriptome of olive as well as expression data, which are both significant tools for further molecular studies in olive.


Conflict of interest statement

Competing Interests: The authors have declared that no competing interests exist.

Figures

Fig 1
Fig 1. Annotation of 9,647 unique transcripts derived from roots’ cDNA libraries.
A) Statistics of BlastX-based annotation results; B) Gene Ontology annotation related to biological processes; C) Gene Ontology annotation related to molecular functions.
Fig 2
Fig 2. Annotation of 19,547 unique transcripts derived from leaves’ cDNA libraries.
A) Statistics of BlastX-based annotation results; B) Gene Ontology annotation related to biological processes; C) Gene Ontology annotation related to molecular functions.
Fig 3
Fig 3. The most abundant transcription factors of olive root and leaves data.
The x-axis shows the number of ESTs that are annotated on each group of TFs.
Fig 4
Fig 4. Transcripts related to ion transport.
Pie chart of 387 unique transcripts that were annotated as ion transporters according to Blast2GO database.
Fig 5
Fig 5. Differentially expressed transcripts in roots and leaves.
In total, 24 and 70 genes in roots and leaves, respectively, were significantly differentially expressed under 90-day NaCl stress.
Fig 6
Fig 6. Differentially expressed transcripts in one or more tissue and/or treatment.
1) 34 common transcripts were down-regulated in both tissues; 2) 95 common transcripts were up-regulated in both tissues; 3) 37 common transcripts were up-regulated in leaves and down-regulated in root; 4) 17 common transcripts were down-regulated in leaves and up-regulated in root; 5) 33 transcripts were expressed and up-regulated only in leaves; 6) 16 transcripts were expressed and down-regulated only in leaves; 7) 3 transcripts were expressed and up-regulated only in root.
Fig 7
Fig 7. Gene Ontology annotation related to biological processes of the 235 differentially expressed clusters in one or more tissue and/or treatment derived from the entire dataset of the four libraries.
Numbers in parenthesis show the number of times this GO term is present.
Fig 8
Fig 8. Gene Ontology annotation related to biological processes of the 49 leaf-specific differentially expressed clusters derived from the entire dataset of the four libraries.
Numbers in parenthesis show the number of times this GO term is present.
Fig 9
Fig 9. Gene Ontology annotation related to molecular functions of the 49 leaf-specific differentially expressed clusters derived from the entire dataset of the four libraries.
Numbers in parenthesis show the number of times this GO term is present.
Fig 10
Fig 10. Expression levels of six NaCl-related transcripts.
Bar graph for expression changes in 6 transcripts in both root and leaves determined by RT-qPCR. Each data point is the mean of two biological replications. Error bars represent the standard deviation of the means. Asterisks indicate statistically significant differences (*p<0.05, **p<0.01, ***p<0.001) as indicated by pairwise t-test between control and stress samples.

References

    1. Tattini M, Bertoni P, Caselli S. Genotypic responses of olive plants to sodium chloride. J Plant Nutr. 1992;15:1467–1485.
    1. Klein I, Ben-Tal Y, Lavee S, De Malach Y, David I. Saline irrigation of cv. Manzanillo and Uovo di Piccione trees. Acta Hort (ISHS). 1994;356:176–180.
    1. Cresti M, Ciampolini F, Tattini M, Cimato A. Effect of salinity on productivity and oil quality of olive (Olea europaea L.) plants. Advances in Horticultural Science. 1994;8:211–214.
    1. Loreto F, Centritto M, Chartzoulakis K. Photosynthetic limitations in olive cultivars with different sensitivity to salt stress. Plant Cell Environ. 2003;26:595–601.
    1. Tabatabaei SJ. Effects of salinity and N on the growth, photosynthesis and N status of olive (Olea europaea L.) trees. Sci Hortic-Amsterdam. 2006;108:432–438.

Publication types

MeSH terms

LinkOut - more resources