

Reference-free inference of tumor phylogenies from single-cell sequencing data
- PMID: 26576947
- PMCID: PMC4652515
- DOI: 10.1186/1471-2164-16-S11-S7
Reference-free inference of tumor phylogenies from single-cell sequencing data
Erratum in
-
Erratum to: 'Reference-free inference of tumor phylogenies from single-cell sequencing data'.BMC Genomics. 2016 May 10;17(1):348. doi: 10.1186/s12864-016-2609-2. BMC Genomics. 2016. PMID: 27164840 Free PMC article. No abstract available.
Abstract
Background: Effective management and treatment of cancer continues to be complicated by the rapid evolution and resulting heterogeneity of tumors. Phylogenetic study of cell populations in single tumors provides a way to delineate intra-tumoral heterogeneity and identify robust features of evolutionary processes. The introduction of single-cell sequencing has shown great promise for advancing single-tumor phylogenetics; however, the volume and high noise in these data present challenges for inference, especially with regard to chromosome abnormalities that typically dominate tumor evolution. Here, we investigate a strategy to use such data to track differences in tumor cell genomic content during progression.
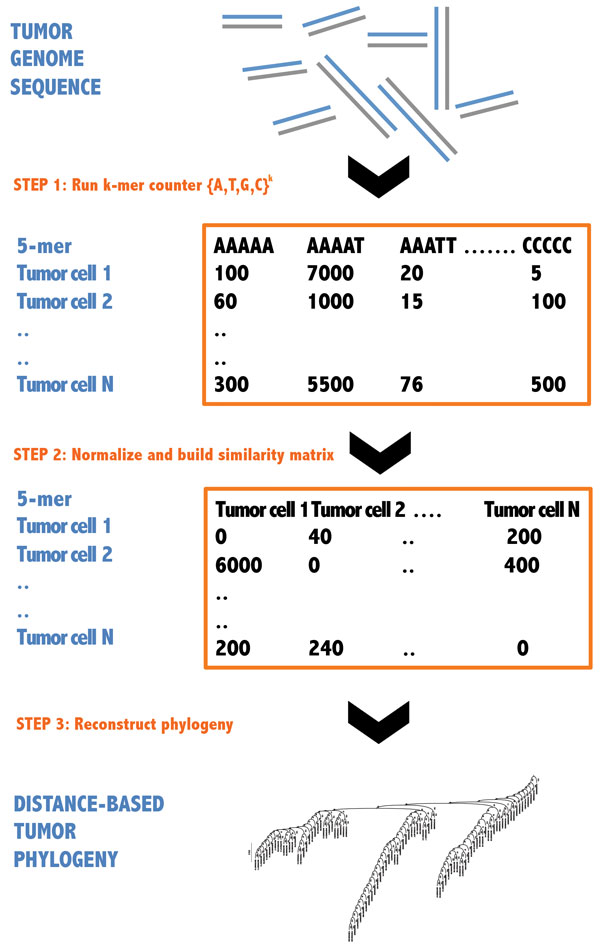
Results: We propose a reference-free approach to mining single-cell genome sequence reads to allow predictive classification of tumors into heterogeneous cell types and reconstruct models of their evolution. The approach extracts k-mer counts from single-cell tumor genomic DNA sequences, and uses differences in normalized k-mer frequencies as a proxy for overall evolutionary distance between distinct cells. The approach computationally simplifies deriving phylogenetic markers, which normally relies on first aligning sequence reads to a reference genome and then processing the data to extract meaningful progression markers for constructing phylogenetic trees. The approach also provides a way to bypass some of the challenges that massive genome rearrangement typical of tumor genomes presents for reference-based methods. We illustrate the method on a publicly available breast tumor single-cell sequencing dataset.
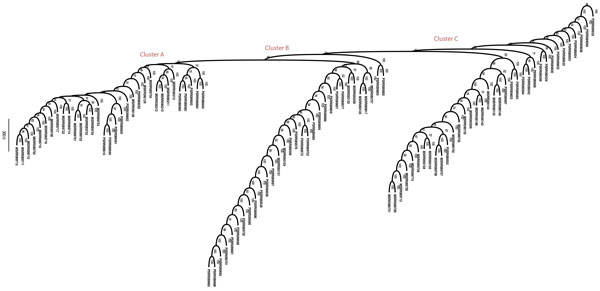
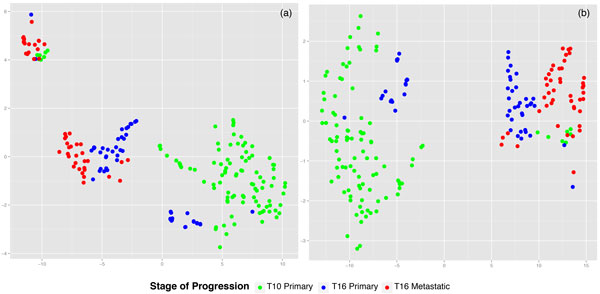
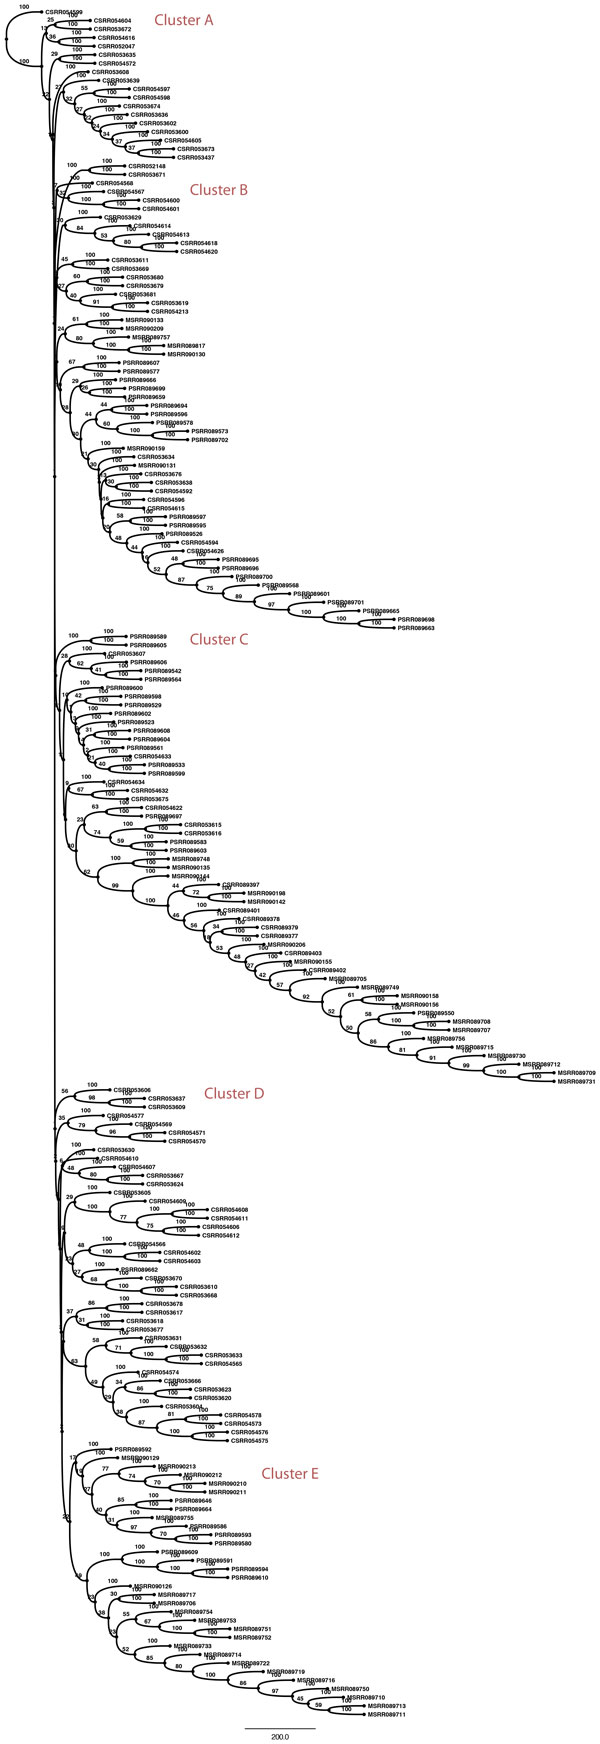
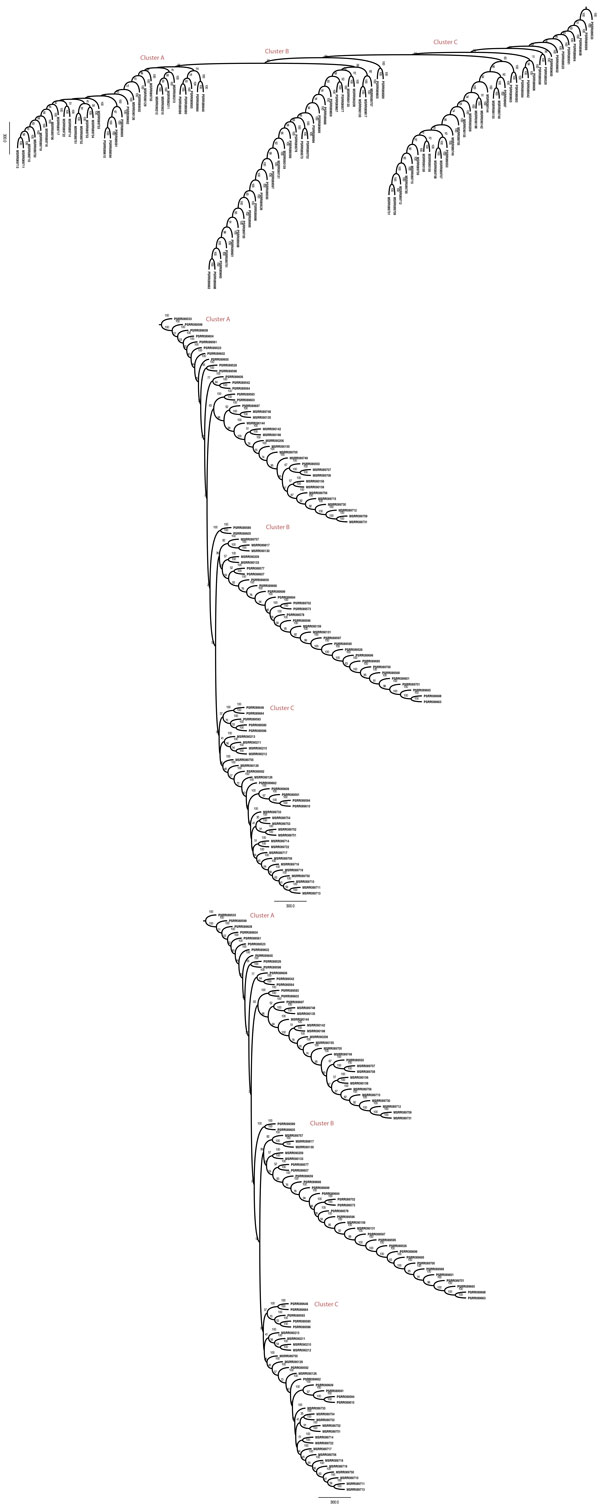
Conclusions: We have demonstrated a computational approach for learning tumor progression from single cell sequencing data using k-mer counts. k-mer features classify tumor cells by stage of progression with high accuracy. Phylogenies built from these k-mer spectrum distance matrices yield splits that are statistically significant when tested for their ability to partition cells at different stages of cancer.
Figures
References
-
- Polyak K. Tumor heterogeneity confounds and illuminates: A case for darwinian tumor evolution. Nature Medicine. 2014;20(4):344–6. - PubMed
-
- Burrell RA, McGranahan N, Bartek J, Swanton C. The causes and consequences of genetic heterogeneity in cancer evolution. Nature. 2013;501(7467):338–345. - PubMed
-
- Golub TR, Slonim DK, Tamayo P. et al.Molecular classification of cancer: class discovery and class prediction by gene expression monitoring. Science. 1999;286:531–537. - PubMed
-
- Perou CM, Sorlie T, Eisen MB. et al.Molecular portraits of human breast tumors. Nature. 2000;406:747–752. - PubMed
Publication types
MeSH terms
Grants and funding
LinkOut - more resources
Full Text Sources
Other Literature Sources
Miscellaneous
