. 2015 Nov 18:5:16828.
doi: 10.1038/srep16828.

Structural basis of Sorcin-mediated calcium-dependent signal transduction

Affiliations

Structural basis of Sorcin-mediated calcium-dependent signal transduction

Andrea Ilari et al. Sci Rep. .

Abstract

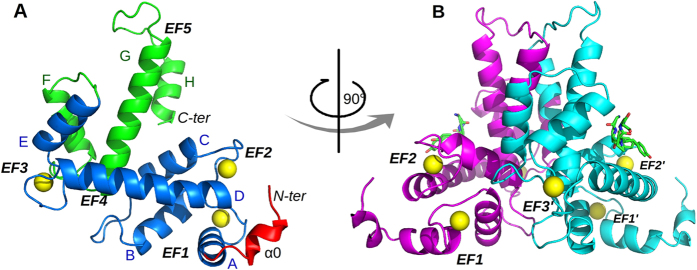
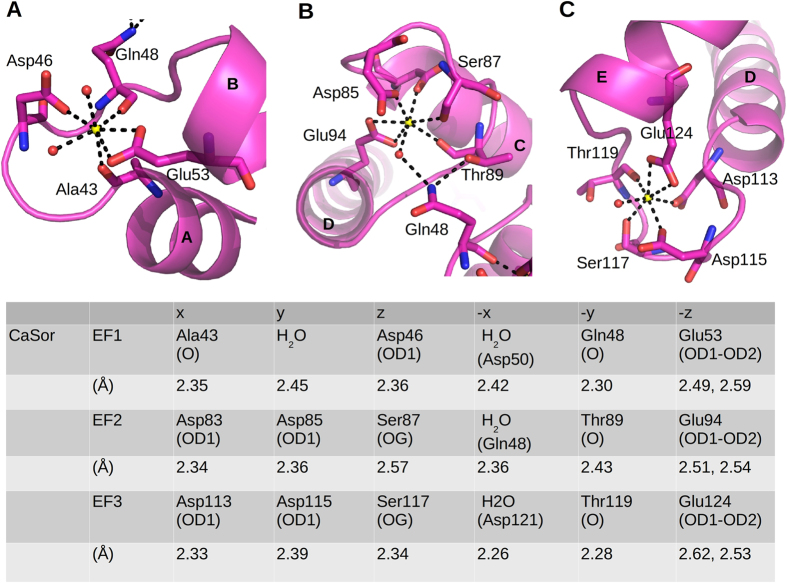
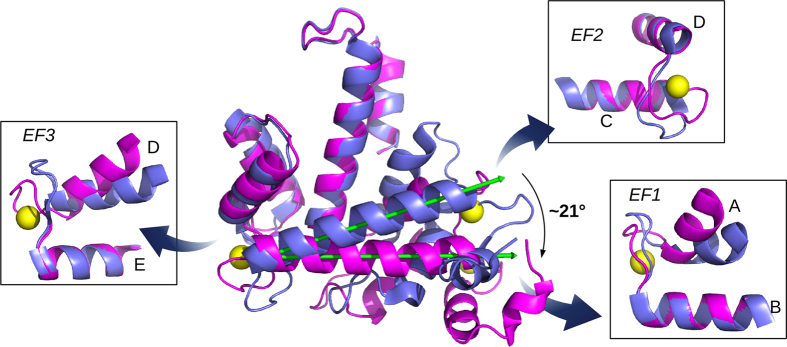
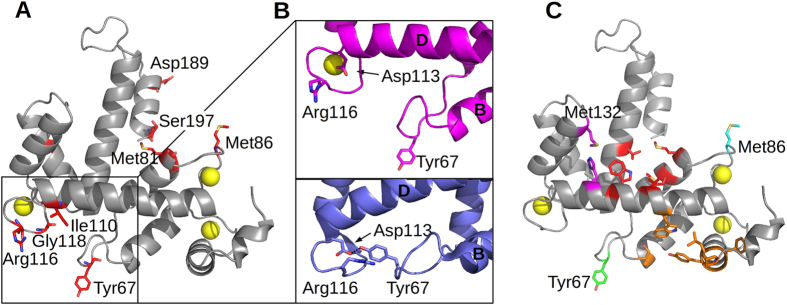
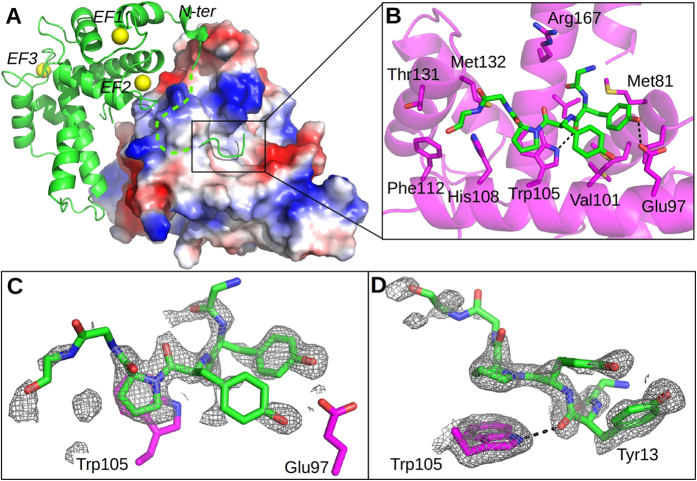
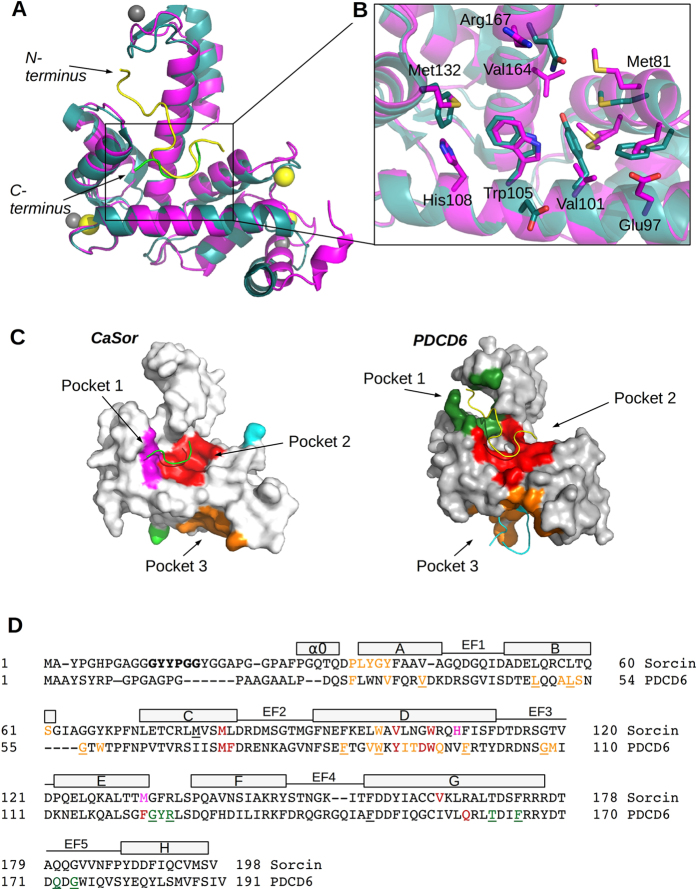
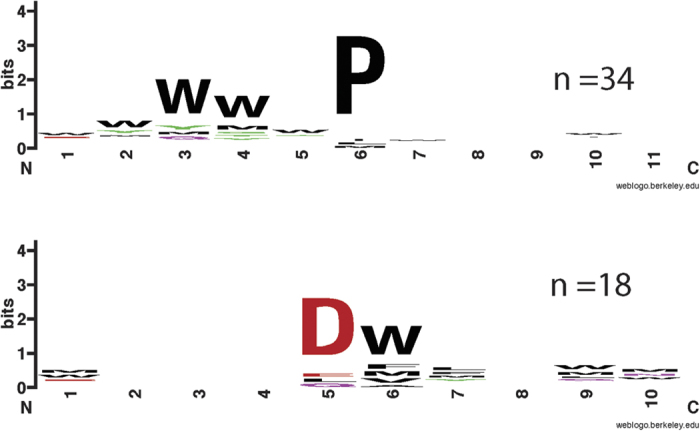
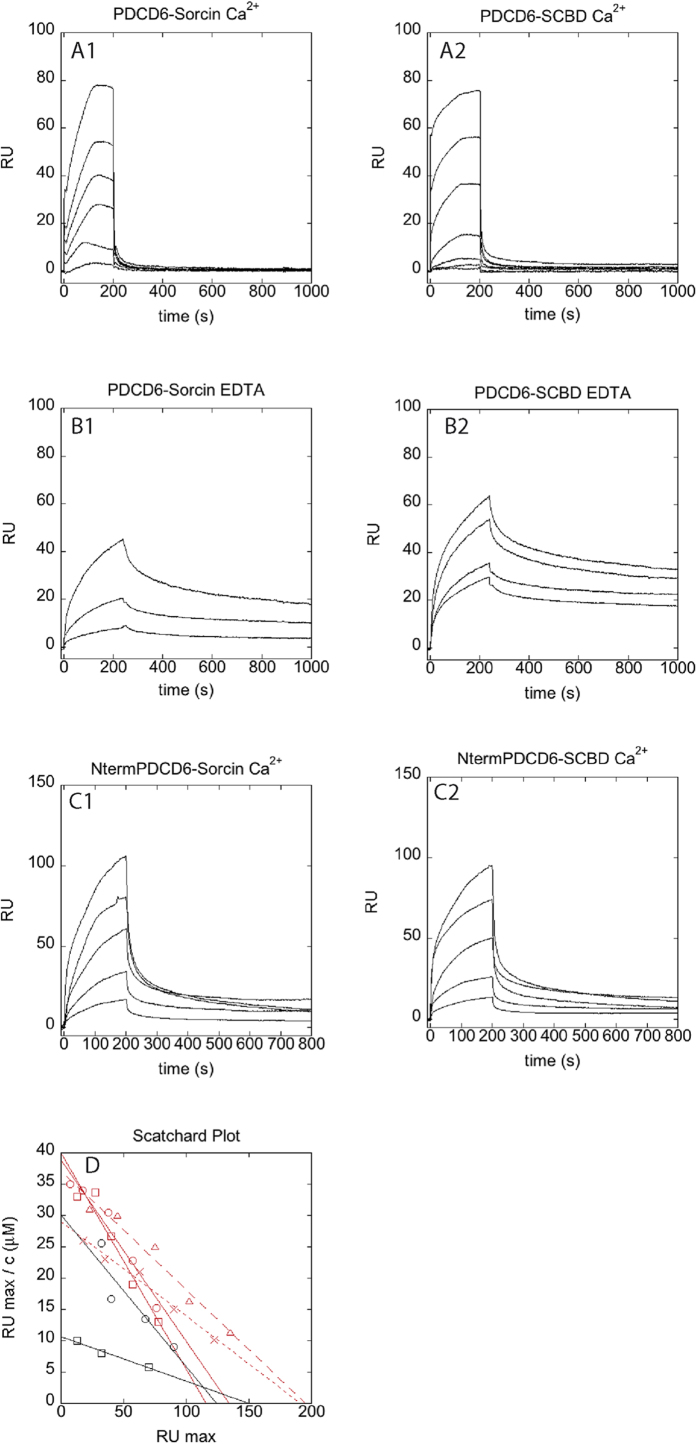
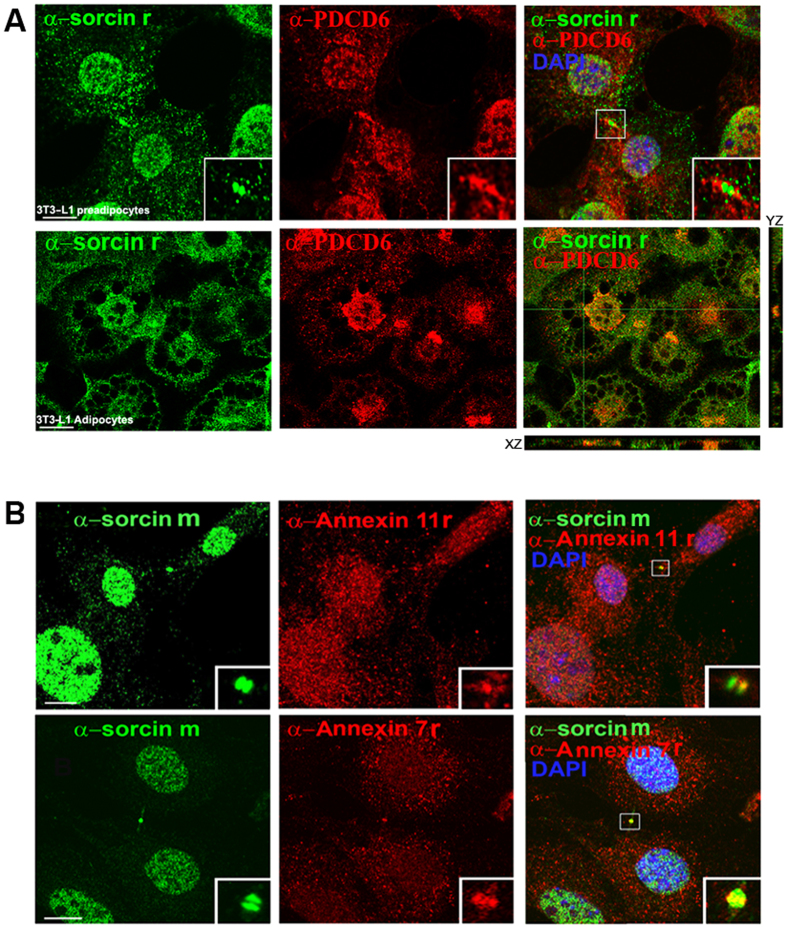
Sorcin is an essential penta-EF hand calcium binding protein, able to confer the multi-drug resistance phenotype to drug-sensitive cancer cells and to reduce Endoplasmic Reticulum stress and cell death. Sorcin silencing blocks cell cycle progression in mitosis and induces cell death by triggering apoptosis. Sorcin participates in the modulation of calcium homeostasis and in calcium-dependent cell signalling in normal and cancer cells. The molecular basis of Sorcin action is yet unknown. The X-ray structures of Sorcin in the apo (apoSor) and in calcium bound form (CaSor) reveal the structural basis of Sorcin action: calcium binding to the EF1-3 hands promotes a large conformational change, involving a movement of the long D-helix joining the EF1-EF2 sub-domain to EF3 and the opening of EF1. This movement promotes the exposure of a hydrophobic pocket, which can accommodate in CaSor the portion of its N-terminal domain displaying the consensus binding motif identified by phage display experiments. This domain inhibits the interaction of sorcin with PDCD6, a protein that carries the Sorcin consensus motif, co-localizes with Sorcin in the perinuclear region of the cell and in the midbody and is involved in the onset of apoptosis.


Figures

Figure 1
Figure 1. Overall structure of calcium-bound human Sorcin.
(A) The monomer comprises a part of the flexible N-terminal domain containing an alpha helical region designated α0 (red) and a calcium-binding domain (SCBD) that can be divided in two region: EF1-3 (blue) and EF4-5 (green). Calcium ions (yellow spheres) are bound at EF1, EF2 and EF3. The helices (A-H) and the EF-hands (EF1-5) are indicated. (B) Dimerization occurs through the pairing of EF4-5 of two monomers (cyan and magenta). The N-terminal hexapeptide modeled in the structure is shown as green sticks.
Figure 2
Figure 2. Calcium coordination in Sorcin.
Close-up of Ca2+ binding sites in EF1 (A), EF2 (B) and EF3 (C) reveals the classical pentagonal bipyramidal geometry. The involved residues are shown as sticks, water molecules as red spheres and calcium ions as yellow spheres. Ligand positions and coordination distances are listed.
Figure 3
Figure 3. Conformational changes induced by ion binding.
The superposition of CaSor (magenta) and apoSor (blue) reveals the conformational variation induced by calcium (yellow spheres). The green arrows represent the axis of the D helix in the two structures: the binding of three Ca2+ to each Sorcin monomer causes a large movement of the D helix that drags the EF1-EF2 region. The panels illustrate the changes of EF1, EF2 and EF3 taken alone, analysed aligning the C-terminal helix for each EF-hand: EF1 and EF3 open upon Ca2+-binding, while EF2 is almost unchanged.
Figure 4
Figure 4. Solvent accessible surface analysis and hot-spots prediction.
(A) The residues that upon calcium binding become more accessible (SASA increase higher than 30%) are mapped as red sticks on CaSor structure; Tyr67 and Met86 show the strongest variation. (B) In apoSor (blue) Tyr67 forms a hydrogen bond with Asp113. In CaSor (magenta) the hydrogen bond is broken and the loop moves away together with helix B and the EF1-EF2 region. (C) Hotpatch analysis identified 3 pockets (pocket 1, magenta; pocket 2, red; pocket 3, orange) likely mediating protein-protein interactions.
Figure 5
Figure 5. Interaction between Sorcin and the N-terminal peptide.
(A) The electrostatic surface potential (blue-positive, red-negative) of CaSor dimer is shown. The hydrophobic surface corresponding to pockets 1–2 accommodates the 12-GYYPGG-17 peptide (green) plausibly belonging to an adjacent Sorcin molecule in the crystal (green cartoon); the residues 11–25 are not visible (green dashes). (B) Close-up of the peptide-binding region: the peptide is shown as green sticks, the residues interacting with the peptide are depicted as magenta sticks, and the hydrogen bonds between Trp105-Tyr17 and Glu97-Tyr17 are indicated as black dashes. (C,D) Two views of the electron density map of the peptide (2Fo-Fc, contoured at 1σ).
Figure 6
Figure 6. Peptide binding and pockets comparison in CaSor and PDCD6.
(A) The superimposition of CaSor (magenta; calcium in yellow, peptide in green) and PDCD6 (teal; zinc in grey) in complex with Alix peptide (yellow) shows that the protein have a similar conformation and that both peptides bind in pocket 2 but in opposite direction, as indicated by arrows. (B) The main residues lining pocket 2 are shown (Sorcin numbering); note the presence of Val101 instead of Tyr91. (C) The pockets predicted by Hotpatch in CaSor (left, same color code as Fig. 4C) and the pockets found in PDCD6 (right) by co-crystallization with Alix peptide (yellow) and Sec31A peptide (cyan) are mapped on the surfaces and indicated by arrows. (D) Structural alignment of Sorcin and PDCD6. The residues corresponding to the hexapeptide are in bold. The residues lining the pockets are colored accordingly and the ones present in both sequences are underlined.
Figure 7
Figure 7. WebLogo outputs of consensus peptide motifs identified through peptide phage display.
(A) The Φ/Gly/Met-Φ/Gly/Met-x-P motif is based on 34 unique peptide sequences, of which 20 were obtained from a phage selection performed in the presence of 1 mM Ca2+. (B) The acidic-Φ motif is from 18 unique peptides of which 16 were selected in presence of Ca2+.
Figure 8
Figure 8. Interaction of Sorcin with full-length PDCD6 and N-terminus of PDCD6.
(A) Sensorgrams showing the interaction between PDCD6, immobilized on a COOH5 chip and different concentrations of Sorcin (left panel; from bottom to top: 200 nM, 400 nM, 800 nM, 1.5 μM, 3 μM, 6 μM), and SCBD (right panel; from bottom to top: 50 nM, 100 nM, 200 nM, 500 nM, 1 μM, 2.5 μM, 5 μM), in the presence of 100 μM calcium. (B) Sensorgrams showing the interaction between PDCD6, immobilized on a COOH5 chip and different concentrations of Sorcin (left panel: from bottom to top: 1.3 μM, 4 μM, 12 μM), and SCBD (right panel: from bottom to top: 1.25 μM, 2.5 μM, 5 μM, 10 μM), in the presence of 1 mM EDTA. (C) Sensorgrams showing the interaction between the N-terminal domain of PDCD6, immobilized on a COOH5 chip and different concentrations of Sorcin (left panel; from bottom to top: 750 nM, 1.5 μM, 3 μM, 6 μM, 12 μM), and SCBD (right panel; from bottom to top: 750 nM, 1.5 μ μM, 3 μM, 6 μM, 12 μM), in the presence of 100 μM calcium. (D) Scatchard plots of the experiments in Fig. 8A–C, and linear fittings. Red squares: PDCD6-Sorcin interaction in the presence of 100 μM calcium; red circles: PDCD6-SCBD interaction in the presence of 100 μM calcium black squares: PDCD6-Sorcin interaction in the presence of 1 mM EDTA; black circles: PDCD6-SCBD interaction in the presence of 1 mM EDTA; red triangles: N-terminal domain of PDCD6-Sorcin interaction in the presence of 100 μM calcium; red crosses: N-terminal domain of PDCD6-SCBD interaction in the presence of 100 μM calcium.
Figure 9
Figure 9. Colocalization of Sorcin with PDCD6 and annexins 7 and 11.
(A) Experiments showing co-localization between sorcin (rabbit α-sorcin, green) and PDCD6 (mouse α-PDCD6, red), in 3T3-L1 preadipocytes in cytokinesis (top panel) and differentiated 3T3-L1 adipocytes (bottom panel) in X and Z axes. Bars: 10 μm. Note the colocalization in the midbody of 3T3-L1 preadipocytes and in the perinuclear region of adipocytes. (B) Experiments showing co-localization between Sorcin (mouse α-sorcin, green) and annexin11 (top panel: rabbit α-annexin11, red), or annexin7 (bottom panel: rabbit α-annexin7, red), in 3T3-L1 preadipocytes in cytokinesis. Bars: 10 μm. Note the colocalization in the midbody (arrows and insets).

References

    1. Colotti G. et al. Sorcin, a calcium binding protein involved in the multidrug resistance mechanisms in cancer cells. Molecules 19, 13976–89 (2014). - PMC - PubMed
    1. Nagpal J. K. & Das B. R. Identification of differentially expressed genes in tobacco chewing-mediated oral cancer by differential display-polymerase chain reaction. Eur J Clin Invest 37, 658–64 (2007). - PubMed
    1. Pomeroy S. L. et al. Prediction of central nervous system embryonal tumour outcome based on gene expression. Nature 415, 436–42 (2002). - PubMed
    1. Yokota T. et al. Identification of histological markers for malignant glioma by genome-wide expression analysis: dynein, alpha-PIX and sorcin. Acta Neuropathol 111, 29–38 (2006). - PubMed
    1. Zhao P. et al. Comparative proteomic analysis of anti-benzo(a)pyrene-7,8-dihydrodiol–9,10-epoxide-transformed and normal human bronchial epithelial G0/G1 cells. Chem Biol Interact 186, 166–73 (2010). - PubMed

Publication types

MeSH terms

LinkOut - more resources