. 2016 Feb;37(2):570-88.
doi: 10.1002/hbm.23052. Epub 2015 Nov 18.

The effects of dexamphetamine on the resting-state electroencephalogram and functional connectivity

Affiliations

The effects of dexamphetamine on the resting-state electroencephalogram and functional connectivity

Matthew A Albrecht et al. Hum Brain Mapp. 2016 Feb.

Abstract

The catecholamines-dopamine and noradrenaline-play important roles in directing and guiding behavior. Disorders of these systems, particularly within the dopamine system, are associated with several severe and chronically disabling psychiatric and neurological disorders. We used the recently published group independent components analysis (ICA) procedure outlined by Chen et al. (2013) to present the first pharmaco-EEG ICA analysis of the resting-state EEG in healthy participants administered 0.45 mg/kg dexamphetamine. Twenty-eight healthy participants between 18 and 41 were recruited. Bayesian nested-domain models that explicitly account for spatial and functional relationships were used to contrast placebo and dexamphetamine on component spectral power and several connectivity metrics. Dexamphetamine led to reductions across delta, theta, and alpha spectral power bands that were predominantly localized to Frontal and Central regions. Beta 1 and beta 2 power were reduced by dexamphetamine at Frontal ICs, while beta 2 and gamma power was enhanced by dexamphetamine in posterior regions, including the parietal, occipital-temporal, and occipital regions. Power-power coupling under dexamphetamine was similar for both states, resembling the eyes open condition under placebo. However, orthogonalized measures of power coupling and phase coupling did not show the same effect of dexamphetamine as power-power coupling. We discuss the alterations of low- and high-frequency EEG power in response to dexamphetamine within the context of disorders of dopamine regulation, in particular schizophrenia, as well as in the context of a recently hypothesized association between low-frequency power and aspects of anhedonia. Hum Brain Mapp 37:570-588, 2016. © 2015 Wiley Periodicals, Inc.

Keywords: ADHD; Bayesian; Parkinson's; anhedonia; dopamine; noradrenaline; orthogonalized connectivity; psychosis; schizophrenia.


Figures

Figure 1
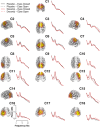
Figure 1
Source localization and power spectra of each independent component derived from the group ICA procedure. [Color figure can be viewed in the online issue, which is available at http://wileyonlinelibrary.com.]
Figure 2
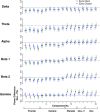
Figure 2
Standardized component power contrasts. Dexamphetamine minus placebo power contrasts (+95% HDIs) obtained from the hierarchical nested domain model for each independent component. Credible effects are denoted by the 95% HDI excluding 0 (N = 28). [Color figure can be viewed in the online issue, which is available at http://wileyonlinelibrary.com.]
Figure 3
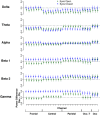
Figure 3
Standardized channel power contrasts. Dexamphetamine minus placebo power contrasts (+95% HDIs) obtained from the hierarchical nested domain model for the channel data. Credible effects are denoted by the 95% HDI excluding 0 (N = 28). [Color figure can be viewed in the online issue, which is available at http://wileyonlinelibrary.com.]
Figure 4
Figure 4
Power–power coupling. Left: power–power connectivity matrices for the eyes closed (above the diagonal red line) and eyes open (below the diagonal red line) resting‐state conditions for placebo and dexamphetamine. Presented are the raw correlations or connectivity metrics averaged over each condition. Right: connectivity maps for the eyes closed and eyes open resting‐state conditions for placebo and dexamphetamine. For the noncontrast maps, the lines are filtered at p < 0.0001. For the contrast maps, the lines are filtered based on the 95% HDI from the hierarchical Bayesian model excluding 0. See methods for Type I error properties of this method (N = 28). [Color figure can be viewed in the online issue, which is available at http://wileyonlinelibrary.com.]
Figure 5
Figure 5
Orthogonalized power–power coupling. Left: orthogonalized power–power connectivity matrices for the eyes closed (above the diagonal red line) and eyes open (below the diagonal red line) resting‐state conditions for placebo and dexamphetamine. Presented are the raw correlations or connectivity metrics averaged over each condition. Right: connectivity maps for the eyes closed and eyes open resting‐state conditions for placebo and dexamphetamine. For the noncontrast maps, the lines are filtered at p < 0.0001. For the contrast maps, the lines are filtered based on the 95% HDI from the hierarchical Bayesian model excluding 0 (N = 28). [Color figure can be viewed in the online issue, which is available at http://wileyonlinelibrary.com.]
Figure 6
Figure 6
Debiased weighted phase lag index (DWPLI). Left: DWPLI connectivity matrices for the eyes closed (above the diagonal red line) and eyes open (below the diagonal red line) resting‐state conditions for placebo and dexamphetamine. Presented are the raw correlations or connectivity metrics averaged over each condition. Right: connectivity maps for the eyes closed and eyes open resting‐state conditions for placebo and dexamphetamine. For the noncontrast maps, the lines are filtered at p < 0.0001. For the contrast maps, the lines are filtered based on the 95% HDI from the hierarchical Bayesian model excluding 0 (N = 28). [Color figure can be viewed in the online issue, which is available at http://wileyonlinelibrary.com.]
Figure 7
Figure 7
Graph theoretic metrics. Dexamphetamine‐placebo contrast estimates for each graph theoretic metric. Presented are the means and 95% HDI obtained from the hierarchical Bayesian model. Credible effects are denoted by the 95% HDI excluding 0 (N = 28). [Color figure can be viewed in the online issue, which is available at http://wileyonlinelibrary.com.]

References

    1. Abi‐Dargham A, van de Giessen E, Slifstein M, Kegeles LS, Laruelle M (2009): Baseline and amphetamine‐stimulated dopamine activity are related in drug‐naïve schizophrenic subjects. Biol Psychiatry 65:1091–1093. - PubMed
    1. Albrecht MA, Martin‐Iverson MT, Price G, Lee J, Iyyalol R (2011a): Dexamphetamine‐induced reduction of P3a and P3b in healthy participants. J Psychopharmacol (Oxf) 25:1623–1631. - PubMed
    1. Albrecht MA, Martin‐Iverson MT, Price G, Lee J, Iyyalol R, Waters F (2011b): Dexamphetamine effects on separate constructs in the rubber hand illusion test. Psychopharmacology (Berl) 217:39–50. - PubMed
    1. Albrecht MA, Price G, Lee J, Iyyalol R, Martin‐Iverson MT (2012): Dexamphetamine reduces auditory P3 delta power and phase‐locking while increasing gamma power. Eur Neuropsychopharmacol 22:734–746. - PubMed
    1. Albrecht M, Price G, Lee J, Iyyalol R, Martin‐Iverson M (2013): Dexamphetamine selectively increases 40 Hz auditory steady state response power to target and nontarget stimuli in healthy humans. J Psychiatry Neurosci 38:24–32. - PMC - PubMed

Publication types

Substances