

Application of artificial neural network to investigate the effects of 5-fluorouracil on ribonucleotides and deoxyribonucleotides in HepG2 cells
- PMID: 26578061
- PMCID: PMC4649619
- DOI: 10.1038/srep16861
Application of artificial neural network to investigate the effects of 5-fluorouracil on ribonucleotides and deoxyribonucleotides in HepG2 cells
Abstract
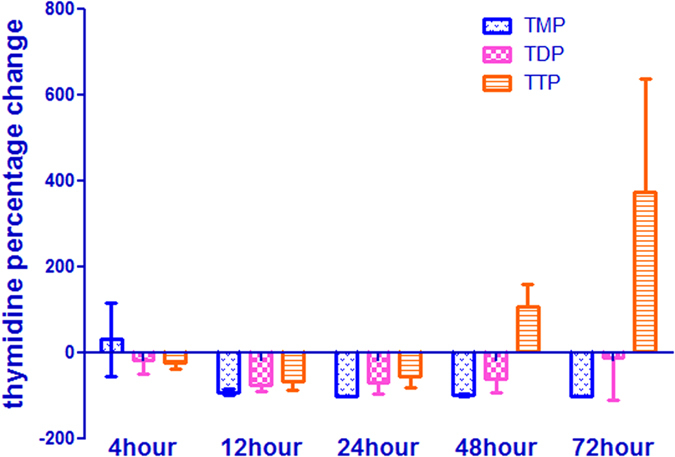
Endogenous ribonucleotides and deoxyribonucleotides are essential metabolites that play important roles in a broad range of key cellular functions. Their intracellular levels could also reflect the action of nucleoside analogues. We investigated the effects of 5-fluorouracil (5-FU) on ribonucleotide and deoxyribonucleotide pool sizes in cells upon exposure to 5-FU for different durations. Unsupervised and supervised artificial neural networks were compared for comprehensive analysis of global responses to 5-FU. As expected, deoxyuridine monophosphate (dUMP) increased after 5-FU incubation due to the inhibition of thymine monophosphate (TMP) synthesis. Interestingly, the accumulation of dUMP could not lead to increased levels of deoxyuridine triphosphate (dUTP) and deoxyuridine diphosphate (dUDP). After the initial fall in intracellular deoxythymidine triphosphate (TTP) concentration, its level recovered and increased from 48 h exposure to 5-FU, although deoxythymidine diphosphate (TDP) and TMP continued to decrease compared with the control group. These findings suggest 5-FU treatment caused unexpected changes in intracellular purine polls, such as increases in deoxyadenosine triphosphate (dATP), adenosine-triphosphate (ATP), guanosine triphosphate (GTP) pools. Further elucidation of the mechanism of action of 5-FU in causing these changes should enhance development of strategies that will increase the anticancer activity of 5-FU while decreasing its resistance.
Figures


Similar articles
-
Pools of deoxyribonucleoside triphosphates in the mitotic cycle of Physarum.Biochim Biophys Acta. 1974 Apr 10;340(4):463-71. doi: 10.1016/0005-2787(74)90067-7. Biochim Biophys Acta. 1974. PMID: 4857593 No abstract available.
-
Role of silicon in diatom metabolism. II. Endogenous nucleoside triphosphate pools during silicic acid starvation of synchronized Cylindrotheca fusiformis.Biochim Biophys Acta. 1973 May 10;308(2):205-11. doi: 10.1016/0005-2787(73)90150-0. Biochim Biophys Acta. 1973. PMID: 4350314 No abstract available.
-
Deoxyribonucleotide pools during liver regeneration.Eur J Biochem. 1973 Feb 15;33(1):36-9. doi: 10.1111/j.1432-1033.1973.tb02651.x. Eur J Biochem. 1973. PMID: 4691352 No abstract available.
-
Genetic effects of deoxyribonucleotide pool imbalances.Environ Mutagen. 1982;4(6):695-725. doi: 10.1002/em.2860040609. Environ Mutagen. 1982. PMID: 6761109 Review. No abstract available.
-
Compartmentation of intracellular nucleotides in mammalian cells.CRC Crit Rev Biochem. 1985;19(1):45-61. doi: 10.3109/10409238509086787. CRC Crit Rev Biochem. 1985. PMID: 2416510 Review.
Cited by
-
Profiling ribonucleotide and deoxyribonucleotide pools perturbed by gemcitabine in human non-small cell lung cancer cells.Sci Rep. 2016 Nov 15;6:37250. doi: 10.1038/srep37250. Sci Rep. 2016. PMID: 27845436 Free PMC article.
-
Effect of Phyllanthus amarus Extract on 5-Fluorouracil-Induced Perturbations in Ribonucleotide and Deoxyribonucleotide Pools in HepG2 Cell Line.Molecules. 2016 Sep 20;21(9):1254. doi: 10.3390/molecules21091254. Molecules. 2016. PMID: 27657029 Free PMC article.
-
The application of artificial neural networks in metabolomics: a historical perspective.Metabolomics. 2019 Oct 18;15(11):142. doi: 10.1007/s11306-019-1608-0. Metabolomics. 2019. PMID: 31628551 Review.
-
Prediction of pKa Values for Neutral and Basic Drugs based on Hybrid Artificial Intelligence Methods.Sci Rep. 2018 Mar 5;8(1):3991. doi: 10.1038/s41598-018-22332-7. Sci Rep. 2018. PMID: 29507318 Free PMC article.
-
Enhanced antineoplastic/therapeutic efficacy using 5-fluorouracil-loaded calcium phosphate nanoparticles.Beilstein J Nanotechnol. 2018 Sep 20;9:2499-2515. doi: 10.3762/bjnano.9.233. eCollection 2018. Beilstein J Nanotechnol. 2018. PMID: 30345213 Free PMC article.
References
-
- Thelander L. & Reichard P. Reduction of ribonucleotides. Annu Rev Biochem. 48, 133–158 (1979). - PubMed
-
- Karlstrom O. & Larsson A. Significance of ribonucleotide reduction in the biosynthesis of deoxyribonucleotides in Escherichia coli. Eur J Biochem. 3, 164–170 (1967). - PubMed
-
- Chen B., Jamieson E. R. & Tullius T. D. A general synthesis of specifically deuterated nucleotides for studies of DNA and RNA. Bioorg Med Chem Lett. 12, 3093–3096 (2002). - PubMed
-
- David J. C. Studies on the affinity of chick embryo DNA ligase for ribonucleotides and deoxyribonucleotides. FEBS Lett. 84, 156–158 (1977). - PubMed
-
- Van Rompay A. R., Johansson M. & Karlsson A. Phosphorylation of nucleosides and nucleoside analogs by mammalian nucleoside monophosphate kinases. Pharmacol Ther. 87, 189–198 (2000). - PubMed
Publication types
MeSH terms
Substances
LinkOut - more resources
Full Text Sources
Other Literature Sources
Research Materials
