

The rate of adaptive evolution in animal mitochondria
- PMID: 26578312
- PMCID: PMC4737298
- DOI: 10.1111/mec.13475
The rate of adaptive evolution in animal mitochondria
Abstract
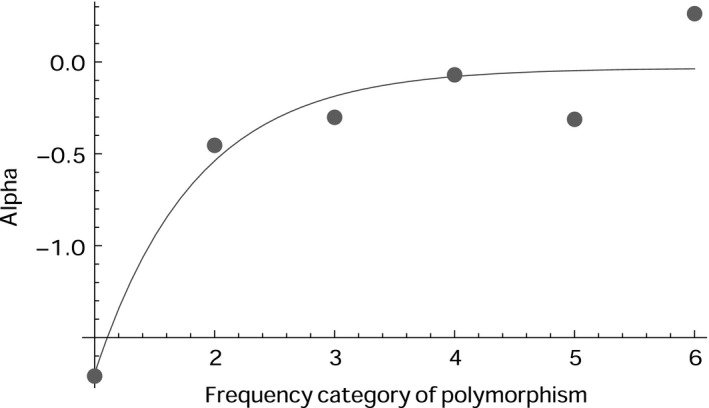
We have investigated whether there is adaptive evolution in mitochondrial DNA, using an extensive data set containing over 500 animal species from a wide range of taxonomic groups. We apply a variety of McDonald-Kreitman style methods to the data. We find that the evolution of mitochondrial DNA is dominated by slightly deleterious mutations, a finding which is supported by a number of previous studies. However, when we control for the presence of deleterious mutations using a new method, we find that mitochondria undergo a significant amount of adaptive evolution, with an estimated 26% (95% confidence intervals: 5.7-45%) of nonsynonymous substitutions fixed by adaptive evolution. We further find some weak evidence that the rate of adaptive evolution is correlated to synonymous diversity. We interpret this as evidence that at least some adaptive evolution is limited by the supply of mutations.
Keywords: adaptive evolution; distribution of fitness effects; genetic diversity; mitochondria; mutation rate; site frequency spectrum.
© 2015 The Authors. Molecular Ecology Published by John Wiley & Sons Ltd.
Figures


Similar articles
-
The McDonald-Kreitman test and slightly deleterious mutations.Mol Biol Evol. 2008 Jun;25(6):1007-15. doi: 10.1093/molbev/msn005. Epub 2008 Jan 14. Mol Biol Evol. 2008. PMID: 18195052
-
Uniparental Inheritance Promotes Adaptive Evolution in Cytoplasmic Genomes.Mol Biol Evol. 2017 Mar 1;34(3):677-691. doi: 10.1093/molbev/msw266. Mol Biol Evol. 2017. PMID: 28025277 Free PMC article.
-
Estimating the rate of adaptive molecular evolution when the evolutionary divergence between species is small.J Mol Evol. 2012 Feb;74(1-2):61-8. doi: 10.1007/s00239-012-9488-1. Epub 2012 Feb 12. J Mol Evol. 2012. PMID: 22327123
-
Linking the mitochondrial genotype to the organismal phenotype.Mol Ecol. 2010 Apr;19(8):1523-39. doi: 10.1111/j.1365-294X.2010.04594.x. Epub 2010 Mar 19. Mol Ecol. 2010. PMID: 20345689 Review.
-
Nonadaptive processes in primate and human evolution.Am J Phys Anthropol. 2010;143 Suppl 51:13-45. doi: 10.1002/ajpa.21439. Am J Phys Anthropol. 2010. PMID: 21086525 Review.
Cited by
-
Positive selection on panpulmonate mitogenomes provide new clues on adaptations to terrestrial life.BMC Evol Biol. 2016 Aug 22;16(1):164. doi: 10.1186/s12862-016-0735-8. BMC Evol Biol. 2016. PMID: 27549326 Free PMC article.
-
Exploiting selection at linked sites to infer the rate and strength of adaptation.Nat Ecol Evol. 2019 Jun;3(6):977-984. doi: 10.1038/s41559-019-0890-6. Epub 2019 May 6. Nat Ecol Evol. 2019. PMID: 31061475 Free PMC article.
-
An efficient and robust ABC approach to infer the rate and strength of adaptation.G3 (Bethesda). 2024 Apr 3;14(4):jkae031. doi: 10.1093/g3journal/jkae031. G3 (Bethesda). 2024. PMID: 38365205 Free PMC article.
-
Genotype to phenotype: Diet-by-mitochondrial DNA haplotype interactions drive metabolic flexibility and organismal fitness.PLoS Genet. 2018 Nov 6;14(11):e1007735. doi: 10.1371/journal.pgen.1007735. eCollection 2018 Nov. PLoS Genet. 2018. PMID: 30399141 Free PMC article. Review.
-
The Genomic Origins of Small Mitochondrial RNAs: Are They Transcribed by the Mitochondrial DNA or by Mitochondrial Pseudogenes within the Nucleus (NUMTs)?Genome Biol Evol. 2019 Jul 1;11(7):1883-1896. doi: 10.1093/gbe/evz132. Genome Biol Evol. 2019. PMID: 31218347 Free PMC article.
References
-
- Ballard JWO, Rand DM (2005) The population biology of mitochondrial DNA and its phylogenetic implications. Annual Review of Ecology, Evolution, and Systematics, 36, 621–642.
-
- Ballard JWO, Whitlock MC (2004) The incomplete natural history of mitochondria. Molecular Ecology, 13, 729–744. - PubMed
-
- Bazin E, Glémin S, Galtier N (2006) Population size does not influence mitochondrial genetic diversity in animals. Science, 312, 570–572. - PubMed
Publication types
MeSH terms
Substances
Associated data
LinkOut - more resources
Full Text Sources
Other Literature Sources
