. 2016 Feb;20(2):266-86.
doi: 10.1111/jcmm.12718. Epub 2015 Nov 18.

Imiquimod-induced apoptosis of melanoma cells is mediated by ER stress-dependent Noxa induction and enhanced by NF-κB inhibition

Affiliations

Imiquimod-induced apoptosis of melanoma cells is mediated by ER stress-dependent Noxa induction and enhanced by NF-κB inhibition

Abdelouahid El-Khattouti et al. J Cell Mol Med. 2016 Feb.

Abstract

Melanoma is characterized by dysregulated intracellular signalling pathways including an impairment of the cell death machinery, ultimately resulting in melanoma resistance, survival and progression. This explains the tumour's extraordinary resistance to the standard treatment. Imiquimod is a topical immune response modifier (imidazoquinoline) with both antiviral and antitumour activities. The mechanism by which imiquimod triggers the apoptosis of melanoma cells has now been carefully elucidated. Imiquimod-induced apoptosis is associated with the activation of apoptosis signalling regulating kinase1/c-Jun-N-terminal kinase/p38 pathways and the induction of endoplasmic stress characterized by the activation of the protein kinase RNA-like endoplasmic reticulum kinase signalling pathway, increase in intracellular Ca(2+) release, degradation of calpain and subsequent cleavage of caspase-4. Moreover, imiquimod triggers the activation of NF-κB and the expression of the inhibitor of apoptosis proteins (IAPs) such as, X-linked IAP (XIAP) together with the accumulation of reactive oxygen species (ROS). Also, imiquimod triggers mitochondrial dysregulation characterized by the loss of mitochondrial membrane potential (Δψm), the increase in cytochrome c release, and cleavage of caspase-9, caspase-3 and poly(ADP-ribose) polymerase (PARP). Inhibitors of specific pathways, permit the elucidation of possible mechanisms of imiquimod-induced apoptosis. They demonstrate that inhibition of NF-kB by the inhibitor of nuclear factor kappa-B kinase (IKK) inhibitor Bay 11-782 or knockdown of XIAP induces melanoma apoptosis in cells exposed to imiquimod. These findings support the use of either IKK inhibitors or IAP antagonists as adjuvant therapies to improve the effectiveness topical imiquimod in the treatment of melanoma.

Keywords: ER stress; NF-κB; apoptosis; imiquimod; melanoma.


Figures

Figure 1
Figure 1
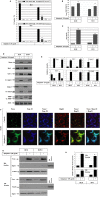
(A) MTT assay demonstrates imiquimod‐induced time dependent growth inhibition of melanoma cell lines BLM and MV3. The cells were treated with imiquimod (50 μg/ml) for the indicated time periods up to 48 hrs. The results are the mean of three independent experiments performed in quadruplicate. (B) Western blot demonstrated the expression of TLR‐7 and TLR9 before and after the exposure of melanoma cells to imiquimod for 48 hrs. Actin was used as an internal control for loading and transfer. (C) Flow cytometry analysis using Ca2+‐sensitive dye‐Fluo3‐AM staining demonstrates intracellular Ca2+ release following the exposure of melanoma cell BLM to imiquimod for 48 hrs. (D) Western blot analysis demonstrates the phosphorylation and the expression levels of PERK, IRE1α, and ATF‐4, the expression of GRP78 and CHOP, and the degradation of calpain and cleavage of caspase‐4 in control and imiquimod‐treated melanoma cells. Actin was used as an internal control for loading and transfer. (E) Densitometric analyses are presented as the relative ratio of phospho‐PERK, phospho‐IRE1α, phospho‐ATF4, ATF4, GRP78, CHOP, Calpain and Cl. casp.‐4 to actin. Bars represent mean ± SD from three blots. *P < 0.05 versus control. (F) EMSA demonstrates the enhancement of the DNA‐binding activity of the transcription factor ATF‐3 in response to the treatment of melanoma cells with imiquimod for 48 hrs. Data are representative of three independent experiments.
Figure 2
Figure 2
(A) Detection of apoptosis in melanoma cells by flow cytometry analysis using annexin/PI staining following the incubation of BLM and MV3 cell lines with imiquimod for 48 hrs. Data are representative of three independent experiments. (B) Loss of mitochondrial membrane potential in BLM and MV3 melanoma cells. BLM and MV3 melanoma cells were treated with imiquimod and stained with JC‐1 followed by flow cytometry analysis. Melanoma cells with intact mitochondria displayed high red and high green fluorescence and appeared in the upper right quadrant of the scatter plots. In contrast, cells that had lost their mitochondrial membrane potential displayed high green and low red fluorescence and appeared in the lower right quadrant. Data were represented as mean ± SD of three independent experiments. **P < 0.01, significantly different when compared with control cells. (C) Flow cytometry analysis demonstrates imiquimod‐induced ROS accumulation in BLM and MV3 using dihydrorhodamine (DHR 123). Data represented as mean ± SD of three independent experiments. **P < 0.01, significantly different when compared with control cells. (D) Western blot analysis demonstrates the induction of Noxa expression and the suppression of Mcl‐1, the increase of cytochrome c release (as assessed in the cytosol), cleavage of caspase‐9, caspase‐3 and PARP in response to the treatment of BLM and MV3 cells with imiquimod for 48 hrs. Actin was used as an internal control for loading and transfer. Data are representative of three independent experiments. (E) Analyses of band intensity on films are presented as the relative ratio of Noxa, Cyt. C, Cl. casp.3, Mcl‐1, Cl. casp.9 and Cl. PARP to actin. Bars represent mean ± SD from three blots. *P < 0.05 versus control. (F) Subcellular localization of Noxa protein to mitochondria and endoplasmic reticulum. Immune fluorescence: BLM cells were treated with imiquimod for 48 hrs before the staining with anti‐ Noxa, Tom20 (mitochondrial marker), Bap31 (ER marker). The subcellular localization of Noxa (green) to mitochondria (blue) and the overlay of Noxa with Tom20 staining demonstrates the localization of Noxa to mitochondria (turquoise), when compared to the control cells, and the subcellular localization of Noxa (green) to ER (red) and the overlay of Noxa with Bap31 staining demonstrates the localization of Noxa to ER (yellow), when compared to control cells, in addition to the overly of Noxa, Tom20 and Bap31 show the subcellular localization of Noxa to both mitochondria and ER. (G) Western blot analysis of mitochondrial (Mit. fraction) and ER fraction (ER fraction) isolated from both BLM and MV3 cells following the treatment with imiquimod for 48 hrs. The detection of Noxa in mitochondria and ER fractions derived from BLM and MV3 after the exposure to imiquimod confirms the localization of Noxa protein to both mitochondria and ER. The purity of the fractions was verified by the detection of the mitochondrial protein Tom20 and the ER marker Bap31in the corresponding fractions. Data are representative of three independent experiments. (H) Analyses of band intensity on films are presented as the relative ratio of Noxa to Tom20 in mitochondrial fraction and Noxa to Bap31 in ER fraction. Bars represent mean ± SD from three blots. *P < 0.05 versus control.
Figure 3
Figure 3
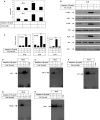
(A) Western blot analysis demonstrates the phosphorylation of ASK1, JNK, p38 and ERK1/2 without the alteration of their basal expression in response to the treatment of melanoma cells with imiquimod for 48 hrs. Actin was used as an internal control for loading and transfer. (B) Analyses of band intensity on films are presented as the relative ratio of phospho‐PERK, phosphor‐ASK1, phosph‐JNK, phosphor‐p38 and phosphor‐ERK1/2 to actin. Bars represent mean ± SD from three blots. *P < 0.05 versus control. EMSA demonstrates the induction of the DNA‐binding activities of the transcription factors AP‐1 (C and D), ATF‐2 (E and F), p53 (G and H) and ELK‐1 (I and J) in BLM and MV3 cells before and after the exposure to imiquimod for 48 hrs. Data are representative of three independent experiments.
Figure 4
Figure 4
(A) Western blot analysis demonstrates the phosphorylation of IκBα and its subsequent degradation and the induction of XIAP in response to the treatment of melanoma cells with imiquimod for 48 hrs. Actin was used as an internal control for loading and transfer. EMSA demonstrates the activation of the nuclear transcription factor NF‐κB in BLM (B) and MV3(C) melanoma cells in response to the treatment with imiquimod. Data are representative of three independent experiments yielding similar results. (D) Analyses of band intensity on films are presented as the relative ratio of phospho‐IκBα, and expression of IκBα, XIAP to actin. Bars represent mean ± SD from three blots. *P < 0.05 versus control. (E) Luciferase reporter assay demonstrates imiquimod‐induced activation of NF‐κB in both melanoma cell lines, BLM and MV3. Data represented as mean ± SD of three independent experiments. **P < 0.01, significantly different when compared with control cells. (F) RTPCR demonstrates the induction of both IL‐6 and IL‐8 expression, the target genes of NFkB in response to the treatment of both BLM and MV3 cells with imiquimod. Data are representative of three independent experiments.
Figure 5
Figure 5
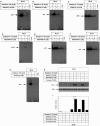
(A) Flow cytometry analysis demonstrates the inhibition of imiquimod‐induced ROS accumulation in response to the pre‐treatment of melanoma cell lines BLM and MV3 with the scavenger of ROS (NAC). Data represented as mean ± SD of three independent experiments. *P < 0.05 versus control, P < 0.05 versus NAC, # P < 0.05 versus NAC + imiquimod. (B) Demonstrates the inhibition of imiquimod‐induced phosphorylation of ASK1, JNK and p38 in BLM cells in response to the inhibition of ROS accumulation by NAC without to influence the basal expression. Actin was used as an internal control for loading and transfer. (C) Analyses of band intensity on films are presented as the relative ratio of phospho‐ASK1, phosphor‐JNK and phospho‐p38 to actin. Bars represent mean ± SD from three blots. *P < 0.05 versus control, P < 0.05 versus NAC, # P < 0.05 versus NAC + imiquimod. EMSA demonstrates the inhibition of imiquimod‐induced activation of the transcription factors AP‐1 (D), ATF‐2 (E), p53 (F) and NF‐κB (G), but not those of the transcription factor ATF‐3 (H) in response to the pre‐treatment of the melanoma cell line BLM with NAC. Results are representative of two independent experiments with identical results.
Figure 6
Figure 6
The activation of ASK1‐JNK and PERKIRE1α pathways are essential for the modulation of imiquimod‐induced expression of Noxa protein in melanoma cells. EMSA demonstrates that the pre‐treatment of melanoma cell line BLM with the inhibitor of JNK (SP600125) inhibits imiquimod‐ induced DNA‐binding activity of the transcription factors AP‐1 (A) and p53 (B), but not the induced DNA‐binding activity of the transcription factor ATF‐2 (C). Whereas, the pre‐treatment of the melanoma cell line BLM with the inhibitor of p38 (SB203580) inhibits imiquimod‐induced activity of the transcription factor ATF‐2 (D), but not those of the transcription factors AP‐1 (E) or p53 (F). (G) EMSA demonstrates the inhibition of imiquimod‐induced DNA‐binding activity of the transcription factor ATF‐3 in response to the pre‐treatment of the melanoma cell line BLM with the inhibitor of IRE1α (irestatin). (H) Western blot analysis demonstrates the inhibition of imiquimod‐induced expression of Noxa in response to the pre‐treatment of BLM cells with the inhibitor of JNK or IRE1α, but not by the inhibitor of p38. Actin is used as an internal control for loading and transfer. Data are representative of three independent experiments. (I) Analyses of band intensity on films are presented as the relative ratio of phospho‐IκBα, and expression of IκBα, XIAP to actin. Bars represent mean ± SD from three blots. *P < 0.05 versus control. # P < 0.05 versus SP600125, P < 0.05 versus Irestatin, ¤ P < 0.05 versus SP600125 + imiquimod, ± P < 0.05 versus Irestatin + imiquimod.
Figure 7
Figure 7
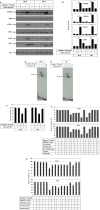
(A) Western blot analysis demonstrates the inhibition of imiquimod‐induced phosphorylation of PERK and IRE1α, the expression and phosphorylation of ATF‐4 in melanoma cell lines in response to the treatment with 4‐PBA, the inhibitor of ER stress. (B) Analyses of band intensity on films are presented as the relative ratio of phospho‐PERK, phospho‐IRE1α, phospho‐ATF4 and ATF4 to actin. Bars represent mean ± SD from three blots. *P < 0.05 versus control. # P < 0.05 versus 4‐PBA, P < 0.05 versus 4‐PBA+imiquimod. EMSA demonstrates the inhibition of imiquimod‐induced NF‐κB activation in BLM (C) and MV3 (D) cell lines in response to the treatment with 4‐PBA. (E) MTT assay demonstrates the abrogation of imiquimod‐induced death of both BLM and MV3 cells in response to the treatment with 4‐PBA, the inhibitor of ER stress. (F) MTT assay demonstrates the inhibition of imiquimod‐induced cell death, in part, by the pre‐treatment of melanoma cell lines BLM and MV3 with the inhibitors of PERK (GSK2606414), calpain (ALLM), ROS (NAC) and completely by the combination of the inhibitors of PERK, ROS with the inhibitor of calpain, whereas, the pre‐treatment of melanoma cells with inhibitor of NF‐κB pathway (Bay11‐7082) or the knockdown of XIAP by its specific siRNA enhance imiquimod‐induced apoptosis. (G) MTT assay demonstrated the inhibition of imiquimod‐induced cell death, in part, by the pre‐ treatment of melanoma cells with the inhibitors of JNK (SP600125), calpain (ALLM) or IRE1α (irestatin), but not with the inhibitor of p38 (SB203580). Whereas, the combination of the inhibitor of caplain with either JNK or IRE1α inhibitors results in the abrogation of imiquimod‐induced apoptosis of melanoma cell lines BLM or MV3. Data presented are the mean ± SD of three independent experiments performed in duplicate.
Figure 8
Figure 8
Effect of Noxa knockdown on imiquimod‐induced apoptosis of melanoma cells. (A) Western blot analysis demonstrates the efficiency of siRNA for imiquimod‐induced expression of Noxa. Actin was used as an internal control for loading and transfer. (B) Analyses of band intensity on films are presented as the relative ratio of Noxa to actin. Bars represent mean ± SD from three blots. *P < 0.05 versus control/scremble. # P < 0.05 versus siRNA, P < 0.05 versus siRNA + imiquimod. (C) Flow cytometry analysis demonstrates that the knockdown of Noxa expression blocks imiquimod‐induced apoptosis of both melanoma cell lines BLM and MV3. Data are representative of three‐independent experiments performed separately.
Figure 9
Figure 9
Proposed model for imiquimod‐induced apoptosis of melanoma cells. Binding of imiquimod to TLR7 and/or TLR9 results in the induction of ER stress leading to the activation of PERK, increase of intracellular Ca2+ release and accumulation of reactive oxygen species (ROS). The activation of PERK leads to IRE1α activity that, in turn, triggers the activation of NF‐κB pathway and ATF‐4. The activation of NF‐κB pathway results in the expression of the inhibitor of apoptosis, XIAP protein, whereas the activation of ATF‐4 results in the activation of the transcription factor ATF‐3 essential for the transcriptional activation of pro‐apoptotic proteins as well as CHOP. The increased level of cytoplasmic Ca2+ results in calpain degradation that subsequently initiates cleavage of caspase‐4, caspase‐9, caspase‐3 and finally PARP. Furthermore, imiquimod‐induced ROS accumulation results in activation of both NF‐κB and ASK1‐JNK/p38 pathways. The activation of ASK1‐JNK/p38 pathway leads to the activation of the transcription factors AP‐1, ATF‐2 and p53. Formation of a transcriptional complex of either AP‐1, p53 and ATF‐3 results in transcriptional activation of Noxa. As a consequence, Noxa localizes on both mitochondria and ER leading to mitochondrial dysregulation and ER stress respectively. The localization of Noxa to ER results in a feedback further increasing ER stress. In turn, mitochondria localization of Noxa triggers the loss of mirochondrial membrane potential (Δψm) and mitochondrial outer membrane permeability (MOMP) characterized by cytochrome c release, cleavage of caspases‐9, caspase‐3 and PARP, altogether evidence for the occurrence of apoptosis.

Similar articles

Cited by

References

    1. Kemper K, Krijgsman O, Cornelissen‐Steijger P, et al Intra‐ and inter‐tumor heterogeneity in a vemurafenib‐resistant melanoma patient and derived xenografts. EMBO. 2015; 7: 1104–18. Doi:10.15252/emmm.201404914. - DOI - PMC - PubMed
    1. Partl R, Fastner G, Kaiser J, et al KPS/LDH index: a simple tool for identifying patients with metastatic melanoma who are unlikely to benefit from palliative whole brain radiotherapy. Support Care Cancer. 2015; Doi:10.1007/s00520‐015‐2793‐7. - DOI - PubMed
    1. Massi D, Brusa D, Merelli B, et al The status of PD‐L1 and tumor‐infiltrating immune cells predict resistance and poor prognosis in BRAFi‐treated melanoma patients harboring mutant BRAFV600. Ann Oncol. 2015; 72: 37–46. - PubMed
    1. Kessler DA, Austin RH, Levine H. Resistance to chemotherapy: patient variability and cellular heterogeneity. Cancer Res. 2014; 74: 4663–70. - PubMed
    1. Phadke MS, Sini P, Smalley KS. The novel ATP‐competitive MEK/aurora kinase inhibitor BI‐847325 overcomes acquired BRAF inhibitor resistance through suppression of Mcl‐1 and MEK expression. Mol Cancer Ther. 2015; 14: 1354–64. - PMC - PubMed

Publication types

MeSH terms