

Time course of the response to ACTH in pig: biological and transcriptomic study
- PMID: 26578410
- PMCID: PMC4650497
- DOI: 10.1186/s12864-015-2118-8
Time course of the response to ACTH in pig: biological and transcriptomic study
Abstract
Background: HPA axis plays a major role in physiological homeostasis. It is also involved in stress and adaptive response to the environment. In farm animals in general and specifically in pigs, breeding strategies have highly favored production traits such as lean growth rate, feed efficiency and prolificacy at the cost of robustness. On the hypothesis that the HPA axis could contribute to the trade-off between robustness and production traits, we have designed this experiment to explore individual variation in the biological response to the main stress hormone, cortisol, in pigs. We used ACTH injections to trigger production of cortisol in 120 juvenile Large White (LW) pigs from 28 litters and the kinetics of the response was measured with biological variables and whole blood gene expression at 4 time points. A multilevel statistical analysis was used to take into account the longitudinal aspect of the data.
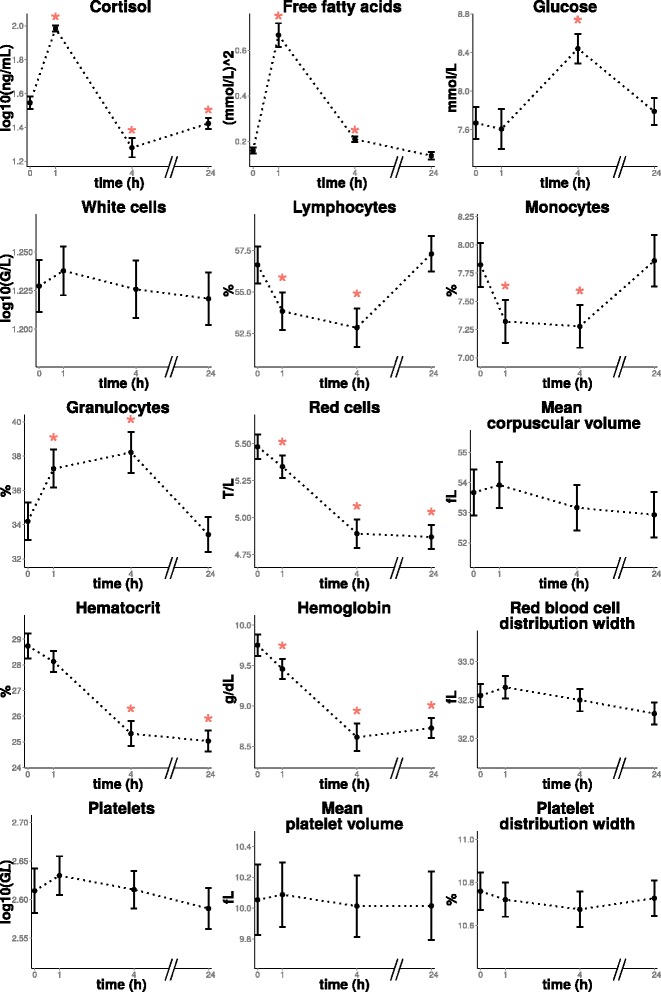
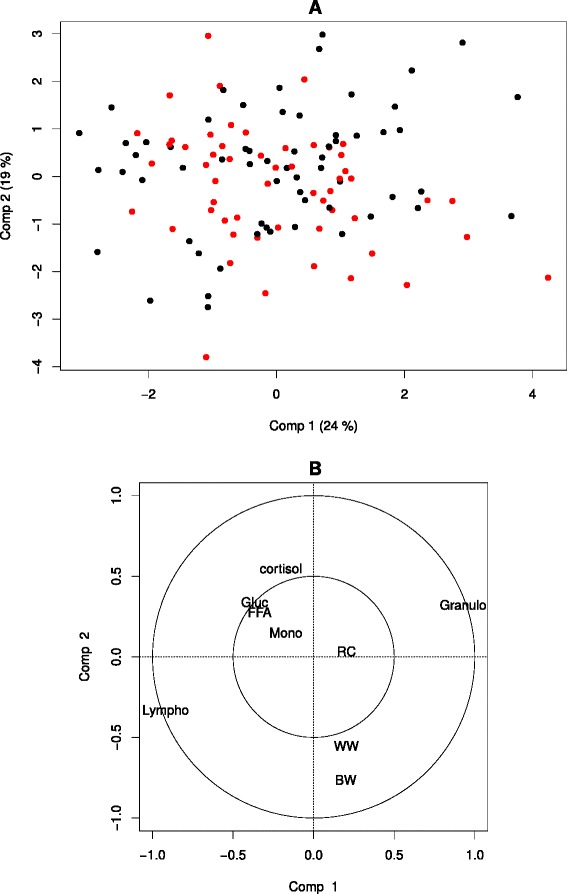
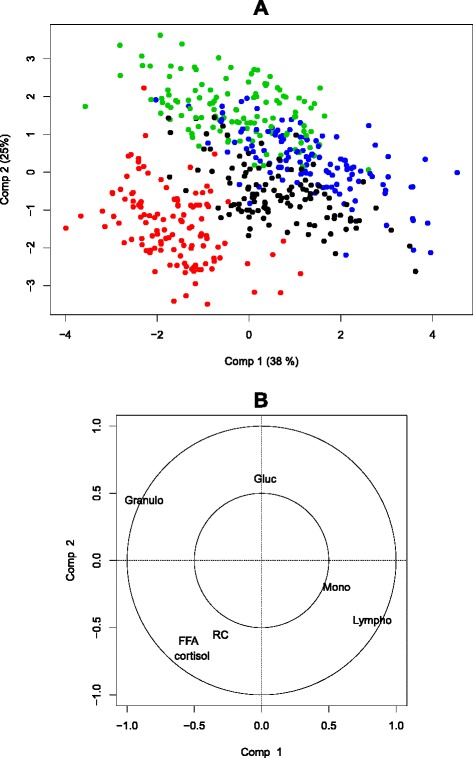
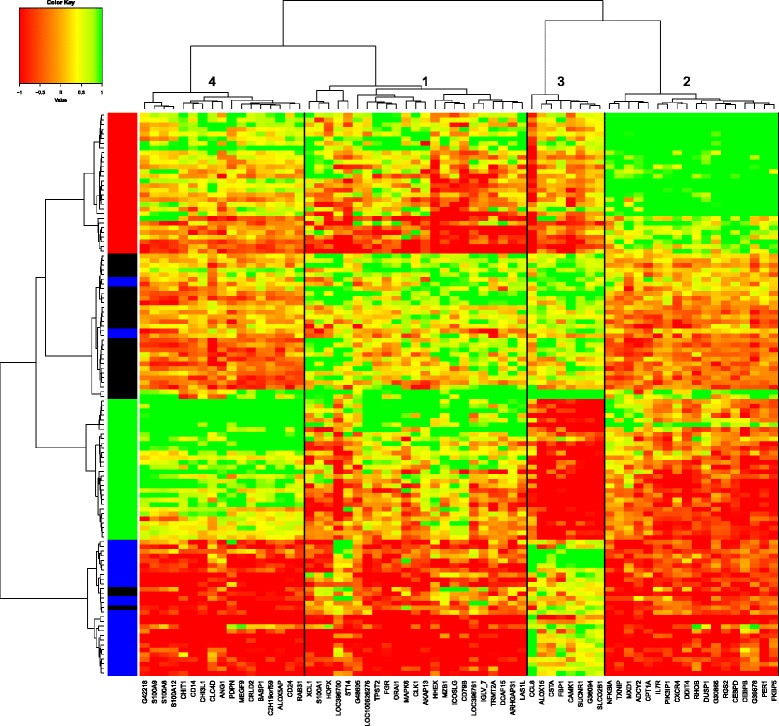
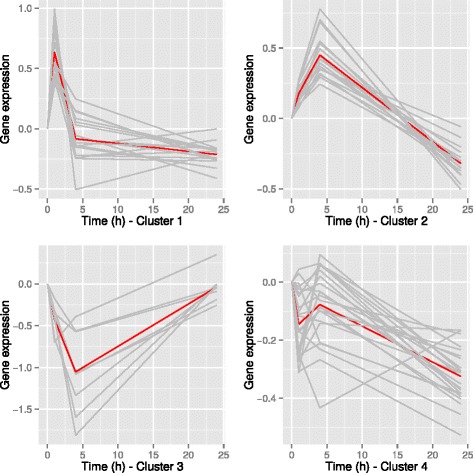
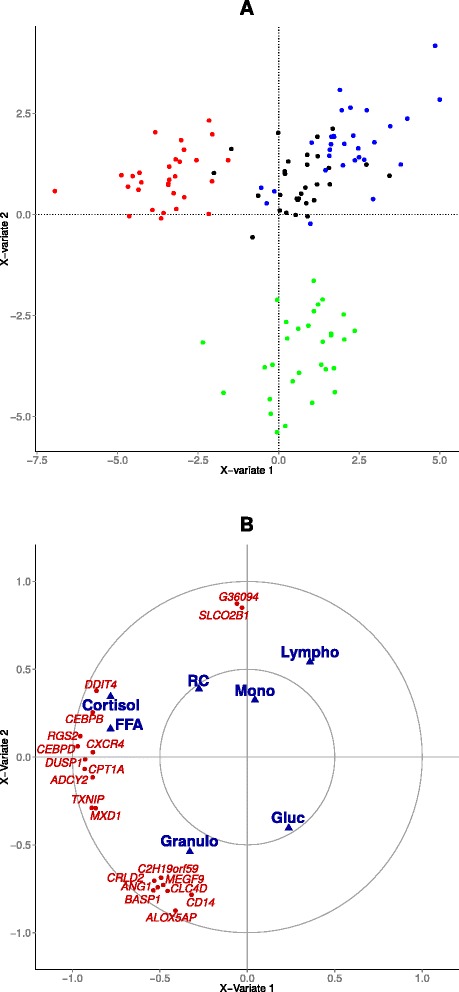
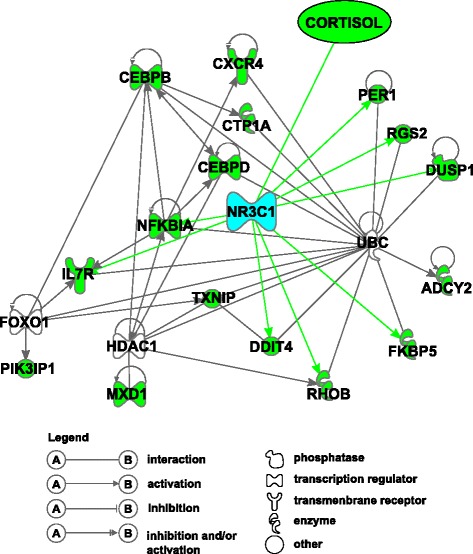
Results: Cortisol level reached its peak 1 h after ACTH injection. White blood cell composition was modified with a decrease of lymphocytes and monocytes and an increase of granulocytes (F D R<0.05). Basal level of cortisol was correlated with birth and weaning weights. Microarray analysis identified 65 unique genes of which expression responded to the injection of ACTH (adjusted P<0.05). These genes were classified into 4 clusters with distinctive kinetics in response to ACTH injection. The first cluster identified genes strongly correlated to cortisol and previously reported as being regulated by glucocorticoids. In particular, DDIT4, DUSP1, FKBP5, IL7R, NFKBIA, PER1, RGS2 and RHOB were shown to be connected to each other by the glucocorticoid receptor NR3C1. Most of the differentially expressed genes that encode transcription factors have not been described yet as being important in transcription networks involved in stress response. Their co-expression may mean co-regulation and they could thus provide new patterns of biomarkers of the individual sensitivity to cortisol.
Conclusions: We identified 65 genes as biological markers of HPA axis activation at the gene expression level. These genes might be candidates for a better understanding of the molecular mechanisms of the stress response.
Figures
Similar articles
-
Time course study of the response to LPS targeting the pig immune gene networks.BMC Genomics. 2017 Dec 22;18(1):988. doi: 10.1186/s12864-017-4363-5. BMC Genomics. 2017. PMID: 29273011 Free PMC article.
-
Association study of molecular polymorphisms in candidate genes related to stress responses with production and meat quality traits in pigs.Domest Anim Endocrinol. 2013 Feb;44(2):81-97. doi: 10.1016/j.domaniend.2012.09.004. Epub 2012 Oct 1. Domest Anim Endocrinol. 2013. PMID: 23063408
-
The cortisol response to ACTH in pigs, heritability and influence of corticosteroid-binding globulin.Animal. 2015 Dec;9(12):1929-34. doi: 10.1017/S1751731115001767. Epub 2015 Aug 24. Animal. 2015. PMID: 26302113
-
The stress system in the human brain in depression and neurodegeneration.Ageing Res Rev. 2005 May;4(2):141-94. doi: 10.1016/j.arr.2005.03.003. Ageing Res Rev. 2005. PMID: 15996533 Review.
-
Glucocorticoids, genes and brain function.Prog Neuropsychopharmacol Biol Psychiatry. 2018 Mar 2;82:136-168. doi: 10.1016/j.pnpbp.2017.11.020. Epub 2017 Nov 24. Prog Neuropsychopharmacol Biol Psychiatry. 2018. PMID: 29180230 Review.
Cited by
-
A Hypothesis and Review of the Relationship between Selection for Improved Production Efficiency, Coping Behavior, and Domestication.Front Genet. 2017 Sep 28;8:134. doi: 10.3389/fgene.2017.00134. eCollection 2017. Front Genet. 2017. PMID: 29033975 Free PMC article.
-
Investigation of muscle transcriptomes using gradient boosting machine learning identifies molecular predictors of feed efficiency in growing pigs.BMC Genomics. 2019 Aug 17;20(1):659. doi: 10.1186/s12864-019-6010-9. BMC Genomics. 2019. PMID: 31419934 Free PMC article.
-
Time course study of the response to LPS targeting the pig immune gene networks.BMC Genomics. 2017 Dec 22;18(1):988. doi: 10.1186/s12864-017-4363-5. BMC Genomics. 2017. PMID: 29273011 Free PMC article.
-
Data analysis of MS-based clinical lipidomics studies with crossover design: A tutorial mini-review of statistical methods.Clin Mass Spectrom. 2019 May 20;13:5-17. doi: 10.1016/j.clinms.2019.05.002. eCollection 2019 Aug. Clin Mass Spectrom. 2019. PMID: 34841080 Free PMC article. Review.
-
Transcriptional changes across tissue and time provide molecular insights into a therapeutic window of opportunity following traumatic stress exposure.Transl Psychiatry. 2025 Jul 16;15(1):244. doi: 10.1038/s41398-025-03451-y. Transl Psychiatry. 2025. PMID: 40670337 Free PMC article.
References
-
- Rauw W, Kanis E, Noordhuizen-Stassen E, Grommers F. Undesirable side effects of selection for high production efficiency in farm animals: a review. Livest Prod Sci. 1998;56(1):15–33. doi: 10.1016/S0301-6226(98)00147-X. - DOI
-
- Désautés C, Bidanel J, Milan D, Iannuccelli N, Amigues Y, Bourgeois F, et al. Genetic linkage mapping of quantitative trait loci for behavioral and neuroendocrine stress response traits in pigs. J Anim Sci. 2002;80(9):2276–285. - PubMed
Publication types
MeSH terms
Substances
LinkOut - more resources
Full Text Sources
Other Literature Sources
Miscellaneous
