. 2016 Feb 29;44(4):1566-78.
doi: 10.1093/nar/gkv1120. Epub 2015 Nov 17.

Genome-wide binding studies reveal DNA binding specificity mechanisms and functional interplay amongst Forkhead transcription factors

Affiliations

Genome-wide binding studies reveal DNA binding specificity mechanisms and functional interplay amongst Forkhead transcription factors

Xi Chen et al. Nucleic Acids Res. .

Abstract

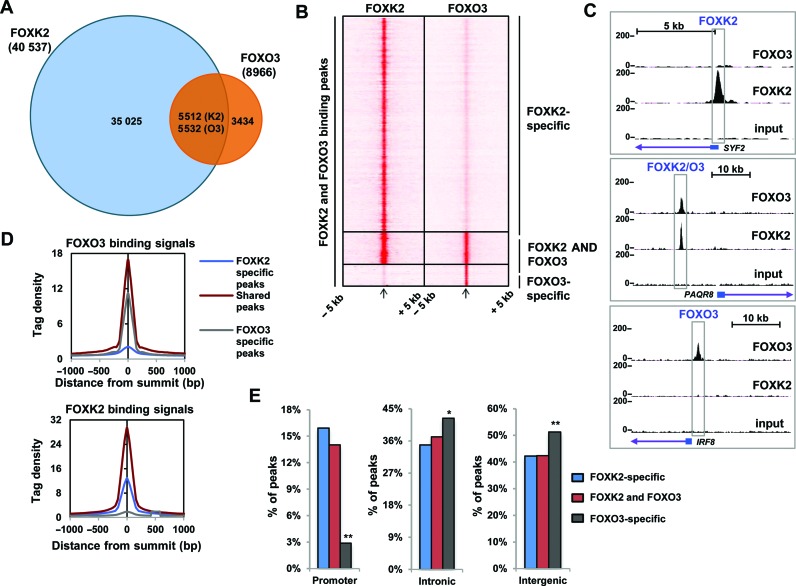
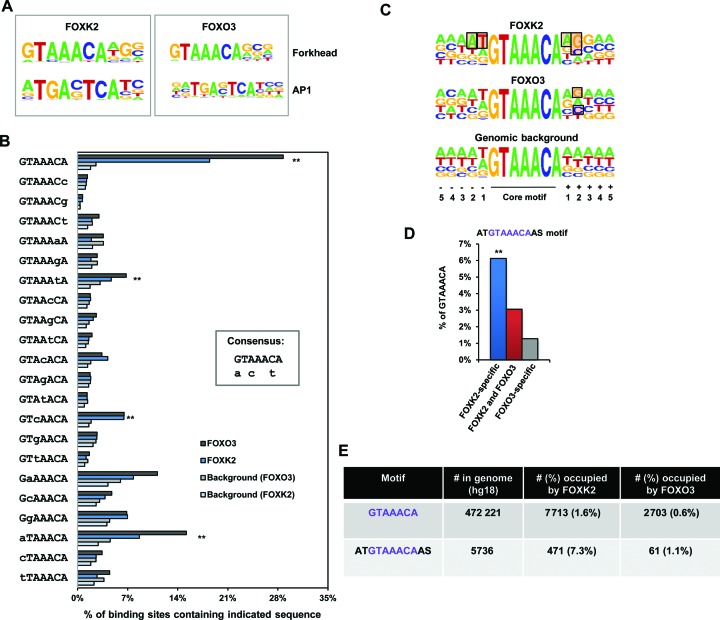
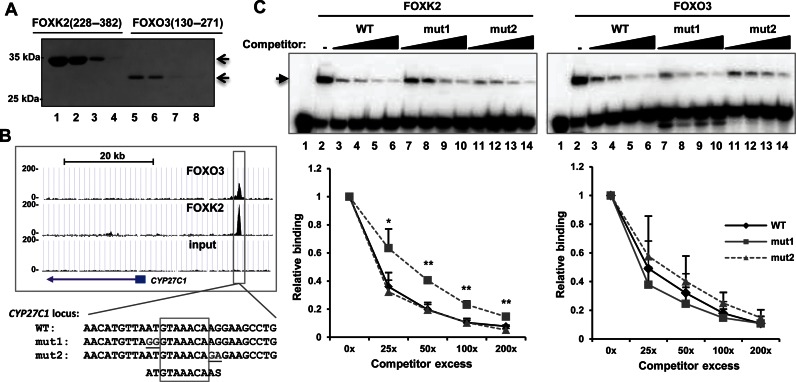
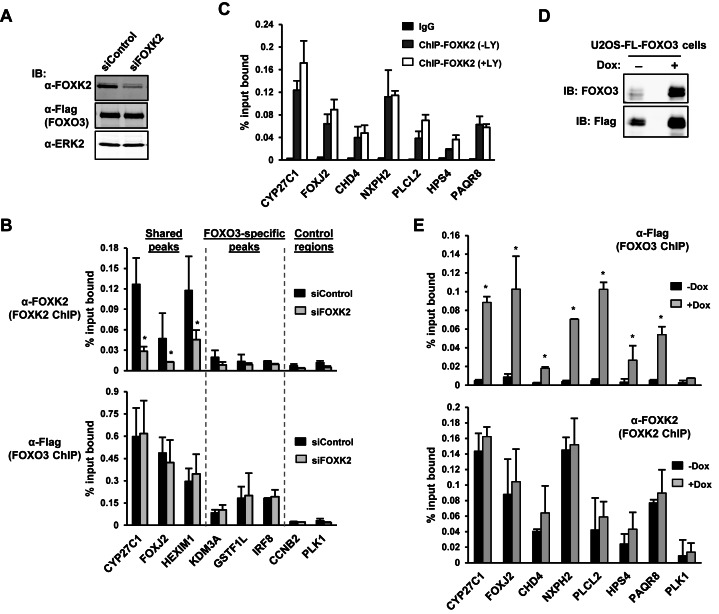
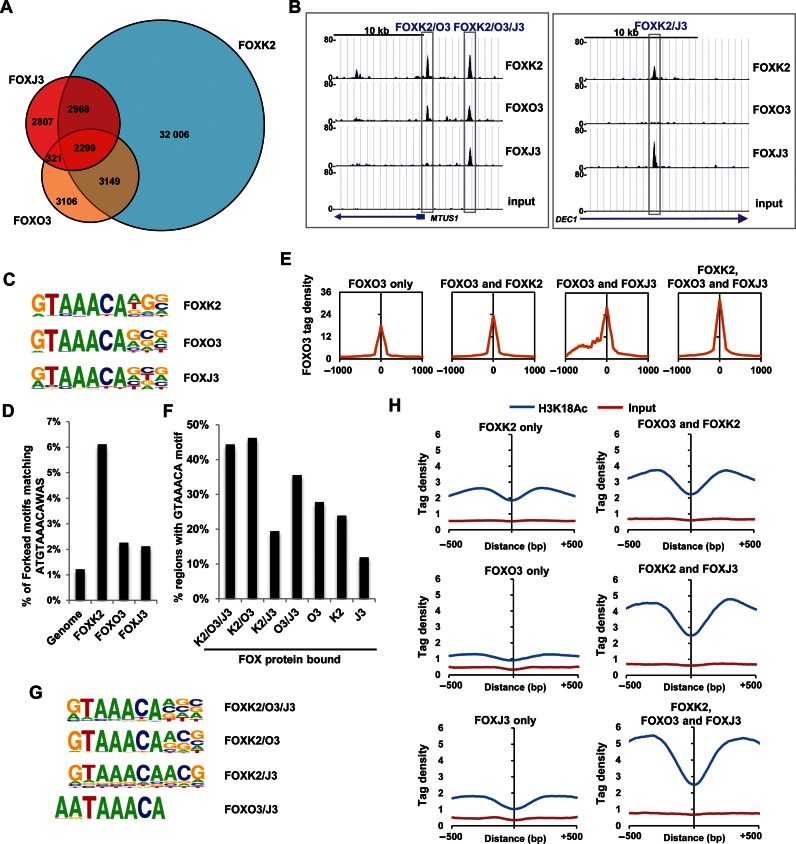
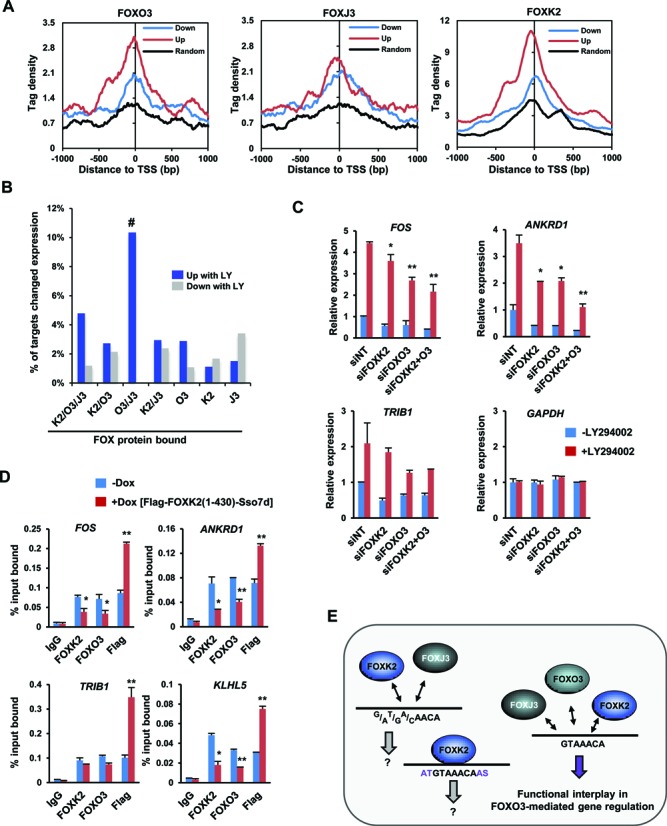
Transcription factors belonging to the same transcription factor families contain very similar DNA binding domains and hence have the potential to bind to related DNA sequences. However, subtle differences in binding specificities can be detected in vitro with the potential to direct specific responses in vivo. Here, we have examined the binding properties of three Forkhead (FOX) transcription factors, FOXK2, FOXO3 and FOXJ3 in vivo. Extensive overlap in chromatin binding is observed, although underlying differential DNA binding specificity can dictate the recruitment of FOXK2 and FOXJ3 to chromatin. However, functionally, FOXO3-dependent gene regulation is generally mediated not through uniquely bound regions but through regions occupied by both FOXK2 and FOXO3 where both factors play a regulatory role. Our data point to a model whereby FOX transcription factors control gene expression through dynamically binding and generating partial occupancy of the same site rather than mutually exclusive binding derived by stable binding of individual FOX proteins.


Figures

Figure 1.
Figure 1.
ChIP-seq analysis of FOXK2 and FOXO3 binding profiles. (A) Venn diagram showing overlapping binding regions shared between FOXK2 and FOXO3. Numbers of peaks overlapping with respect to FOXK2 (K2) and FOXO3 (O3) are shown. (B) Heat map of tag densities of FOXK2 (left) or FOXO3 (right) ChIP-seq signal at all of the binding regions identified in the FOXK2 and FOXO3 ChIP-seq experiments. In each heat map the tag density is plotted for 5 kb either side of its binding peak summit. (C) UCSC genome browser views of FOXK2 and FOXO3 binding profiles associated with the indicated loci. (D) Average tag density profiles of FOXO3 (top) and FOXK2 (bottom) analyses mapped onto binding region summits of the indicated peak categories. (E) Genomic locations of the indicated groups of FOXK2 and FOXO3 binding regions. * = P < 0.05; **P < 0.01.
Figure 2.
Figure 2.
Sequence motifs found in the FOXK2 and FOXO3 binding regions. (A) WebLogo representation of over-represented motifs identified by de novo motif discovery in the FOXK2 (left) and FOXO3 (right) binding regions. (B) Binding specificity of FOXK2. The occurrence of each of the indicated motifs in the FOXO3 or FOXK2 binding regions compared to background data sets is shown. The four most statistically significant over-represented motifs in both cases are indicated (**). A consensus binding region based on these preferences is shown as an inset. Upper case letters represent the preferred nucleotides at each position whereas lower case letters represent alternative nucleotides that are favored at particular positions. (C) WebLogo representation of the nucleotide frequencies surrounding the GTAAACA core motifs found within the FOXK2 and FOXO3 binding regions in comparison to the Genomic background. Shaded rectangles indicate nucleotides whose frequencies are higher than a random distribution using the entire genome as a background. (D) Percentage of indicated binding peaks (±200 bp from the summit) that contain the ATGTAAACAAS motif. (E) Numbers of the sequences GTAAACA and ATGTAAACAAS in the human genome (unmasked hg18) and in the regions occupied by FOXK2 or FOXO3.
Figure 3.
Figure 3.
The 5′ flanking region is important for FOXK2 binding to DNA. (A) Coomassie staining of SDS–PAGE analysis of 5% of each four separate eluted samples of purified His-tagged FOXK2(228–382) and FOXO3(130–271) (containing the forkhead DNA-binding domain). (B) UCSC browser view of the FOXO3 and FOXK2 ChIP-seq peaks of CYP27C1 locus. DNA sequences of the wild-type and mutant binding regions used in EMSA experiments are shown below. Mutated bases are underlined and the core GTAAACA motif boxed. (C) Competition EMSA experiment using increasing concentrations (25x, 50x, 100x and 200x molar excess) of the indicated unlabeled sequences to compete for binding of FOXK2 (left) or FOXO3 (right) proteins to the labelled wild-type (WT) sequence. Protein–DNA complexes are indicated by the arrow. Quantification of the FOX–DNA binding at each concentration of competitor relative to binding in the absence of competitor (taken as 1) is shown below. The error bars represent the standard deviations of three independent experiments. * and ** represent P < 0.05 and P < 0.01, respectively.
Figure 4.
Figure 4.
FOXK2 and FOXO3 do not generally compete for binding site occupancy. (A and D) Western blot analysis showing the level of endogenous FOXK2, FOXO3, and Flag-tagged FOXO3 protein in the U2OS-3xFLAG-FOXO3 cell line following treatment with 1 μg/ml doxycycline and either a non-targeting siRNA (con) or an siRNA targeting FOXK2 (A) or following treatment with or without 1 μg/ml doxycycline (dox) for 24 h (D). Protein expression was determined by immunoblotting (IB) with the indicated antibodies. (B, C and E) ChIP analysis of endogenous FOXK2 or Flag-tagged FOXO3 in U2OS-3xFLAG-FOXO3 (B and E) or U2OS (C) cells. (B) Cells were treated with doxycycline for 24 h and then LY294002 for 2 h before crosslinking and also treated with either a non-targeting siRNA (con) or a siRNA targeting FOXK2. ChIP experiments were performed with a FOXK2 (top) or Flag (FOXO3; bottom) antibody on genomic regions associated with the indicated loci. (C) ChIP experiments were performed with control IgG or a FOXK2 antibody on genomic regions associated with the indicated loci in cells left untreated or treated with LY294002 for 2 h before crosslinking. (E) Cells were treated with doxycycline for 24 h and then LY294002 for 2 h before crosslinking. ChIP experiments were performed with a Flag (FOXO3; top) or FOXK2 (bottom) antibody on genomic regions associated with the indicated loci. The error bars represent the standard deviations from two independent experiments. Where indicated, statistical significance is shown (* = P-value < 0.05 with a one tailed t-test (B) or two tailed t-test (E)).
Figure 5.
Figure 5.
FOXK2, FOXO3 and FOXXJ3 exhibit extensive overlap in chromatin binding. (A) Venn diagram showing overlapping binding regions shared between FOXK2, FOXO3 and FOXJ3. If multiple peaks from a single FOX protein overlapped, they were merged to a single event. (B) UCSC genome browser views of FOXK2, FOXO3 and FOXJ3 binding profiles associated with the indicated loci illustrating binding regions shared between the indicated FOX proteins. (C) WebLogo representation of FOX motifs identified by de novo motif discovery in the FOXK2, FOXO3 and FOXJ3 binding regions. (D) Percentage of indicated binding peaks (±200 bp from the summit) that contain the ATGTAAACAAS motif. (E) Average tag densities surrounding the summits (±1 kb) of the FOXO3 binding regions, either uniquely or also associated with binding of the indicated additional FOX proteins. (F) Percentage of indicated classes of binding regions (±200 bp from the summit) that contain the core GTAAACA motif. (G) WebLogo representation of the top ranking FOX motifs identified by de novo motif discovery in regions bound by the indicated combinations of FOXK2, FOXO3 and FOXJ3. (H) Average tag densities (counted in 10 bp bins) of H3K18 acetylation surrounding the summits (±500 bp) of the regions associated with binding of the indicated FOX proteins.
Figure 6.
Figure 6.
Functional interplay between FOXO3 and FOXK2 at commonly bound regions. (A) Average tag densities of ChIP-seq signals from the indicated FOX proteins surrounding the TSS (±1 kb) of genes that are either up- or down-regulated following treatment of U2OS cells with LY294002. A control group of randomly selected genes that are not inducible by LY294002 treatment is shown for comparison. (B) Percentage of genes associated with the indicated classes of FOX binding regions that show either up- or down-regulation following LY294002 treatment. (C) RT-qPCR analysis of the indicated genes following treatment of U2OS cells with or without LY294002 after pre-treatment with non-targeting (NT) siRNAs, or individually or in combination with siRNAs against FOXK2 or FOXO3. The error bars represent the SEM from three independent experiments. (D) ChIP analysis of endogenous FOXK2, FOXO3 or Flag-tagged FOXK2(1–430)-Sso7d in U2OS-3xFLAG-FOXK2(1–430)-Sso7d cells treated with or without doxycycline for 24 h and then LY294002 for 2 h before crosslinking. ChIP experiments were performed on the genomic regions associated with the indicated loci. The error bars represent the SEM from three independent experiments (* = P-value < 0.05; ** = P-value < 0.01). (E) Model depicting specificity determinants and functional outputs from the indicated combinations of FOX protein binding at different subsets of FOXK2 binding regions.

References

    1. Hannenhalli S., Kaestner K.H. The evolution of Fox genes and their role in development and disease. Nat. Rev. Genet. 2009;10:233–240. - PMC - PubMed
    1. Jackson B.C., Carpenter C., Nebert D.W., Vasiliou V. Update of human and mouse forkhead box (FOX) gene families. Hum. Genomics. 2010;4:345–352. - PMC - PubMed
    1. Badis G., Berger M.F., Philippakis A.A., Talukder S., Gehrke A.R., Jaeger S.A., Chan E.T., Metzler G., Vedenko A., Chen X., et al. Diversity and complexity in DNA recognition by transcription factors. Science. 2009;324:1720–1723. - PMC - PubMed
    1. Jolma A., Yan J., Whitington T., Toivonen J., Nitta K.R., Rastas P., Morgunova E., Enge M., Taipale M., Wei G., et al. DNA-binding specificities of human transcription factors. Cell. 2013;152:327–339. - PubMed
    1. Boros J., Donaldson I.J., O'Donnell A., Odrowaz Z.A., Zeef L., Lupien M., Meyer C.A., Liu X.S., Brown M., Sharrocks A.D. Elucidation of the ELK1 target gene network reveals a role in the coordinate regulation of core components of the gene regulation machinery. Genome Res. 2009;19:1963–1973. - PMC - PubMed

Publication types