. 2015 Dec 15;43(22):10907-24.
doi: 10.1093/nar/gkv1225. Epub 2015 Nov 17.

Binding dynamics of a monomeric SSB protein to DNA: a single-molecule multi-process approach

Affiliations

Binding dynamics of a monomeric SSB protein to DNA: a single-molecule multi-process approach

Michael J Morten et al. Nucleic Acids Res. .

Abstract

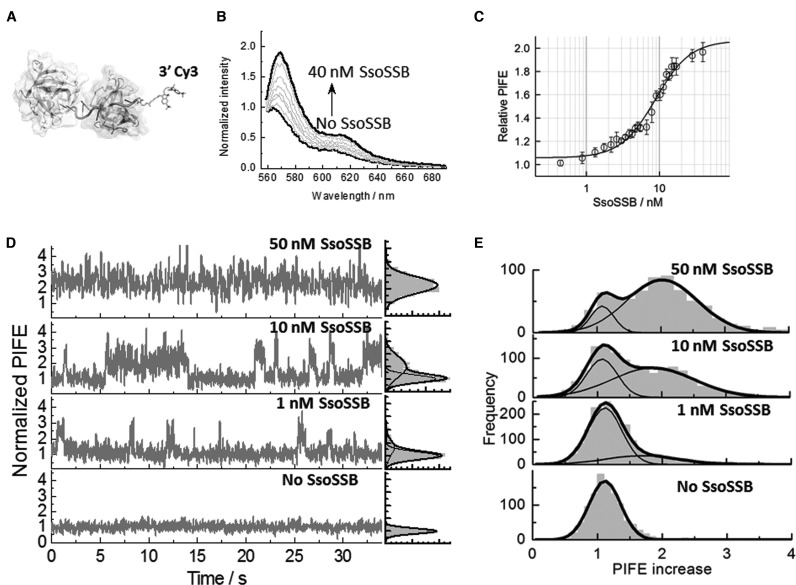
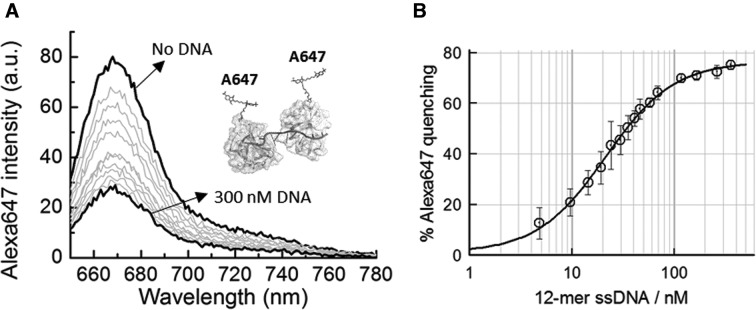
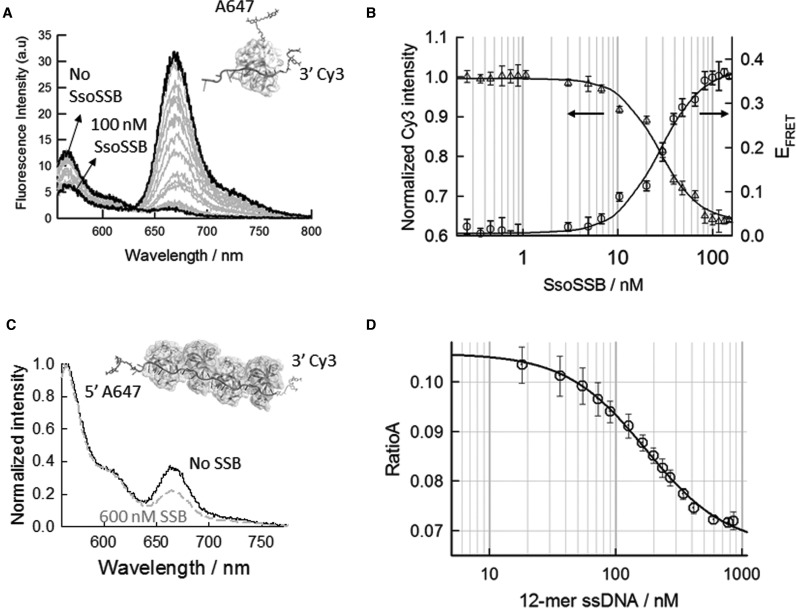
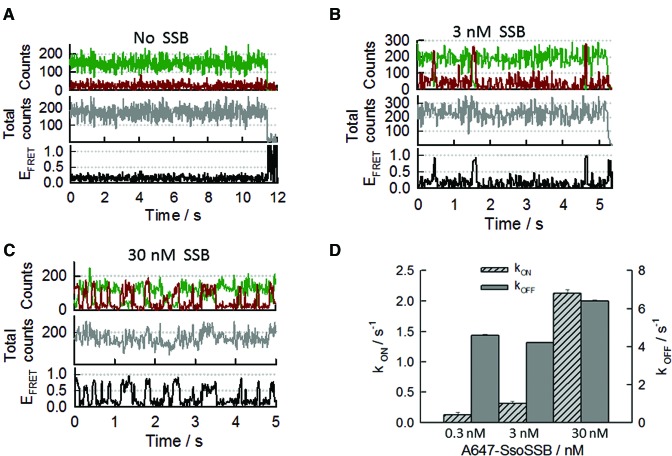
Single-stranded DNA binding proteins (SSBs) are ubiquitous across all organisms and are characterized by the presence of an OB (oligonucleotide/oligosaccharide/oligopeptide) binding motif to recognize single-stranded DNA (ssDNA). Despite their critical role in genome maintenance, our knowledge about SSB function is limited to proteins containing multiple OB-domains and little is known about single OB-folds interacting with ssDNA. Sulfolobus solfataricus SSB (SsoSSB) contains a single OB-fold and being the simplest representative of the SSB-family may serve as a model to understand fundamental aspects of SSB:DNA interactions. Here, we introduce a novel approach based on the competition between Förster resonance energy transfer (FRET), protein-induced fluorescence enhancement (PIFE) and quenching to dissect SsoSSB binding dynamics at single-monomer resolution. We demonstrate that SsoSSB follows a monomer-by-monomer binding mechanism that involves a positive-cooperativity component between adjacent monomers. We found that SsoSSB dynamic behaviour is closer to that of Replication Protein A than to Escherichia coli SSB; a feature that might be inherited from the structural analogies of their DNA-binding domains. We hypothesize that SsoSSB has developed a balance between high-density binding and a highly dynamic interaction with ssDNA to ensure efficient protection of the genome but still allow access to ssDNA during vital cellular processes.


Figures

Figure 1.
Figure 1.
SsoSSB binding to a 12-mer single-strand DNA monitored by protein-induced fluorescence enhancement (PIFE). (A) Molecular modelling of SsoSSB monomers (see Supplementary section for details) bound to a 12-mer Cy3-labelled single strand. (B) Fluorescence emission spectra of the Cy3 fluorophore inserted at the 3′ termini of a 12-mer dC sequence as a function of SsoSSB concentration. The fluorescence spectrum in the absence of SsoSSB was normalized to unity at the wavelength of the maximum and taken as a reference to calculate the relative increase in emission intensity at each SsoSSB concentration. (C) Relative variation in emission intensity of Cy3 normalized with respect to the emission intensity obtained in the absence of SsoSSB in a background of 10 mM KCl. Values represent the average of three experiments and are given as mean ± s.e.m. Solid line indicates the non-linear squares fit to Equation S1 as described in the Supplementary section. KD and Hill coefficient values of 9 ± 1 nM and 1.8 ± 0.2 were obtained, respectively. (D) Representative single-molecule trajectories of Cy3 emission intensity obtained at the indicated concentrations of SsoSSB with 50 ms integration time. SsoSSB association and dissociation can be observed as PIFE events in the single molecule trace. The raw Cy3 intensity in the absence of DNA has been normalized to unity and this has been taken as the signal reference for the single-molecule trajectories to quantify the relative increase in Cy3 intensity due to SsoSSB binding. Corresponding single-molecule PIFE histograms for each trace are also shown on the right panels. (E) Cumulative single-molecule histograms and Gaussian fitting (solid lines) of normalized Cy3 intensity built from >1000 molecules at each concentration of SsoSSB.
Figure 2.
Figure 2.
Fluorescence quenching as a reporter of adjacent binding between Alexa647-labelled ssoSSB monomers. (A) Fluorescence spectra of Alexa647-labelled SsoSSB as function of increasing concentrations of a 12-mer dC single-stranded DNA. (B) Percentage of quenching of Alexa647 intensity as a function of ssDNA concentration in a background of 10 mM KCl. Values represent the average of three experiments and are given as mean ± s.e.m. Solid line indicates the non-linear squares fit to Equation S1 as described in the Supplementary section. KD and Hill coefficient values of 20 ± 1 nM and 1.3 ± 0.2 were obtained, respectively.
Figure 3.
Figure 3.
SsoSSB binding to ssDNA and associated conformational changes monitored by intra- and intermolecular FRET. (A) Intermolecular FRET assay to monitor Alexa647-labelled SsoSSB binding to 12-mer dC ssDNA strand labelled with the FRET donor Cy3. The fluorescence spectra of Cy3 and Alexa647 was collected in the range 555–800 nm upon excitation of the donor at 547 nm as function of increasing concentrations of Alexa647-SsoSSB. (B) FRET binding isotherm and normalized Cy3 donor intensity as a function of SsoSSB concentration. Plotted values represent the average of three experiments and are given as mean ± s.e.m. Solid lines represent the non-linear squares fit to a Hill model (see Supplementary section for details). (C) Intramolecular FRET assay to monitor conformational changes in a 39-mer dC ssDNA induced by SsoSSB binding. Fluorescence spectra of Cy3 and Alexa647 normalized at the maximum of the Cy3 emission band (565 nm) in the absence and presence of 600 nM SsoSSB are shown. (D) Variation in the RatioA value as a function of SsoSSB concentration. RatioA values were calculated as described in the Supplementary section and represent the average of three experiments. The solid lines indicates the results from a non-linear squares fit to Equation S1 as described in the Supplementary section. KD and Hill coefficient values of 174 ± 20 nM and 1.4 ± 0.2 were obtained, respectively.
Figure 4.
Figure 4.
Real-time single-molecule intermolecular FRET measurements of SsoSSB binding to a 20-mer ssDNA (BidC20Cy3). The DNA was labelled at the 3′ terminus with the Cy3 donor and immobilized on the quartz slide using biotin-streptavidin interactions. SsoSSB was labelled with Alexa647 as FRET acceptor (A) Single-molecule donor and acceptor trajectory (upper panel), total intensity (middle panel) and FRET trace (bottom panel) obtained in the absence of SsoSSB. Photobleaching of the Cy3 donor occurred at ∼11 s. (B) Representative single-molecule binding dynamics of Alexa647-SsoSSB to the BidC20Cy3 ssDNA. Anti-correlated fluctuations in the donorand acceptoremission signals (upper panel) are indicative of SsoSSB association and dissociation events. The corresponding PIFE and FRET trajectories are shown in the middle and bottom panel, respectively. (C) Representative single-molecule donor and acceptorintensity trajectory showing the binding dynamics of SsoSSB to BidC20Cy3 obtained at 30 nM concentration of Alexa647-labelled SsoSSB (upper panel). PIFE trajectory (middle panel) and FRET trace (bottom panel) are also shown. (D) Bar plot showing the association (kON) and dissociation (kOFF) rates in s−1 obtained for Alexa647-SsoSSB binding to BidC20Cy3 at the indicated concentrations of SsoSSB. Rates and associated errors were obtained from the fitting of the single-molecule dwell-time histograms to a mono-exponential decay function.
Figure 5.
Figure 5.
SsoSSB binding to a short ssDNA segment leads to single-molecule trajectories showing coexisting FRET, PIFE and acceptor quenching events. (A) Representative single-molecule trajectory showing the effect that SsoSSB binding to a surface-immobilized 12-mer ssDNA labelled at the 3′ end with Cy3 (BidC12Cy3) has on the donor and acceptor intensities (upper panel), the PIFE signal (middle panel) and the FRET efficiency (bottom panel). Panels on the right show the single-molecule histograms for the corresponding trajectory displayed on the left. (B) Single-molecule trajectories and corresponding histograms obtained at identical conditions as those described for (A) but showing additional rare events (marked with an asterisk). As shown in panel (A), the majority of PIFE events formed quickly following a high-FRET state and only a small percentage (panel B, marked with asterisk) was observed to directly emerge from a non-FRET state (no protein bound).
Figure 6.
Figure 6.
Dissecting the binding mechanism of SsoSSB to ssDNA using a single-molecule multi-process approach. Each single-molecule event (FRET, PIFE and acceptor-quenching) observed in the binding trajectories was assigned to an specific interaction between SsoSSB and the 12–mer ssDNA as described in panels (AD). (A) S1-state: no-FRET state corresponding to unbound Cy3-labelled DNA. Single molecule trajectories displayed emission only from the donor (green) (left panel). (B) S2-state: high-FRET state formed by monomer binding to the ssDNA resulting in SsoSSB:ssDNA complexes of 1:1 stoichiometry. This state is characterized by an anti-correlated transition between donor (green) and acceptor (dark red) emission. Depending on the relative positioning of the bound monomer with respect to the Cy3, the total intensity might remain constant (S2a) or exhibit an increase due to PIFE (S2b). (C and D) Formation of ssDNA:(SsoSSB)2 complexes takes place by incorporation of a second monomer to a previously formed SsoSSB:DNA complex (pathway S3). This pathway is characterized by the transition from a high-FRET state (S2 state) to a no-FRET state where the Cy3 intensity, and the total intensity, has increased by 2-fold due to PIFE, but there is no emission from Alexa647 because of quenching between adjacent SsoSSB monomers. Some events leading to the formation of ssDNA:(SsoSSB)2 complexes (pathway S4) are faster than the time resolution of our EMCCD camera (33 ms) and appear as a single-step transition involving a PIFE-induced increase in Cy3 and total intensity emission (panel D).
Figure 7.
Figure 7.
Real-time single-molecule measurements of SsoSSB binding to a 12-mer ssDNA as a function of SsoSSB concentration using an inter-molecular FRET assay. DNA was labelled at the 3′ end with Cy3 and at the 5′ end with a biotin moiety. SsoSSB was site-specifically labelled with Alexa647 as acceptor. Representative single-molecule intensity trajectories of Cy3 and Alexa647 are shown (upper panels) together with the PIFE (middle panel) and the FRET efficiency trajectories (bottom panel) at the indicated concentrations of SsoSSB (A: 0.05nM; B: 0.5 nM; C: 2.5 nM and D: 10 nM). Single-molecule population histograms for each FRET and PIFE trajectories are also shown in the right panels. Solid lines represent the corresponding fit of each population to a Gaussian distribution.
Figure 8.
Figure 8.
Single-molecule rate analysis of the association and dissociation steps involved in SsoSSB coating of a ssDNA strand. (A) Schematic of the dwell-time (τ) assignation of each individual single-molecule state for SsoSSB binding to a 12-mer ssDNA strand. Single-molecule dwell-time histograms for the association (B) and dissociation (C) of the first bound monomer obtained using a surface-immobilized 12-mer dC single-strand DNA labelled with Cy3 and Biotin (BidC12Cy3) at the indicated concentrations of Alexa647 labelled SsoSSB. The association rate formula image was determined from the dwell-times of the S1 state (no protein bound) and the dissociation rate formula image was measured as the time a single SsoSSB monomer was bound to the ssDNA and therefore in a high-FRET state (see main text for details). Solid lines represent the results from fitting the dwell-time histograms obtained at each SsoSSB concentration to a mono-exponential decay function. (D) Dependence of the pseudo-first order rates for firsrt (dark red) and second monomer association (green) as a function of SsoSSB concentration. The off rate of the first monomer is also shown (blue). The off rate for the first monomer was independent of SsoSSB concentration, while the pseudo-first order rate for the first and second monomer association showed a linear dependence with SsoSSB concentration. For the association rates (dark red and green), the solid lines represent linear fits to yield the second-order association rate constant. (E) Association (orange) and dissociation (black) rates obtained at the indicated concentrations of SsoSSB for the low-populated S1→S4 and S4→S1 transitions (S4 pathway, see main text and Figure 6 for details). The solid line represents a linear fit to extract the second-order rate constant. Kinetic rates obtained for the dissociation of ssDNA:(SsoSSB)2 complexes formed following the S3 pathway (purple) (see main text and Figure 6 for details) are also shown with their associated errors.
Figure 9.
Figure 9.
Proposed kinetic model for the interaction of SsoSSB with single-stranded DNA. The cartoon depicts the sequential monomer-by-monomer binding to the SsDNA and the corresponding rates for each step extracted from single-molecule measurements. A low-populated kinetic pathway involving the incorporation of the first monomer to the ssDNA followed by the second monomer at a rate faster than our time resolution ( ms) is also shown (see main text for details).

Similar articles

Cited by

References

    1. Watson J.D., Crick F.H. Molecular structure of nucleic acids; a structure for deoxyribose nucleic acid. Nature. 1953;171:737–738. - PubMed
    1. Ciccia A., Elledge S. J. The DNA damage response: making it safe to play with knives. Mol. Cell. 2010;40:179–204. - PMC - PubMed
    1. Branze D., Foiani M. Regulation of DNA repair throughout the cell cycle. Nat. Rev. Mol. Cell Biol. 2008;9:297–308. - PubMed
    1. Shereda R.D., Kozlov A.G., Lohman T.M., Cox M.M., Keck J.L. SSB as an organizer/mobilizer of genome maintenance complexes. Crit. Rev. Biochem. Mol. Biol. 2008;43:289–318. - PMC - PubMed
    1. Wang G., Vasquez K.M. Impact of alternative DNA structures on DNA damage, DNA repair, and genetic instability. DNA Repair. 2014;19:143–151. - PMC - PubMed

Publication types

MeSH terms