

Amino acid positron emission tomography to monitor chemotherapy response and predict seizure control and progression-free survival in WHO grade II gliomas
- PMID: 26578622
- PMCID: PMC4827046
- DOI: 10.1093/neuonc/nov282
Amino acid positron emission tomography to monitor chemotherapy response and predict seizure control and progression-free survival in WHO grade II gliomas
Abstract
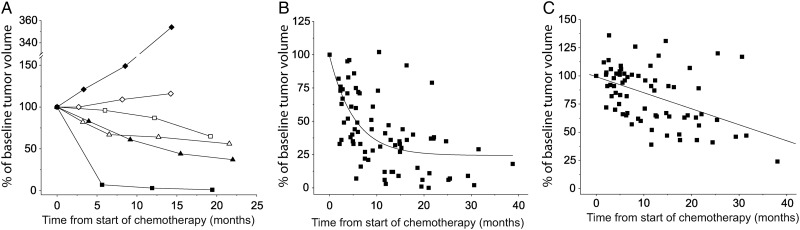
Background: Patients with WHO grade II glioma may respond to chemotherapy that is currently not standardized regarding timing and treatment duration. Metabolic changes during chemotherapy may precede structural tumor volume reductions. We therefore compared time courses of amino acid PET and MRI responses to temozolomide (TMZ) and assessed whether responses correlated with seizure control and progression-free survival (PFS).
Methods: PET and MRI were performed before and during TMZ chemotherapy. Tumor volumes were calculated using regions-of-interest analysis. Amino acid uptake was also quantified as metabolically active tumor volume and tumor-to-cerebellum uptake ratio.
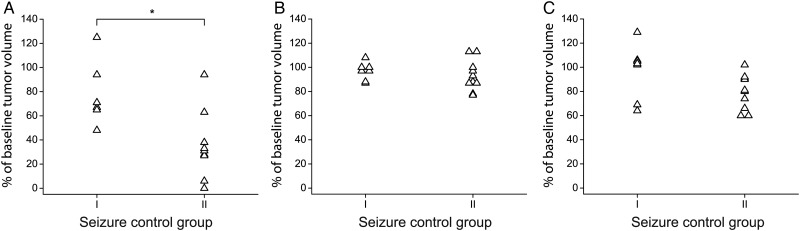
Results: One hundred twenty-five PET and 125 MRI scans from 33 patients were analyzed. Twenty-five patients showed metabolic responses that exhibited an exponential time course with a 25% reduction of the active volume on average after 2.3 months. MRI responses followed a linear course with a 25% reduction after 16.8 months. Reduction of metabolically active tumor volumes, but not reduction of PET uptake ratios or MRI tumor volumes, correlated with improved seizure control following chemotherapy (P = .012). Receiver-operating-characteristic curve analysis showed that a decrease of the active tumor volume of ≥80.5% predicts a PFS of ≥60 months (P = .018) and a decrease of ≥64.5% a PFS of ≥48 months (P = .037).
Conclusions: Amino acid PET is superior to MRI for evaluating TMZ responses in WHO grade II glioma patients. The response delay between both imaging modalities favors amino acid PET for individually tailoring the duration of chemotherapy. Additional studies should investigate whether this personalized approach is appropriate with regard to outcome.
Keywords: MRI; PET; chemotherapy; epilepsy; low-grade glioma.
© The Author(s) 2015. Published by Oxford University Press on behalf of the Society for Neuro-Oncology. All rights reserved. For permissions, please e-mail: journals.permissions@oup.com.
Figures
Similar articles
-
Early metabolic responses in temozolomide treated low-grade glioma patients.J Neurooncol. 2009 Oct;95(1):87-93. doi: 10.1007/s11060-009-9896-2. Epub 2009 Apr 18. J Neurooncol. 2009. PMID: 19381442 Clinical Trial.
-
Reirradiation of recurrent high-grade gliomas using amino acid PET (SPECT)/CT/MRI image fusion to determine gross tumor volume for stereotactic fractionated radiotherapy.Int J Radiat Oncol Biol Phys. 2005 Oct 1;63(2):511-9. doi: 10.1016/j.ijrobp.2005.01.056. Int J Radiat Oncol Biol Phys. 2005. PMID: 16168843
-
Use of 11C-methionine PET to monitor the effects of temozolomide chemotherapy in malignant gliomas.Eur J Nucl Med Mol Imaging. 2006 May;33(5):516-24. doi: 10.1007/s00259-005-0002-5. Epub 2006 Feb 1. Eur J Nucl Med Mol Imaging. 2006. PMID: 16450140 Clinical Trial.
-
Prognostic Value of the Metabolic and Volumetric Parameters of 11C-Methionine Positron-Emission Tomography for Gliomas: A Systematic Review and Meta-Analysis.AJNR Am J Neuroradiol. 2018 Sep;39(9):1629-1634. doi: 10.3174/ajnr.A5707. Epub 2018 Jun 28. AJNR Am J Neuroradiol. 2018. PMID: 29954817 Free PMC article.
-
Combined PET/MRI in brain glioma imaging.Br J Hosp Med (Lond). 2019 Jul 2;80(7):380-386. doi: 10.12968/hmed.2019.80.7.380. Br J Hosp Med (Lond). 2019. PMID: 31283392 Review.
Cited by
-
Amino Acid PET - An Imaging Option to Identify Treatment Response, Posttherapeutic Effects, and Tumor Recurrence?Front Neurol. 2016 Jul 28;7:120. doi: 10.3389/fneur.2016.00120. eCollection 2016. Front Neurol. 2016. PMID: 27516754 Free PMC article.
-
Management of epilepsy in brain tumors.Neurol Sci. 2019 Oct;40(10):2217-2234. doi: 10.1007/s10072-019-04025-9. Epub 2019 Aug 7. Neurol Sci. 2019. PMID: 31392641
-
PET-based response assessment criteria for diffuse gliomas (PET RANO 1.0): a report of the RANO group.Lancet Oncol. 2024 Jan;25(1):e29-e41. doi: 10.1016/S1470-2045(23)00525-9. Lancet Oncol. 2024. PMID: 38181810 Free PMC article. Review.
-
Prediction of response to lomustine-based chemotherapy in glioma patients at recurrence using MRI and FET PET.Neuro Oncol. 2023 May 4;25(5):984-994. doi: 10.1093/neuonc/noac229. Neuro Oncol. 2023. PMID: 36215231 Free PMC article.
-
Current Landscape and Emerging Fields of PET Imaging in Patients with Brain Tumors.Molecules. 2020 Mar 24;25(6):1471. doi: 10.3390/molecules25061471. Molecules. 2020. PMID: 32213992 Free PMC article. Review.
References
-
- Smits A, Duffau H. Seizures and the natural history of World Health Organization Grade II gliomas: a review. Neurosurgery. 2011;68(5):1326–1333. - PubMed
-
- Bourne TD, Schiff D. Update on molecular findings, management and outcome in low-grade gliomas. Nat Rev Neurol. 2010;6(12):695–701. - PubMed
-
- Weller M, Weber RG, Willscher E et al. . Molecular classification of diffuse cerebral WHO grade II/III gliomas using genome- and transcriptome-wide profiling improves stratification of prognostically distinct patient groups. Acta Neuropathol. 2015;129(5):679–693. - PubMed
-
- Lashkari HP, Saso S, Moreno L, Athanasiou T, Zacharoulis S. Using different schedules of Temozolomide to treat low grade gliomas: systematic review of their efficacy and toxicity. J Neurooncol. 2011;105(2):135–147. - PubMed
-
- van den Bent MJ, Wefel JS, Schiff D et al. . Response assessment in neuro-oncology (a report of the RANO group): assessment of outcome in trials of diffuse low-grade gliomas. Lancet Oncol. 2011;12(6):583–593. - PubMed
MeSH terms
Substances
LinkOut - more resources
Full Text Sources
Other Literature Sources
Medical
