. 2016 Jun;18(6):807-18.
doi: 10.1093/neuonc/nov280. Epub 2015 Nov 17.

CD4+ T effector memory cell dysfunction is associated with the accumulation of granulocytic myeloid-derived suppressor cells in glioblastoma patients

Affiliations

CD4+ T effector memory cell dysfunction is associated with the accumulation of granulocytic myeloid-derived suppressor cells in glioblastoma patients

Daniel Dubinski et al. Neuro Oncol. 2016 Jun.

Abstract

Background: Myeloid-derived suppressor cells (MDSCs) comprise a heterogeneous population of myeloid cells that are significantly expanded in cancer patients and are associated with tumor progression.

Methods: Multicolor flow cytometry was used to study the frequency, phenotype, and function of MDSCs in peripheral blood and freshly resected tumors of 52 participants with primary glioblastoma (GBM).

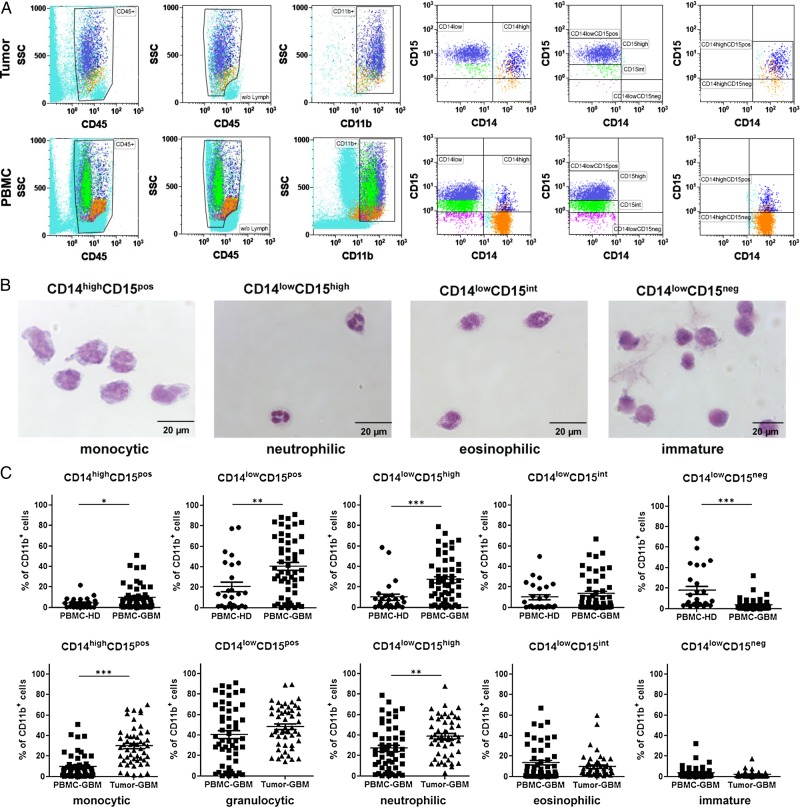
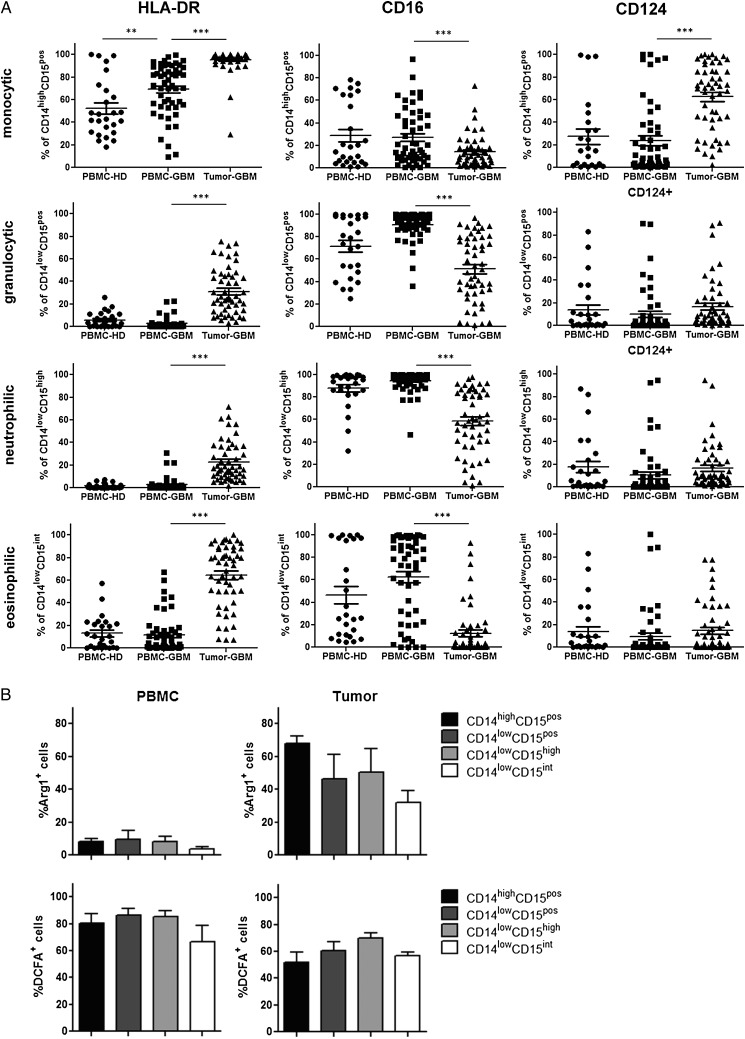
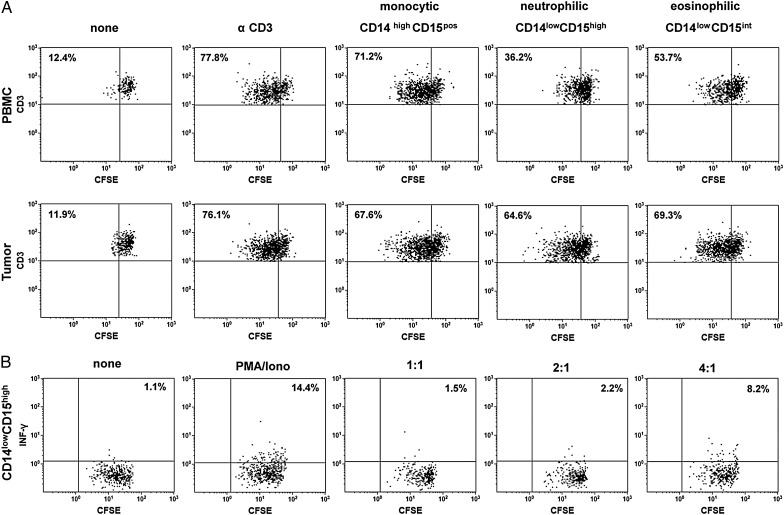
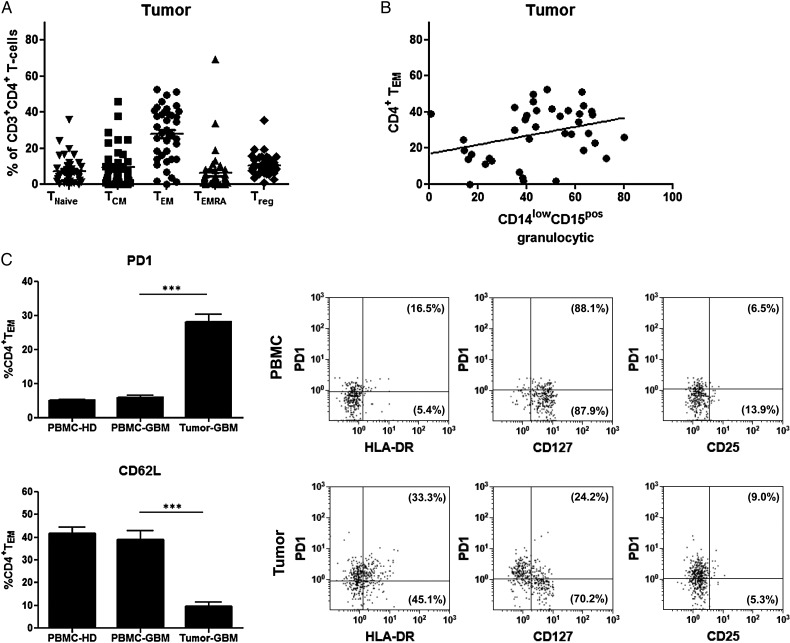
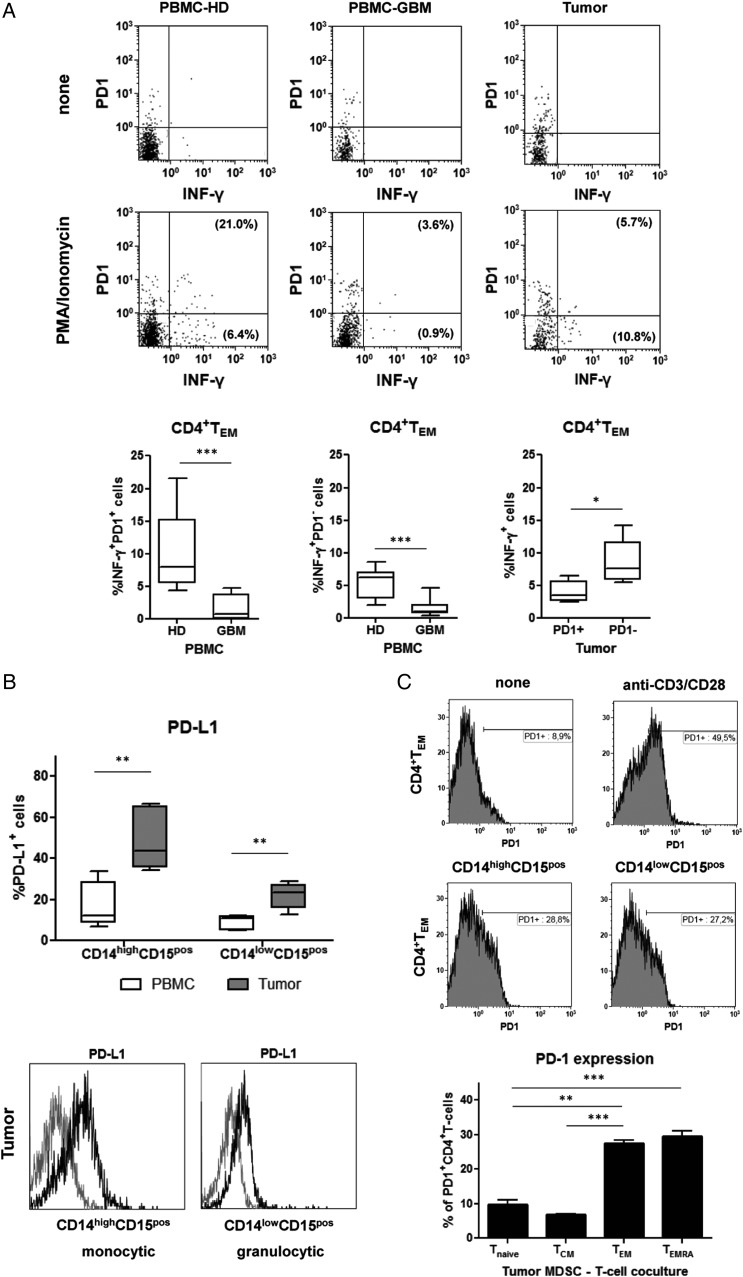
Results: The frequency of CD14(high)CD15(pos) monocytic and CD14(low)CD15(pos) granulocytic MDSCs was significantly higher in peripheral blood of GBM participants compared with healthy donors. The majority of granulocytic MDSCs consisted of CD14(low)CD15(high) neutrophilic MDSCs with high T-cell suppressive capacities. At the tumor side, we found an increase in CD14(high)CD15(pos) monocytic MDSCs and high frequencies of CD14(low)CD15(pos) granulocytic MDSCs that displayed an activated phenotype with downregulation of CD16 and upregulation of HLA-DR molecules, which did not inhibit T-cell proliferative responses in vitro. However, a strong association between granulocytic MDSCs and CD4(+) effector memory T-cells (TEM) within the tumors was detected. Tumor-derived CD4(+) TEM expressed high levels of PD-1 when compared with their blood-derived counterparts and were functionally exhausted. The respective ligand, PD-L1, was significantly upregulated on tumor-derived MDSCs, and T-cell co-culture experiments confirmed that glioma-infiltrating MDSCs can induce PD-1 expression on CD4(+) TEM.

Conclusions: Our findings provide a detailed characterization of different MDSC subsets in GBM patients and indicate that both granulocytic MDSCs in peripheral blood and at the tumor site play a major role in GBM-induced T-cell suppression.

Keywords: PD-1; PD-L1; T effector memory cell; glioblastoma; myeloid-derived suppressor cell.


Figures

Fig. 1.
Fig. 1.
Distribution of different myeloid-derived suppressor cell (MDSC) subsets in peripheral blood and tumor tissue of participants with primary glioblastoma (GBM) (A) Representative dot plots are shown to illustrate the gating strategy for the discrimination of different MDSC subsets. After removal of trash, aggregates, and dead cells by forward/side scatter gating, lymphocytes were excluded from CD45+ leukocytes, and cells with high expression of the myeloid marker CD11b were selected to exclude resident microglia or tumor-infiltrating macrophages that usually exhibit a CD11blow expression profile. Cells were then separated into a CD14high and CD14low fraction. Based on the expression of CD15, CD14low cells were further divided into CD15high, CD15int, or CD15neg cells. Similarly, CD14high cells were split into CD15pos and CD15neg cells. (B) Morphologic characteristics of different MDSC subsets in the peripheral blood of GBM participants. PBMCs were stained with CD45, CD11b, CD14, and CD15, and MDSC subsets were sorted by flow cytometry as depicted in (A). Cytospins and H&E staining were conducted. Representative pictures of different MDSC subsets are shown in (B). CD14highCD15pos cells displayed typical features of monocytes with a lobulated or reniform nucleus (usually eccentrically placed) and a grayish-blue cytoplasm. CD14lowCD15high cells revealed the typical morphology of neutrophils with segmented nuclei and pale pink cytoplasm. CD14lowCD15int cells displayed features of eosinophils with a classic bilobed nucleus and eosinophilic cytoplasm filled by numerous red granules of uniform size. CD14lowCD15neg showed big round nuclei with a small basophilic cytoplasm characteristic for immature myeloid cells. (C) Frequencies of different MDSC subsets within PBMCs and tumor cell suspension of healthy donors (PBMC-HD; n = 26) and GBM participants (PBMC-GBM, Tumor-GBM; n = 52). P values were calculated using the 2-tailed Mann-Whitney test. For detailed statistics, see Supplementary material, Table S1.
Fig. 2.
Fig. 2.
Further phenotypic characterization of different myeloid-derived suppressor cell (MDSC) subsets in peripheral blood and tumor tissue of participants with primary glioblastoma (GBM). (A) The expression of HLA-DR, CD16, and CD124 on different MDSC subsets was evaluated by flow cytometry. The frequencies of HLA-DR, CD16, and CD124-positive MDSCs within peripheral blood mononuclear cells (PBMCs) and tumor cell suspensions of healthy donors (n = 26) and GBM participants (n = 52) are shown. Asterisks denote significant P values: * P < .05; ** P < .01; *** P < .0001. (B) Arginase I and reactive oxygen species (ROS) production by different MDSC subsets were determined by flow cytometry. The frequencies of arginase I and ROS-positive MDSCs from 5 GBM participants are presented.
Fig. 3.
Fig. 3.
Suppressive capacity of different myeloid-derived suppressor cell (MDSC) subsets from partiipants with primary glioblastoma. Peripheral blood mononuclear cells (PBMCs) and tumor cell suspensions were stained with CD45, CD11b, CD14, and CD15, and different MDSC subsets were sorted, seeded into anti-CD3–coated plates and co-cultured with CFSE-labeled autologous T-cells at a T-cell-to-MDSC ratio of 2:1 in the presence of IL-2. Five days later, T-cell proliferation was assessed by flow cytometry. (A) Representative dot plots of T-cell proliferation after addition of CD14highCD15pos monocytic, CD14lowCD15high neutrophilic, and CD14lowCD15int MDSCs from the same participant are shown. The percentage values represent the fraction of proliferating CSFE-labeled T-cells. (B) Representative dot plots of T-cell proliferation and intracellular INF-γ secretion after addition of CD14lowCD15high neutrophilic MDSCs to CFSE-labeled autologous T-cells at different T-cell -to- MDSC ratios (1:1–4:1) and PMA/ionomycin stimulation. The percentage values represent the fraction of INF-γ secreting CSFE-labeled T-cells. Data are representative of 3 independent experiments done.
Fig. 4.
Fig. 4.
(A) Distribution of intratumoral CD4+ T-cell subpopulations. Lymphocytes selected by side scatter versus forward scatter were displayed in a CD3+ versus CD4+ plot, and T-cell subsets were identified by the following co-expression of CD45RA and CCR7. The proportion of CD4+ T-cell subsets was as follows: TNaïve (CCR7+/CD45RA+, mean: 7.5 ± 7.5) ; TCM (CCR7+/CD45RA, mean: 9.4% ± 10.9); TEM (CCR7/CD45RA, mean: 27.9% ± 14.9); TEMRA (CCR7/CD45RA+; mean: 6.5% ± 12.1); Treg (CD4+CD25highCD127low, mean: 10.4 ± 5.9). (B) Correlation of CD4+ TEM and CD14lowCD15pos granulocytic myeloid-derived suppressor cell (MDSCs) within primary glioblastoma (GBM) tissue. The frequencies of CD14lowCD15pos granulocytic MDSCs and CD4+ TEM at the tumor site from 39 GBM participants were determined by flow cytometry, and correlations between both populations were assessed using Spearman's test (r = 0.3362, P = .0364). (C) Phenotypic comparison of CD4+ TEM in peripheral blood and tumor tissue of participants with primary GBM. The percentages of PD-1 and CD62L expressing CD4+ TEM within PBMCs and tumor cell suspensions of GBM participants (n = 29) and healthy donors (n = 29) are shown (mean ± SEM). Asterisks denote significant P values: ***P < .0001. In addition, representative dot plots with co-expression of PD-1 and HLA-DR, CD127 or CD25 are depicted. The percentage values represent the fraction of PD-1+ or PD-1 CD4+ TEM that expressed HLA-DR, CD127 or CD25.
Fig. 5.
Fig. 5.
(A) Freshly isolated peripheral blood mononuclear cells (PBMCs) and tumor cell suspensions from healthy donors (n = 6) and glioblastoma (GBM) participants (n = 6) were stimulated with PMA/ionomycin overnight, stained with appropriate mAbs, and analyzed for intracellular INF-γ production. Cells were gated on CD4+ TEM, and INF-γ secretion was calculated for PD-1+ and PD-1 CD4+ TEM. Representative dot plots with co-expression of PD-1 and INF-γ of CD4+ TEM from a healthy donor (HD) and a GBM participant as well as boxplots (Min to Max) from all patients analyzed are shown. The percentage values represent the fraction of PD-1+ or PD-1 CD4+ TEM that produced INF-γ (PBMCs: % INF-γ+ PD-1+ CD4+ TEM HD vs GBM, P < .0001; % INF-γ+ PD-1+ CD4+ TEM HD vs GBM, P = .0004; tumor: % INF-γ+ PD-1+ vs % INF-γ+ PD-1 CD4+ TEM, P = .0152). (B) PD-L1 expression on different MDSC subsets in patients with primary GBM. Myeloid-derived suppressor cells (MDSCs) obtained from peripheral blood and tumor tissue (n = 5) were stained with appropriate mAbs and analyzed by flow cytometry (boxplots at the top). The percentage of PD-L1 expressing MDSCs (mean ± SEM) and representative histograms of the PD-L1 expression levels on tumor-derived MDSC subsets (grey line: isotype control, black line: PD-L1) are shown at the bottom of the figure (CD14highCD15pos or CD14lowCD15pos: peripheral blood mononuclear cells vs tumor: P = .0079). (C) PD-1 upregulation on CD4+ T-cells after co-culture with tumor-derived MDSC subsets. Tumor-derived MDSCs were sorted and co-cultured with untouched T-cells purified from autologous PBMCs for 2 days. Unstimulated T-cells and anti-CD3/28– stimulated T-cells were used as controls. Cells were harvested, stained with appropriate mAbs, and analyzed by flow cytometry. Representative dot histograms of PD-1 expression on CD4+ TEM are shown at the top. Moreover, PD-1 upregulation (mean ± SEM) of different CD4+ T-cell subsets after co-culture with tumor-derived MDSCs (n = 4 GBM patients) are shown at the bottom of the figure. Asterisks denote significant P values: *** P < .0001, ** P < .01.

Similar articles

Cited by

References

    1. Nagaraj S, Gabrilovich DI. Myeloid-derived suppressor cells in human cancer. Cancer J. 2010;16(4):348–353. - PubMed
    1. Condamine T, Gabrilovich DI. Molecular mechanisms regulating myeloid-derived suppressor cell differentiation and function. Trends Immunol. 2011;32(1):19–25. - PMC - PubMed
    1. Rodrigues JC, Gonzalez GC, Zhang L et al. . Normal human monocytes exposed to glioma cells acquire myeloid-derived suppressor cell-like properties. Neuro Oncol. 2010;12(4):351–365. - PMC - PubMed
    1. Solito S, Marigo I, Pinton L, Damuzzo V, Mandruzzato S, Bronte V. Myeloid-derived suppressor cell heterogeneity in human cancers. Ann N Y Acad Sci. 2014;1319:47–65. - PubMed
    1. Gabrilovich DI, Nagaraj S. Myeloid-derived suppressor cells as regulators of the immune system. Nat Rev Immunol. 2009;9(3):162–174. - PMC - PubMed

Publication types

MeSH terms