Review
. 2015 Nov 17;112(46):14105-12.
doi: 10.1073/pnas.1511465112.

Feeding the brain and nurturing the mind: Linking nutrition and the gut microbiota to brain development

Affiliations
Review

Feeding the brain and nurturing the mind: Linking nutrition and the gut microbiota to brain development

Manu S Goyal et al. Proc Natl Acad Sci U S A. .

Abstract

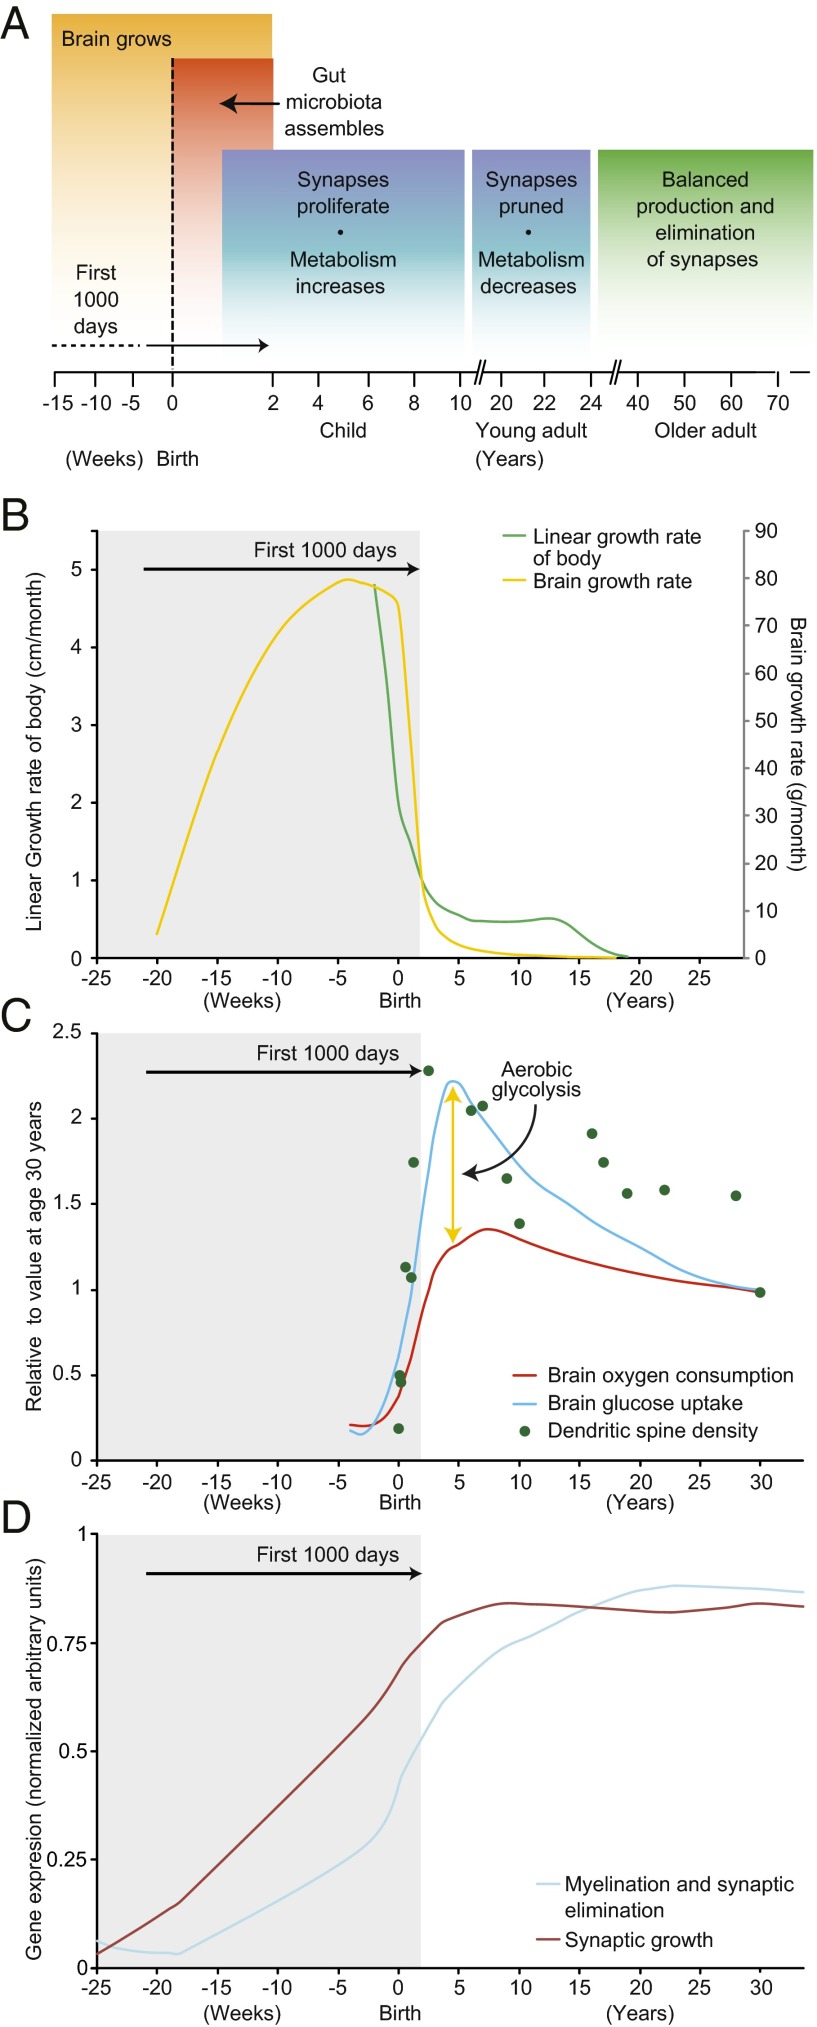
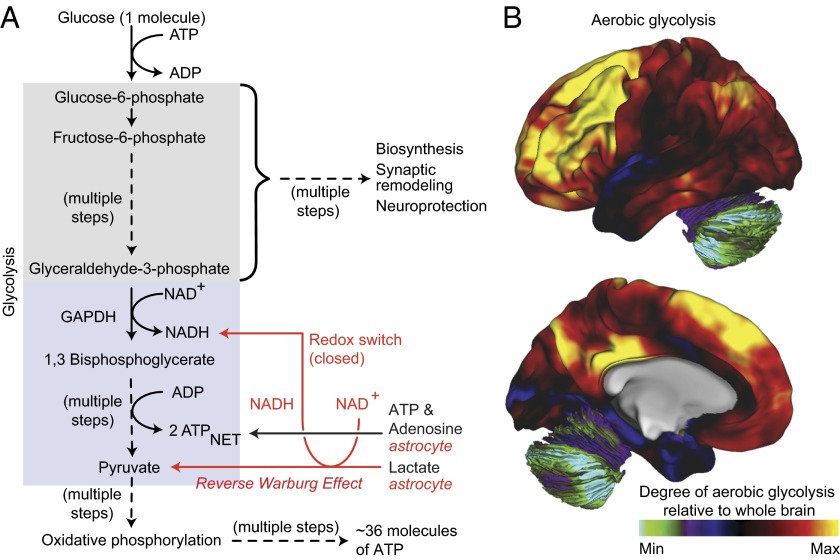
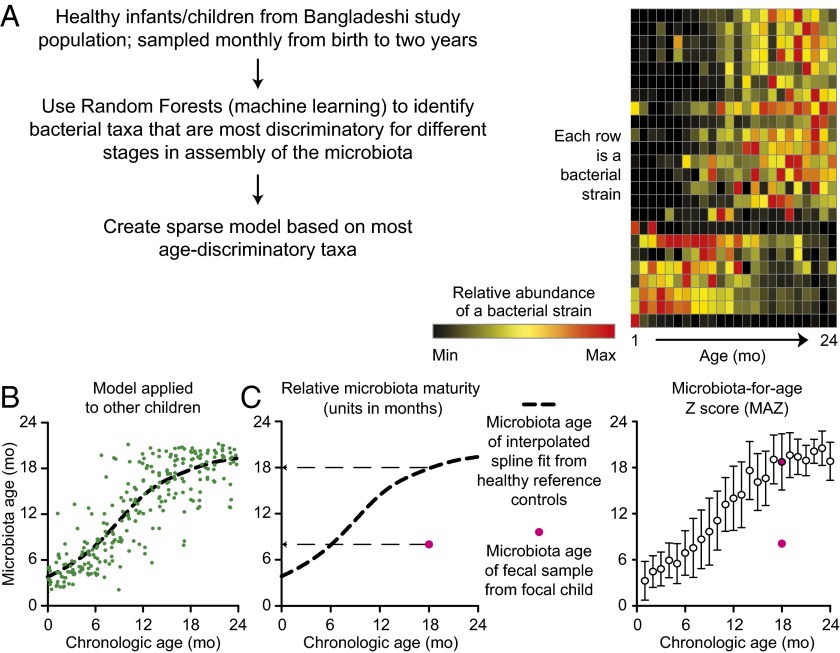
The human gut contains a microbial community composed of tens of trillions of organisms that normally assemble during the first 2-3 y of postnatal life. We propose that brain development needs to be viewed in the context of the developmental biology of this "microbial organ" and its capacity to metabolize the various diets we consume. We hypothesize that the persistent cognitive abnormalities seen in children with undernutrition are related in part to their persistent gut microbiota immaturity and that specific regions of the brain that normally exhibit persistent juvenile (neotenous) patterns of gene expression, including those critically involved in various higher cognitive functions such as the brain's default mode network, may be particularly vulnerable to the effects of microbiota immaturity in undernourished children. Furthermore, we postulate that understanding the interrelationships between microbiota and brain metabolism in childhood undernutrition could provide insights about responses to injury seen in adults. We discuss approaches that can be used to test these hypotheses, their ramifications for optimizing nutritional recommendations that promote healthy brain development and function, and the potential societal implications of this area of investigation.

Keywords: brain development; brain metabolism; childhood undernutrition; gut microbiota development.


Conflict of interest statement

Conflict of interest statement: J.I.G. is a cofounder of Matatu, Inc., a company characterizing the role of diet-by-microbiota interactions in animal health.

Figures

Fig. 1.
Fig. 1.
Development of the brain extends beyond the first 1,000 d. (A) An overview. Note that the gut microbiota assembles during the first 2–3 y after birth. (B) The growth rates of the brain (yellow line), and human body (green line) increase most rapidly during the first 1,000 d after conception (i.e., up to the end of the second year of postnatal life). (C) Dendritic spine density (green dots) and brain glucose uptake (blue line) are sustained well after the first 1,000 d. Although the brain’s oxygen consumption (red line) is also higher during this period, it is not nearly as high as the increase in glucose uptake, suggesting that much of the glucose is metabolized via aerobic glycolysis, in keeping with the high levels of synaptic growth and turnover during this time. Adapted from ref. . Note that the data shown are based on an invasive method (modified Kety–Schmidt technique for repeated measures of cerebral blood flow and metabolism, which requires continuous sampling of arterial and venous blood) and on PET imaging, which involves exposure to radiation; because these approaches are unlikely to be generally used in studies of children, there is an impetus to apply MRI-based methods to characterize some features of brain metabolism during development. (D) Cortical expression of human genes that control synaptic proliferation persists well beyond the period of synaptic “pruning” during adolescence. Stable synaptic density in the adult brain results from a balance between the expression of genes that control synaptic proliferation and elimination. Adapted from ref. .
Fig. 2.
Fig. 2.
Aerobic glycolysis in the brain. (A) In many cell types, glucose is efficiently catabolized to generate ATP via oxidative phosphorylation in mitochondria. However, under conditions where oxygen is limiting, glucose is converted to lactate via anaerobic glycolysis. In contrast, certain unicellular organisms and mammalian cell lineages (e.g., fibroblasts, lymphocytes, and those obtained from various cancers) preferentially convert glucose to lactate regardless of the availability of oxygen. This nonoxidative process is referred to as aerobic glycolysis and is thought to occur primarily to increase production of intermediary metabolites from glycolysis that can enter biosynthetic pathways. In addition, neurons consume lactate released by astrocytes, presumably as a substrate for energy generation akin to a similar process found in some cancer cells (reverse Warburg effect). This neuronal lactate consumption would further be predicted to alter the redox potential of neurons (redox switch) and thereby redirect glycolysis to support other biosynthetic and neuroprotective pathways (i.e., biosynthesis and neuroprotection). The colored boxes denote the elements of glycolysis involved in biosynthesis and neuroprotection (gray), and those involved in energy generation (blue). (B) Regional variation in the levels of aerobic glycolysis in the lateral and medial surfaces of 33 healthy adult human brains (31). The numbers on the color scale indicate the glycolytic index: This metric represents the degree of aerobic glycolysis normalized to whole brain.
Fig. 3.
Fig. 3.
Maturation of the gut microbiota. The gut microbiota is acquired beginning at birth and attains a configuration similar to that of adults during the first 2–3 y of postnatal life, during which time the brain’s synaptic density and rate of glucose uptake are quickly rising. (A) The approach used to identify age-discriminatory bacterial strains in the microbiota of members of a birth cohort living in Bangladesh with healthy growth phenotypes, as defined by anthropometry. A sparse 24-strain Random Forests model, comprising the most age-discriminatory organisms, provides a microbial signature for defining a postnatal developmental program of microbiota assembly shared across biologically unrelated infants and children. Each row represents one of the 24 bacterial strains. Each column represents the postnatal month where fecal samples were obtained. The different colors represent relative abundances of each bacterial strain in the microbiota as a function of the infant/child’s chronological age. (B) Using the model described in A, a “microbiota age” is assigned to individual fecal samples collected from healthy children of various ages. Each circle is a separate fecal sample collected from members of the birth cohort over time. The dashed line represents a spline fit of the data. (C) Two metrics describing postnatal development of the microbiota can be defined using the model: relative microbiota maturity and microbiota-for-age Z score. The latter represents the extent of deviation of a given individual’s microbiota from the median ± SD of the reference healthy cohort. Red circles in the plots represent an immature gut microbiota from an 18-mo-old child with severe acute undernutrition. Adapted from ref. .

References

    1. Raichle ME, et al. A default mode of brain function. Proc Natl Acad Sci USA. 2001;98(2):676–682. - PMC - PubMed
    1. Raichle ME. The brain’s default mode network. Annu Rev Neurosci. 2015;38:433–447. - PubMed
    1. Raichle ME. The restless brain: How intrinsic activity organizes brain function. Philos Trans R Soc Lond B Biol Sci. 2015;370(1668):20140172. - PMC - PubMed
    1. Moffitt TE, et al. A gradient of childhood self-control predicts health, wealth, and public safety. Proc Natl Acad Sci USA. 2011;108(7):2693–2698. - PMC - PubMed
    1. Ahmed T, et al. An evolving perspective about the origins of childhood undernutrition and nutritional interventions that includes the gut microbiome. Ann N Y Acad Sci. 2014;1332:22–38. - PMC - PubMed

Publication types