

Temperature compensation and temperature sensation in the circadian clock
- PMID: 26578788
- PMCID: PMC4655526
- DOI: 10.1073/pnas.1511215112
Temperature compensation and temperature sensation in the circadian clock
Abstract
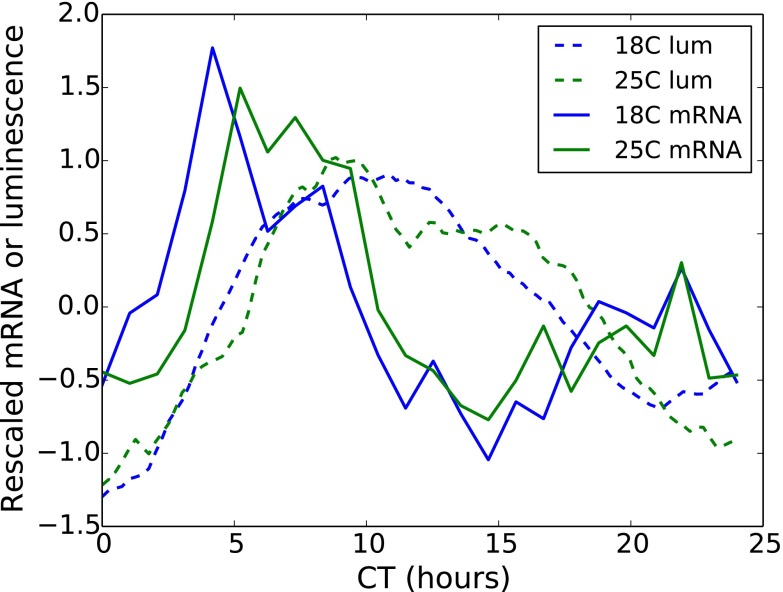
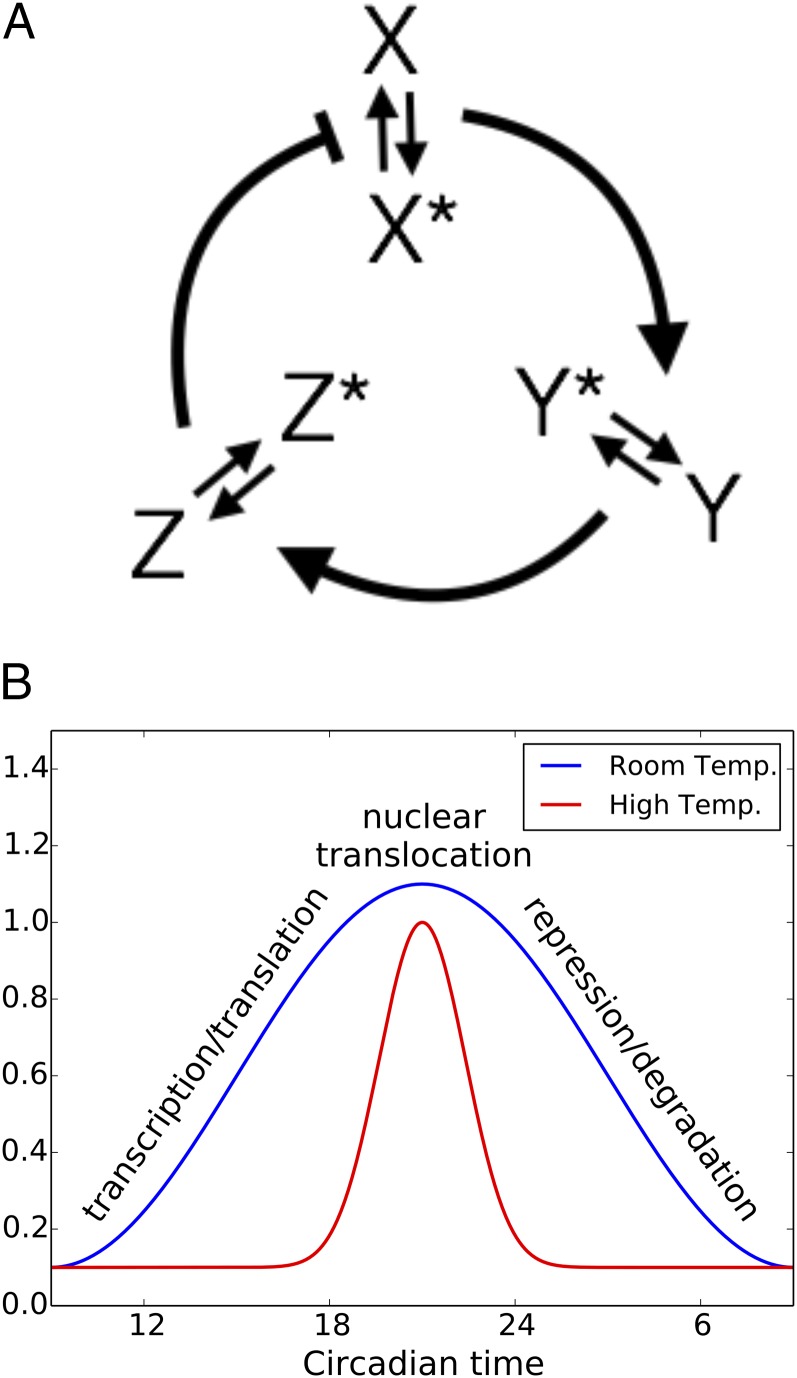
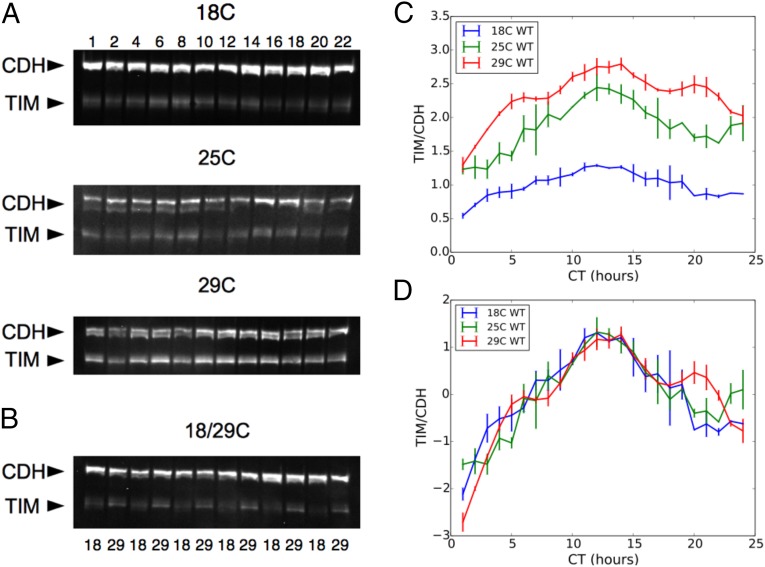
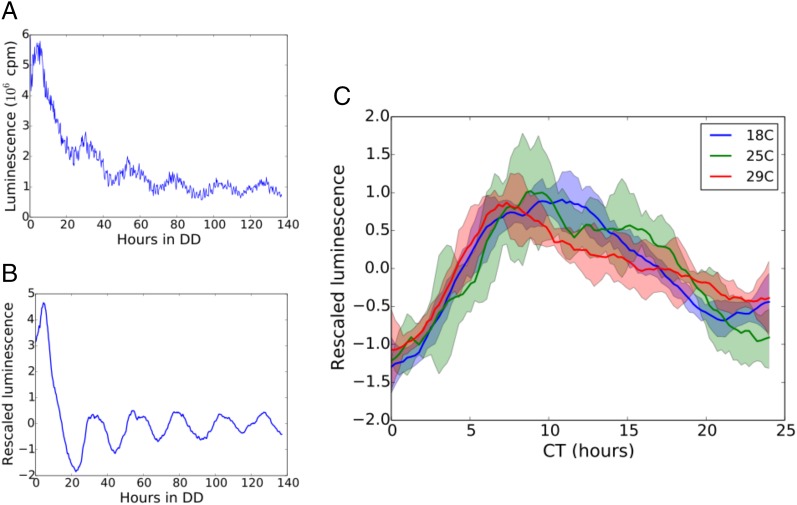
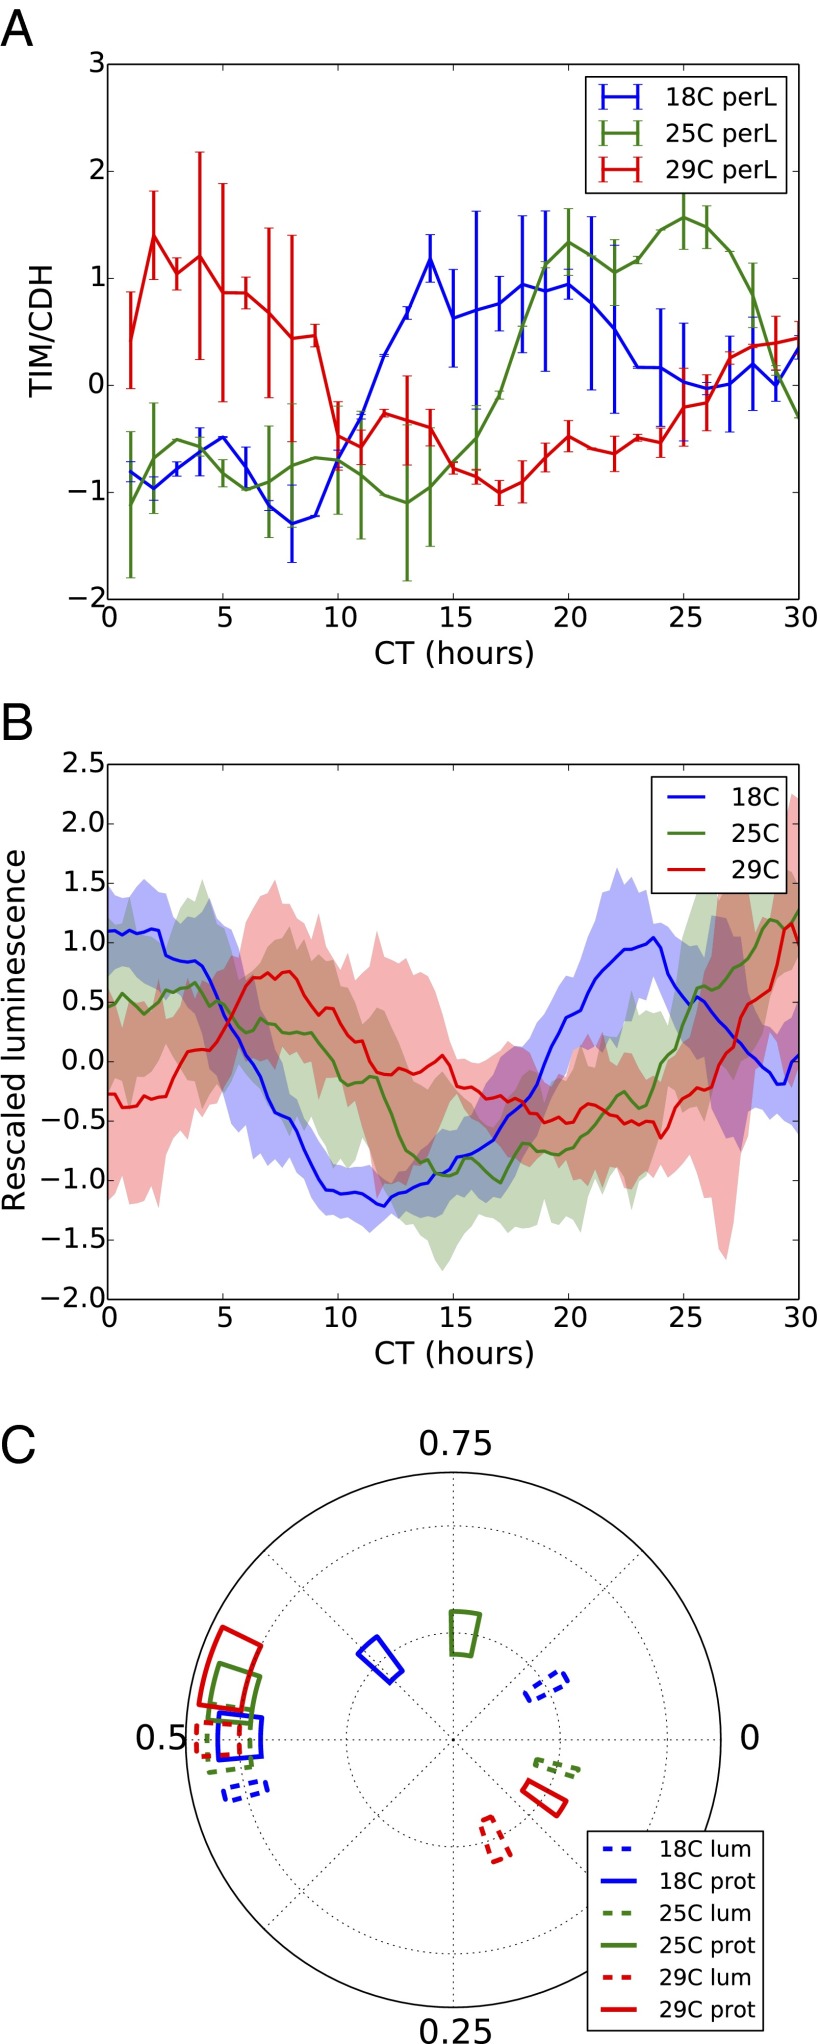
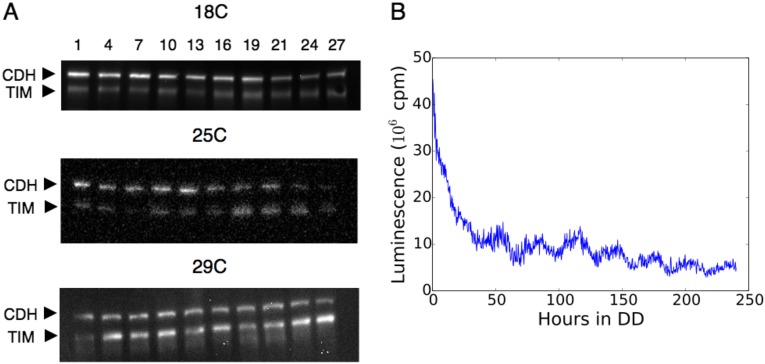
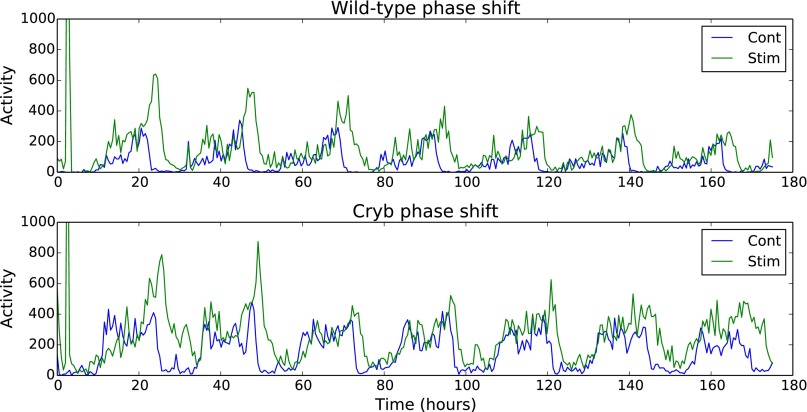
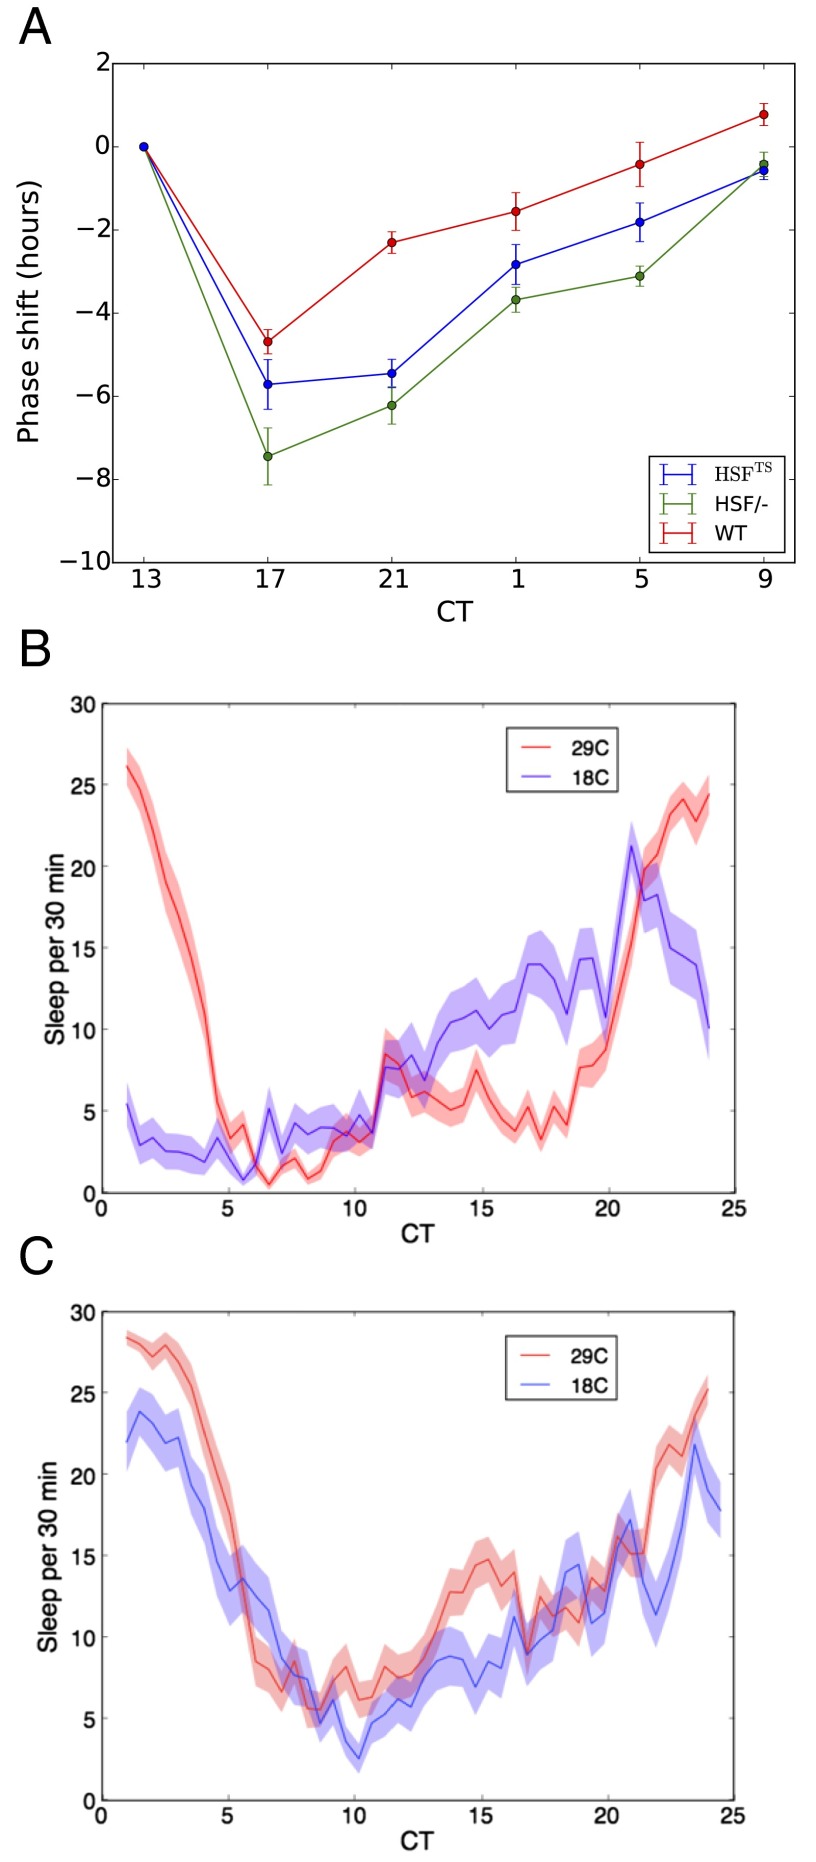
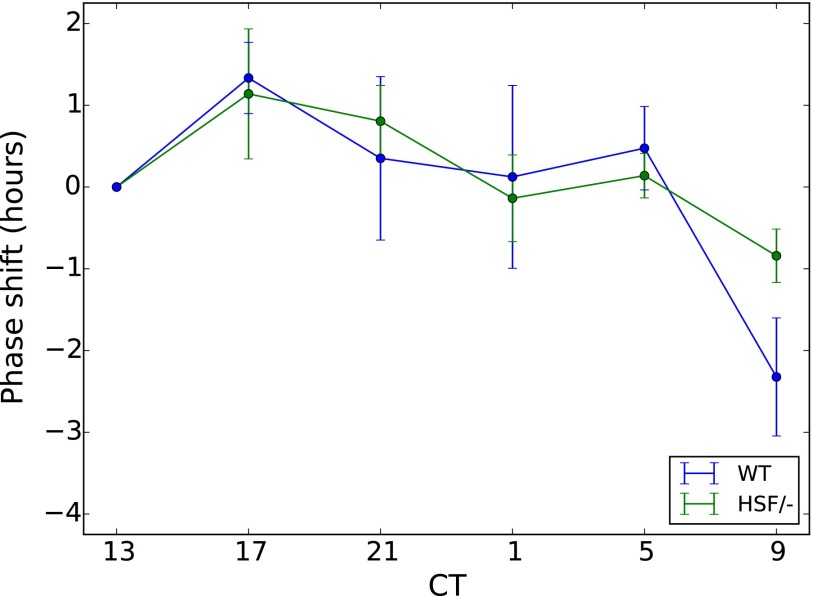
All known circadian clocks have an endogenous period that is remarkably insensitive to temperature, a property known as temperature compensation, while at the same time being readily entrained by a diurnal temperature oscillation. Although temperature compensation and entrainment are defining features of circadian clocks, their mechanisms remain poorly understood. Most models presume that multiple steps in the circadian cycle are temperature-dependent, thus facilitating temperature entrainment, but then insist that the effect of changes around the cycle sums to zero to enforce temperature compensation. An alternative theory proposes that the circadian oscillator evolved from an adaptive temperature sensor: a gene circuit that responds only to temperature changes. This theory implies that temperature changes should linearly rescale the amplitudes of clock component oscillations but leave phase relationships and shapes unchanged. We show using timeless luciferase reporter measurements and Western blots against TIMELESS protein that this prediction is satisfied by the Drosophila circadian clock. We also review evidence for pathways that couple temperature to the circadian clock, and show previously unidentified evidence for coupling between the Drosophila clock and the heat-shock pathway.
Keywords: circadian clock; mathematical models; temperature compensation.
Conflict of interest statement
The authors declare no conflict of interest.
Figures
Similar articles
-
Temperature-dependent resetting of the molecular circadian oscillator in Drosophila.Proc Biol Sci. 2014 Oct 22;281(1793):20141714. doi: 10.1098/rspb.2014.1714. Proc Biol Sci. 2014. PMID: 25165772 Free PMC article.
-
A novel period mutation implicating nuclear export in temperature compensation of the Drosophila circadian clock.Curr Biol. 2023 Jan 23;33(2):336-350.e5. doi: 10.1016/j.cub.2022.12.011. Epub 2022 Dec 29. Curr Biol. 2023. PMID: 36584676
-
Circadian clock neurons constantly monitor environmental temperature to set sleep timing.Nature. 2018 Mar 1;555(7694):98-102. doi: 10.1038/nature25740. Epub 2018 Feb 21. Nature. 2018. PMID: 29466329
-
Timeless in animal circadian clocks and beyond.FEBS J. 2022 Nov;289(21):6559-6575. doi: 10.1111/febs.16253. Epub 2021 Nov 18. FEBS J. 2022. PMID: 34699674 Free PMC article. Review.
-
Setting the clock--by nature: circadian rhythm in the fruitfly Drosophila melanogaster.FEBS Lett. 2011 May 20;585(10):1435-42. doi: 10.1016/j.febslet.2011.02.028. Epub 2011 Feb 25. FEBS Lett. 2011. PMID: 21354415 Review.
Cited by
-
Principles of the animal molecular clock learned from Neurospora.Eur J Neurosci. 2020 Jan;51(1):19-33. doi: 10.1111/ejn.14354. Epub 2019 Feb 21. Eur J Neurosci. 2020. PMID: 30687965 Free PMC article. Review.
-
Decanalizing thinking on genetic canalization.Semin Cell Dev Biol. 2019 Apr;88:54-66. doi: 10.1016/j.semcdb.2018.05.008. Epub 2018 May 24. Semin Cell Dev Biol. 2019. PMID: 29751086 Free PMC article. Review.
-
Robust network topologies for generating oscillations with temperature-independent periods.PLoS One. 2017 Feb 2;12(2):e0171263. doi: 10.1371/journal.pone.0171263. eCollection 2017. PLoS One. 2017. PMID: 28152061 Free PMC article.
-
A comparative study on the circadian rhythm of the electrical signals of Broussonetia papyrifera and Morus alba.Plant Signal Behav. 2021 Nov 2;16(11):1950899. doi: 10.1080/15592324.2021.1950899. Epub 2021 Jul 6. Plant Signal Behav. 2021. PMID: 34227908 Free PMC article.
-
Temperature-driven coordination of circadian transcriptional regulation.PLoS Comput Biol. 2024 Apr 22;20(4):e1012029. doi: 10.1371/journal.pcbi.1012029. eCollection 2024 Apr. PLoS Comput Biol. 2024. PMID: 38648221 Free PMC article.
References
-
- Shaw PJ, Cirelli C, Greenspan RJ, Tononi G. Correlates of sleep and waking in Drosophila melanogaster. Science. 2000;287(5459):1834–1837. - PubMed
-
- Toh KL, et al. An hPer2 phosphorylation site mutation in familial advanced sleep phase syndrome. Science. 2001;291(5506):1040–1043. - PubMed
-
- Brown SA, Zumbrunn G, Fleury-Olela F, Preitner N, Schibler U. Rhythms of mammalian body temperature can sustain peripheral circadian clocks. Curr Biol. 2002;12(18):1574–1583. - PubMed
Publication types
MeSH terms
Substances
Grants and funding
LinkOut - more resources
Full Text Sources
Other Literature Sources
Molecular Biology Databases
