. 2015 Nov 17;112(46):E6311-20.
doi: 10.1073/pnas.1518376112. Epub 2015 Nov 2.

Epidermal development, growth control, and homeostasis in the face of centrosome amplification

Affiliations

Epidermal development, growth control, and homeostasis in the face of centrosome amplification

Anita Kulukian et al. Proc Natl Acad Sci U S A. .

Abstract

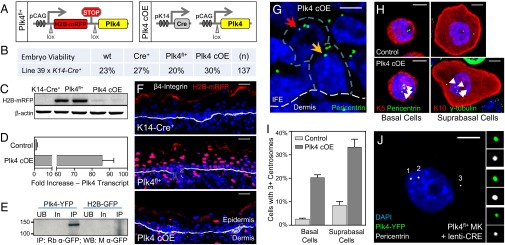
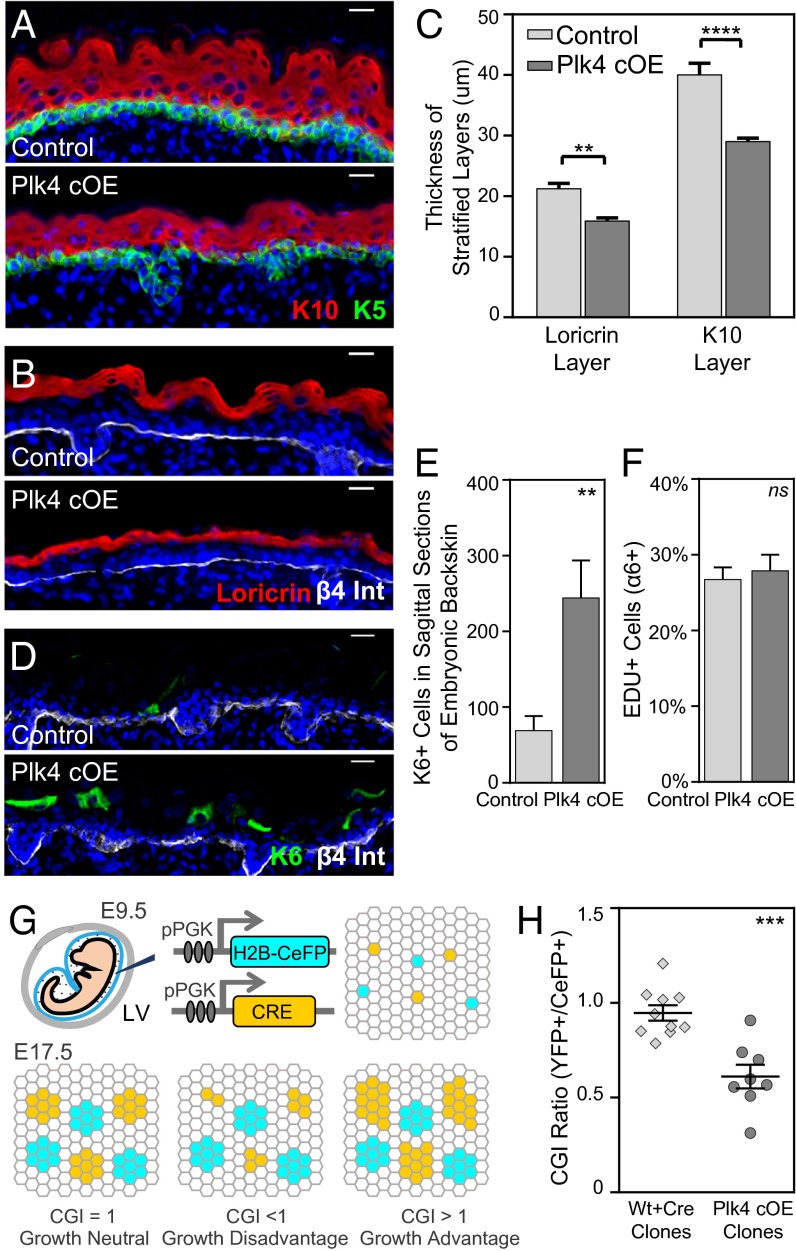
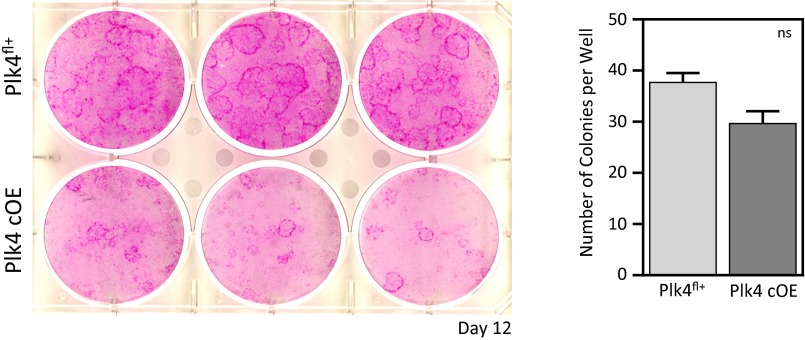
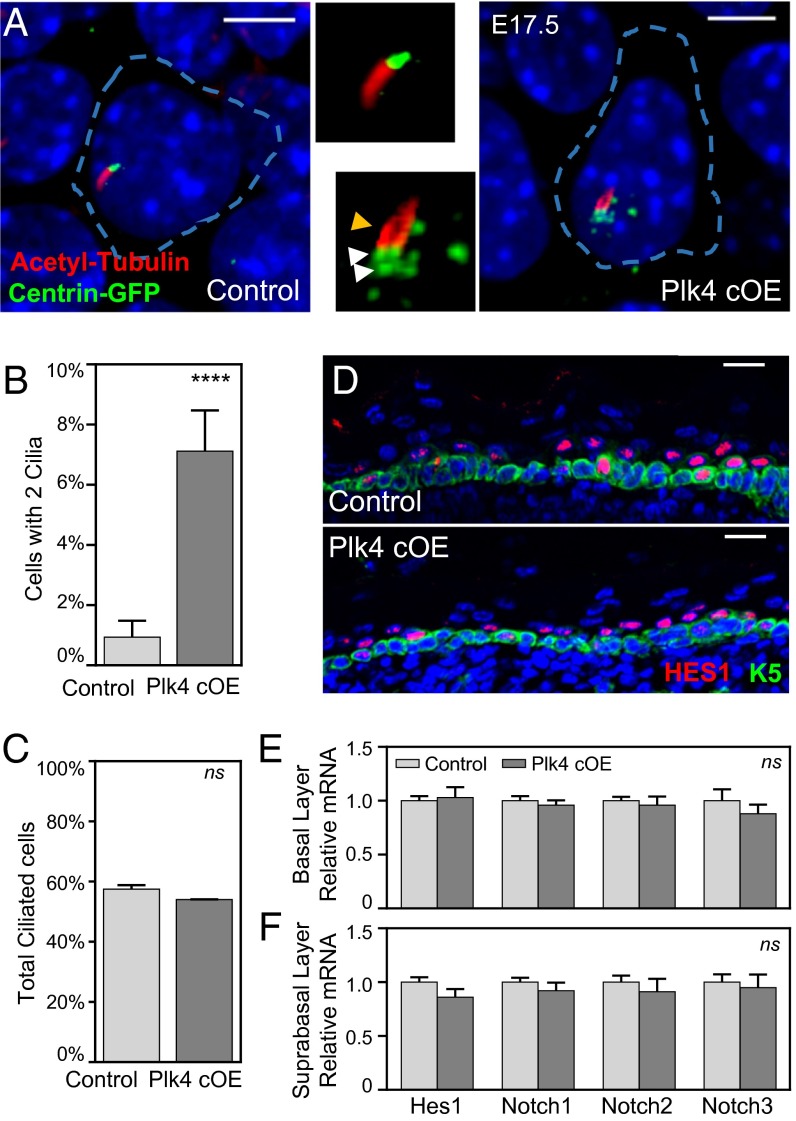
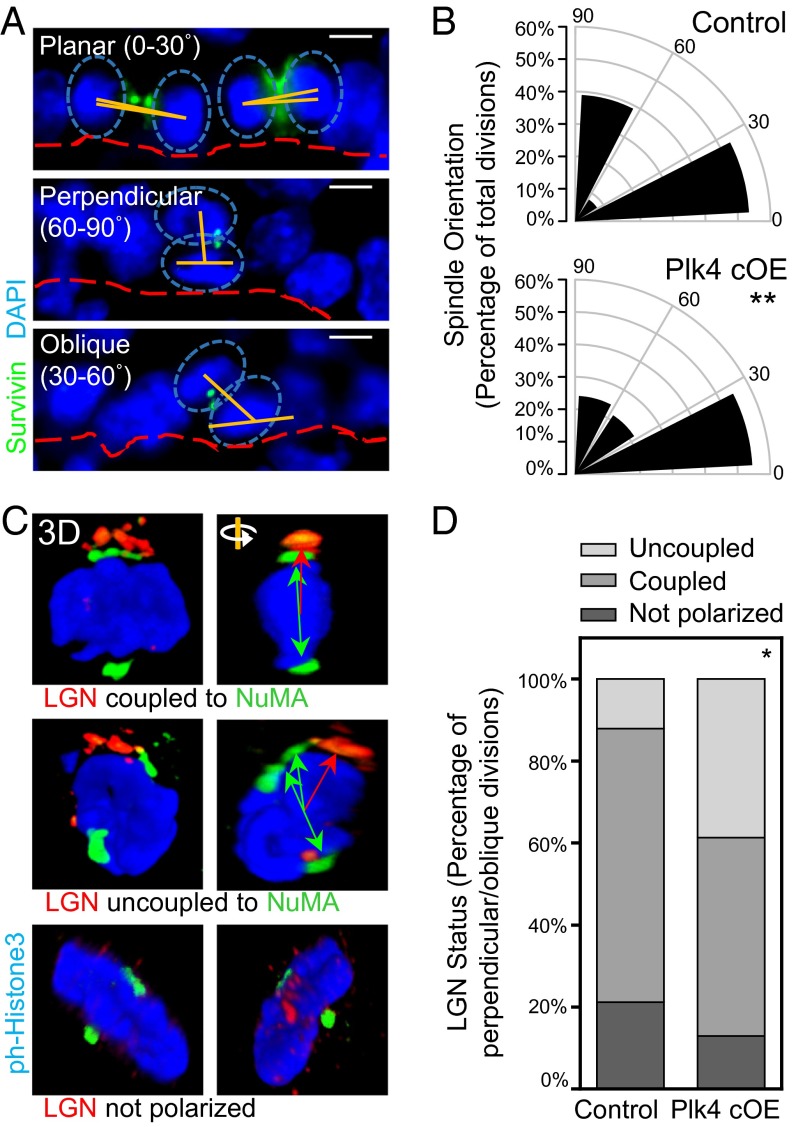
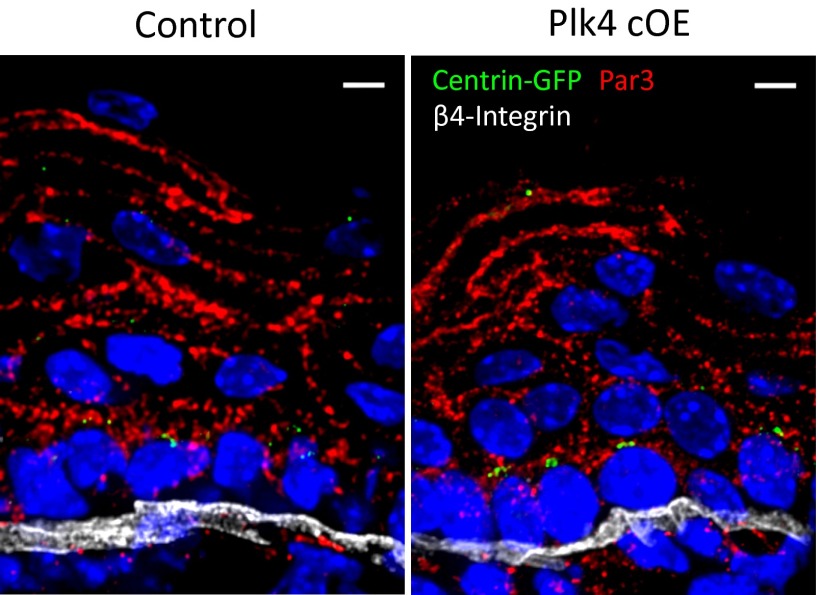
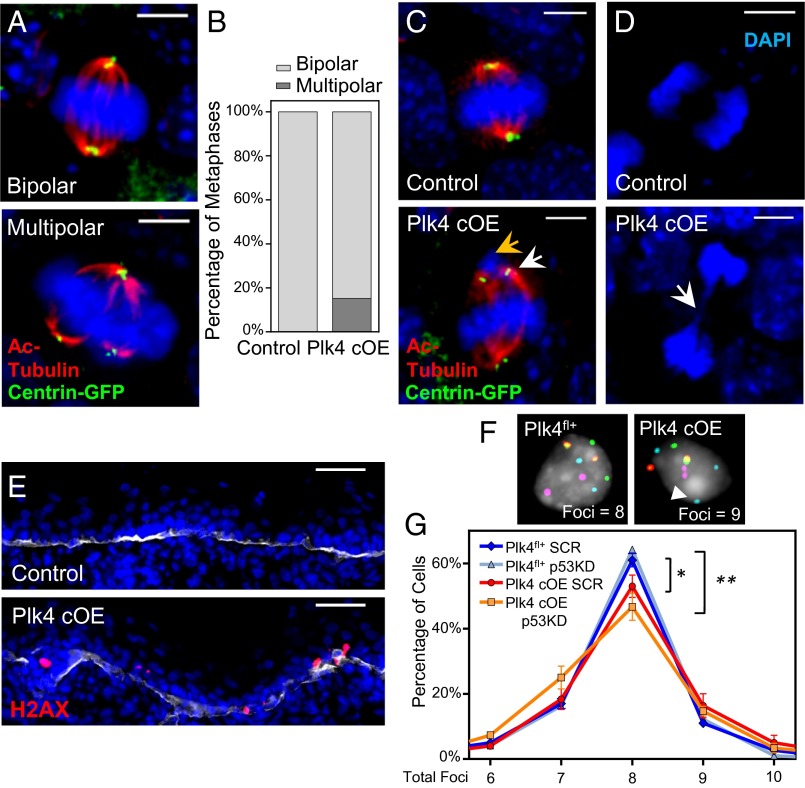
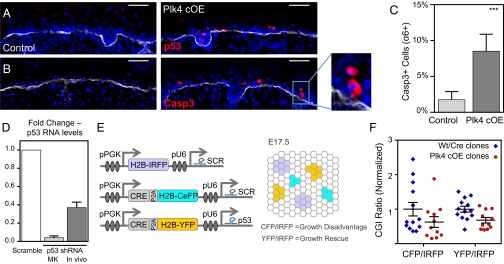
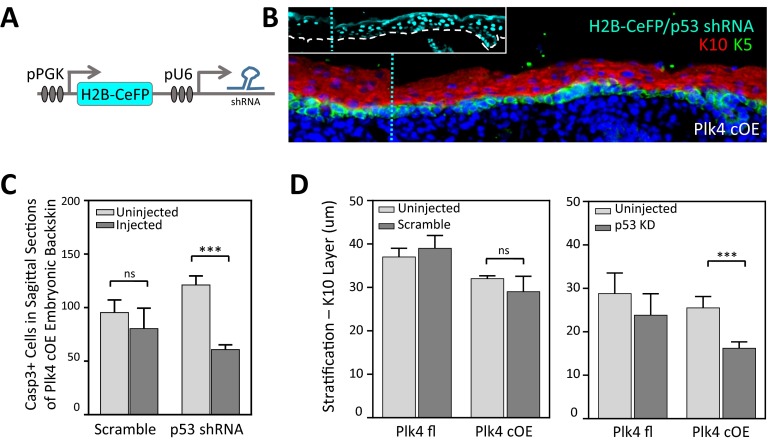
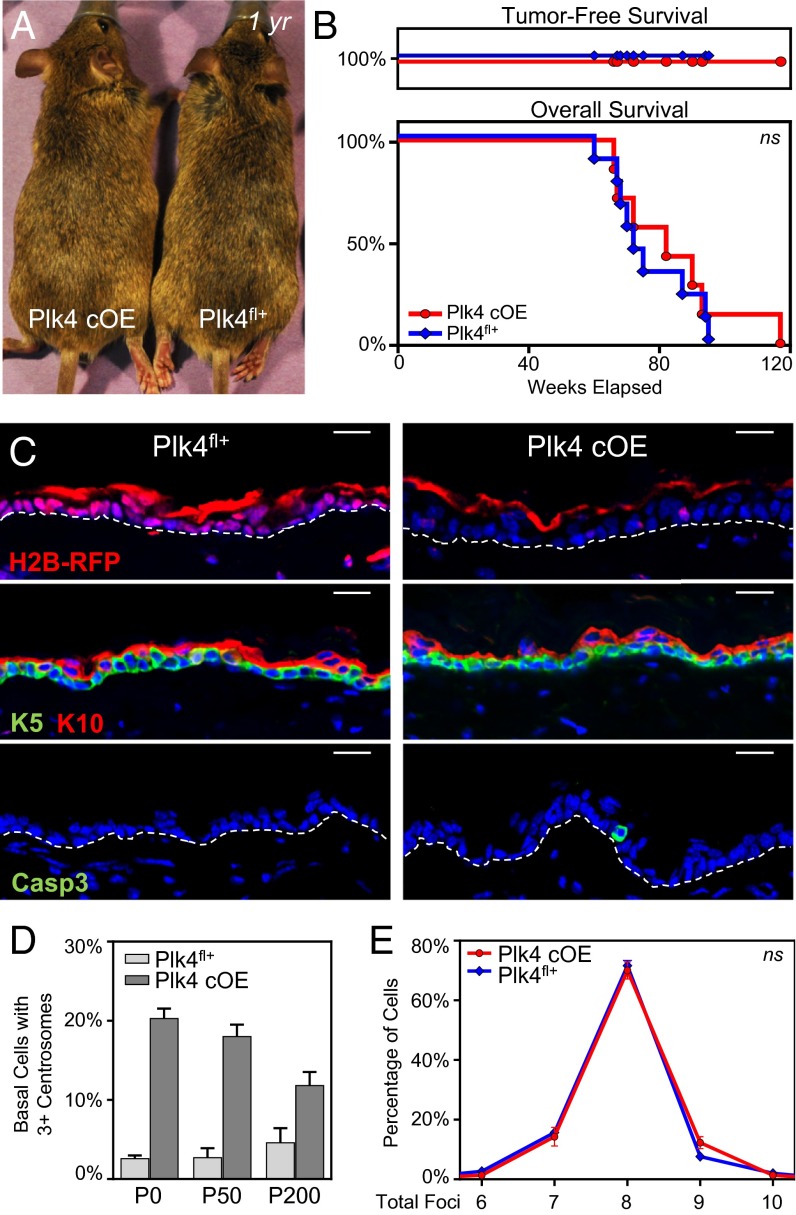
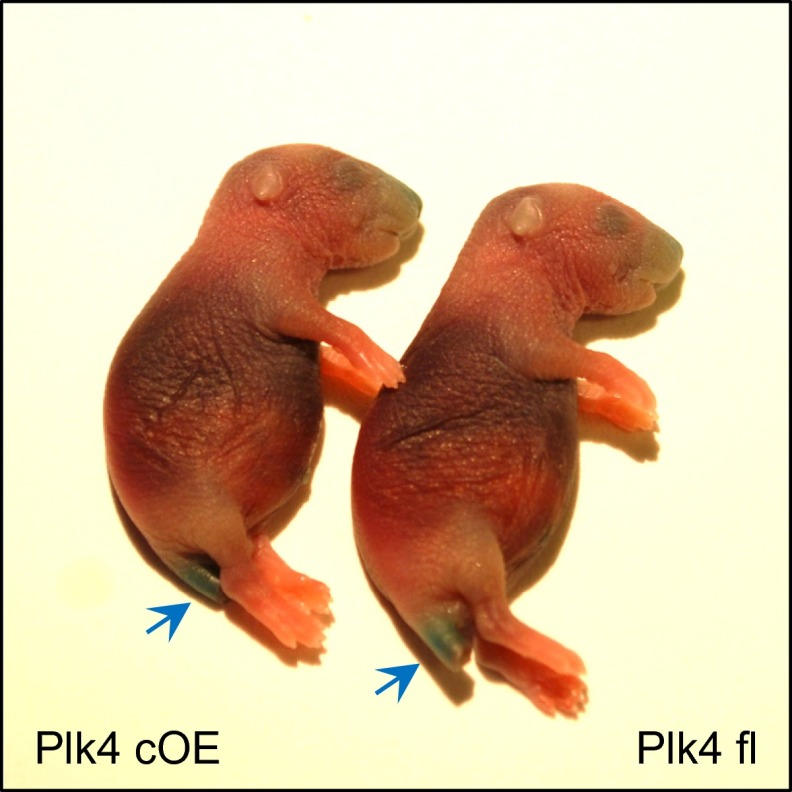
As nucleators of the mitotic spindle and primary cilium, centrosomes play crucial roles in equal segregation of DNA content to daughter cells, coordination of growth and differentiation, and transduction of homeostatic cues. Whereas the majority of mammalian cells carry no more than two centrosomes per cell, exceptions to this rule apply in certain specialized tissues and in select disease states, including cancer. Centrosome amplification, or the condition of having more than two centrosomes per cell, has been suggested to contribute to instability of chromosomes, imbalance in asymmetric divisions, and reorganization of tissue architecture; however, the degree to which these conditions are a direct cause of or simply a consequence of human disease is poorly understood. Here we addressed this issue by generating a mouse model inducing centrosome amplification in a naturally proliferative epithelial tissue by elevating Polo-like kinase 4 (Plk4) expression in the skin epidermis. By altering centrosome numbers, we observed multiciliated cells, spindle orientation errors, and chromosome segregation defects within developing epidermis. None of these defects was sufficient to impart a proliferative advantage within the tissue, however. Rather, impaired mitoses led to p53-mediated cell death and contributed to defective growth and stratification. Despite these abnormalities, mice remained viable and healthy, although epidermal cells with centrosome amplification were still appreciable. Moreover, these abnormalities were insufficient to disrupt homeostasis and initiate or enhance tumorigenesis, underscoring the powerful surveillance mechanisms in the skin.

Keywords: Plk4; centrosome amplification; epidermal development; mitosis.


Conflict of interest statement

The authors declare no conflict of interest.

Figures

Fig. 1.
Fig. 1.
Mice overexpressing Plk4 have extra centrosomes in cells of the interfollicular epidermis (IFE). (A) Transgene expression cassette for the induction of Plk4, and epidermal-specific activation of the transgene. Note that Plk4 contains a YFP tag added to its C terminus, which proved useful in vitro and also for Western blotting, but not epifluorescence imaging, of frozen skin sections. (B) Genotype percentages of F1 generation mice at time of birth when Plk4fl+ animals are mated to mice expressing Cre driven by the epidermal-specific K14 promoter. (C) Immunoblot of transgene reporter H2B-mRFP expression in isolated E17.5 epidermis from corresponding genotypes, with β-actin as a loading control. (D) Quantification by qRT-PCR of Plk4 expression levels in isolated epidermis of eight control and three Plk4 cOE embryos. Error bars indicate SEM. (E) Immunoblot of YFP-tagged Plk4 expressed in cultured keratinocytes and immunoprecipitated using an anti-GFP antibody. H2B-GFP was transfected into keratinocytes as a control for the immunoprecipitation scheme. UB, unbound fraction; In, input fraction; IP, immunoprecipitated fraction. (F) Immunofluorescence images of IFE sections demonstrating expression of the H2B-mRFP reporter in the dermis and epidermis. DAPI is in blue. (Scale bar: 25 μm.) (G) Immunofluorescence images of Plk4-overexpressing skin demonstrating the presence of cells with extra centrosomes in both the basal layer (yellow arrow) and the suprabasal layer (red arrow) of the epidermis, exemplified by the presence of more than two foci marked by pericentrin, a centrosomal marker. The white dashed line represents the basement membrane. The blue dashed line demarcates the cell periphery. DAPI is in blue. (Scale bar: 5 μm.) (H and I) Images (H) and quantification (I) of centrosome number in isolated cells of the basal (K5+) and suprabasal (K10+) layers of the IFE, after dissociation, cytospinning, and immunostaining. Basal cells: eight control and four Plk4 cOE embryos; suprabasal cells: six control and four Plk4 cOE embryos. DAPI is in blue. Error bars represent SEM. (Scale bar: 5 μm.) (J) Immunofluorescence images of primary keratinocytes (MK) cultured from Plk4fl+ mice and infected with lentivirus expressing Cre. These cells express Plk4-YFP and have extra centrosomes, as numbered and depicted in the enlarged panels (top to bottom, 1–3). (Scale bar: 10 μm.)
Fig. 2.
Fig. 2.
Growth and stratification is impaired in embryonic epidermal tissue with extra centrosomes. (A–C) Immunofluorescence images and quantifications of reduced stratification in the spinous layer (K10+) and granular layer (Loricrin+) of E17.5 Plk4 cOE epidermis compared with control (seven control and four Plk4 cOE embryos). DAPI is in blue. Error bars represent SEM. (Scale bar: 20 μm.) (D and E) Immunofluorescence images and quantification of induced K6 expression in E17.5 epidermis (seven control and four Plk4 cOE embryos). DAPI is in blue. Error bars represent SEM. (Scale bar: 20 μm.) (F) Quantification of EdU+ cells of FACS-sorted epidermal cell population in E17.5 back skin (31 control and 10 Plk4 cOE embryos from three litters). Error bars represent SEM. (G) Schematic summary of the CGI assay. A combination of lentiviruses, one expressing Cre and the other expressing CeFP, was injected into the amniotic sac of embryos (either wt or Plk4fl+) with a Rosa26 lox-STOP-loxYFP/+ background to transduce the epidermis on a clonal scale at E9.5. The outgrowth of the clones was evaluated at E17.5 by FACS, and the ratio of YFP+/CeFP+ was calculated to obtain a CGI. (H) Calculated CGI ratios of R26YFP;wt and R26YFP;Plk4fl+ embryos transduced with Cre to produce wt/Cre and Plk4 cOE clones (10 wt and 8 Plk4fl+ embryos from two litters). Error bars indicate SEM.
Fig. S1.
Fig. S1.
Colony formation efficiency is not altered in Plk4 cOE cells, but smaller colonies indicate growth deficiency. Colony formation assays from cultured keratinocytes comparing growth capabilities of either control (Plk4fl+; n = 3 embryos) or Plk4-overexpressing cells (Plk4 cOE; n = 3 embryos). Error bars represent SEM.
Fig. 3.
Fig. 3.
Centrosome amplification induces morphological defects in cilia in a small fraction of cells, with no global effect on Notch signaling. (A) Immunofluorescence images with enlarged panels of E17.5 whole-mount epidermis depicting cells with extra centrosomes that have a second cilium emanating from a nearby centriole. White arrowheads point to extra centrosomes; the yellow arrowhead points to second cilium. Blue dashed lines mark cell boundaries based on E-cadherin staining. DAPI is in blue. (Scale bar: 5 μm.) (B) Quantitation of the number of cilia per basal cell; 320 control and 365 Plk4 cOE cells were counted from at least two embryos. Error bars indicate SEM.) (C) Quantitation of the total number of ciliated cells in the basal layer; 161 control and 180 Plk4 cOE cells were counted from at least two embryos. Error bars indicate SEM. (D) Immunofluorescence images of HES1 within the E17.5 epidermis demonstrates unperturbed Notch pathway activation. DAPI is in blue. (Scale bar: 20 μm.) (E and F) Quantification of Notch by qRT-PCR of purified basal epidermal cells (E) and suprabasal cells (F) from 12 control and 4 Plk4 cOE embryos. Error bars represent SEM.
Fig. 4.
Fig. 4.
Centrosome amplification induces defects in spindle orientation by uncoupling the spindle from cortical cues. (A and B) Immunofluorescence images (A) and quantification (B) of IFE basal cells undergoing planar, perpendicular, and oblique divisions, as determined by the angle of spindle orientation (90 control and 79 Plk4 cOE divisions from three embryos each). The proportion of perpendicularly oriented spindles is skewed toward oblique orientations in Plk4 cOE tissue. Cells were stained for β4-integrin to mark the basement membrane, and with survivin to mark the linkage between two dividing cells in either anaphase or telophase. Spindle orientation was measured by the relative angle (orange lines) between the two centers of mass of DNA (blue ovals) and the basement membrane (red dashed lines). Statistical significance was established with Fisher’s exact t test. (Scale bar: 5 μm.) (C and D) Immunofluorescence images with 3D confocal reconstruction (C) and quantification (D) of LGN crescents and relative NuMA localization (69 control and 67 Plk4 cOE mitotic cells from three embryos each.) In wt skin, asymmetric cell divisions, accompanied by NOTCH/HES1 suprabasal signaling, occur when the two are coupled. In Plk4 cKO skin, there is a greater fraction of cells in which the two are uncoupled. Green double-headed arrows represent the orientation of spindle poles, and red arrows represent the corresponding alignment with the cortical LGN crescent. Statistical significance was established with Fisher’s exact t test.
Fig. S2.
Fig. S2.
Centrosome amplification does not induce defects in apicobasal polarity. Immunofluorescence images of E17.5 epidermis demonstrating that apicobasal polarity is intact in Plk4 overexpressing tissue. DAPI is in blue: (Scale bar: 5 μm.)
Fig. 5.
Fig. 5.
Centrosome amplification induces mitotic errors during cell division in the IFE, resulting in DNA damage and aneuploidy. (A, C, and D) Immunofluorescence images of mitotic cells in E17.5 whole-mounted epidermis. Images highlight multipolar mitoses in cells with extra centrosomes (A), misaligned chromosomes (yellow arrow) resulting from the formation of bipolar spindles when extra centrosomes cluster together (white arrow) (C), and chromatin bridges (white arrow) of sheared chromosomes (D). DAPI is in blue. (Scale bar: 5 μm.) (B) Quantification of mitotic cells at the metaphase stage in either bipolar or multipolar configuration; 32 control and 33 Plk4 cOE mitotic cells, from two embryos each. (E) Immunofluorescence images of epidermis stained for γ-H2AX as a measure of DNA damage. DAPI is in blue; β4-integrin is in white. (Scale bar: 40 μm.) (F and G) Representative images (F) and quantification (G) of FISH analysis using four chromosomal probes to gauge aneuploidy, measured by the presence of more than two or less than two foci per probe (white arrowhead); 100+ cells scored from each of three embryos per genotype/shRNA. Plk4 cOE cells have an increased frequency of aneuploid cells, which is further exacerbated when p53 levels are reduced. Error bars represent SEM.
Fig. 6.
Fig. 6.
Centrosome amplification induces p53-mediated activation of caspase-3, but reduced p53 levels rescue growth deficiency only minimally. (A and B) Immunofluorescence images of E17.5 IFE, stained for p53 (A) and cleaved caspase3 (B) to mark the apoptotic cells. Apoptotic cells can often be found adjacent to each other (Inset), suggesting a recent division. DAPI is in blue; β4-integrin is in white. (Scale bar: 40 μm.) (C) Quantification of apoptotic cells in purified epidermal cells; 30 control and 12 Plk4 cOE embryos from three litters. Error bars represent SEM. (D) Quantification of p53 knockdown efficiency in cultured keratinocytes (in vitro) and in cells isolated from embryos (in vivo) by qRT-PCR. (in vitro, three replicate experiments; in vivo, four embryos each of with and without knockdown. Error bars represent SEM. (E) Schematic of the modified CGI assay to assess the growth capacity of Plk4 cOE clones in a p53 knockdown background compared with scramble control. A combination of three lentiviruses was injected as depicted, with H2B-IRFP serving as an internal control. (F) Calculated CGI ratios of either wt (n = 11) or Plk4fl+ (n = 13) embryos transduced with Cre to produce wt/Cre or Plk4 cOE clones. Error bars represent SEM.
Fig. S3.
Fig. S3.
p53 knockdown does not rescue stratification defect. (A) Schematic of shRNA-expressing lentiviral constuct to transduce epidermis, with CeFP reporter. (B) Immunofluorescence image of lentivirus-infected Plk4 cOE epidermis with p53 knockdown. (Inset) Regions of low and high infectivity, delineated by the blue dashed line. DAPI is in blue. (C and D) Quantification of apoptotic cells in sagittal sections (C) and spinous layer stratification (D) in embryos transduced with lentivirus expressing either Scramble control or p53 shRNA. Error bars represent SEM.
Fig. 7.
Fig. 7.
Plk4 cOE adult mice do not develop spontaneous tumors and have normal skin and hair. (A) Images of mice aged 1 year with a full hair coat, demonstrating normal hair and skin. (B) Kaplan–Meier curves of tumor-free (Upper) and overall (Lower) survival of aged Plk4 cOE mice (nine Plk4fl+ and seven Plk4 cOE animals). (C) Immunofluorescence images of epidermis from aged mice stained for mRFP to demonstrate transgene expression, K5 and K10 to highlight the epidermal layers, and caspase3 to mark apoptotic cells. White dashed lines depicts basement membrane. DAPI is in blue. (Scale bar: 20 um.) (D) Quantification of centrosome number in basal cells of adult mice at postnatal time points P0 (eight Plk4fl+ and four Plk4 cOE animals), P50 (three Plk4fl+ and three Plk4 cOE P50 animals), and P200 (three Plk4fl+ and three Plk4 cOE animals). Error bars represent SEM. (E) Aneuploidy analysis by FISH in epidermal cells isolated from aging mice; 100+ cells scored from each of three animals per genotype. Error bars represent SEM.
Fig. S4.
Fig. S4.
Skin barrier function is not compromised in animals overexpressing Plk4. Images of Plk4fl+ and Plk4 cOE newborn pups subjected to outside-in barrier assay. Compromised epidermis stains blue, as observed in the clipped tail segment (blue arrow). Absence of stain denotes a functional barrier.

References

    1. Nigg EA, Stearns T. The centrosome cycle: Centriole biogenesis, duplication and inherent asymmetries. Nat Cell Biol. 2011;13(10):1154–1160. - PMC - PubMed
    1. Tsou MF, Stearns T. Mechanism limiting centrosome duplication to once per cell cycle. Nature. 2006;442(7105):947–951. - PubMed
    1. Fırat-Karalar EN, Stearns T. The centriole duplication cycle. Philos Trans R Soc Lond B Biol Sci. 2014;369(1650):20130460. - PMC - PubMed
    1. Bettencourt-Dias M, Hildebrandt F, Pellman D, Woods G, Godinho SA. Centrosomes and cilia in human disease. Trends Genet. 2011;27(8):307–315. - PMC - PubMed
    1. Nigg EA, Raff JW. Centrioles, centrosomes, and cilia in health and disease. Cell. 2009;139(4):663–678. - PubMed

Publication types

MeSH terms

Substances