. 2015 Nov 17;112(46):E6321-30.
doi: 10.1073/pnas.1519388112. Epub 2015 Nov 2.

Chronic centrosome amplification without tumorigenesis

Affiliations

Chronic centrosome amplification without tumorigenesis

Benjamin Vitre et al. Proc Natl Acad Sci U S A. .

Abstract

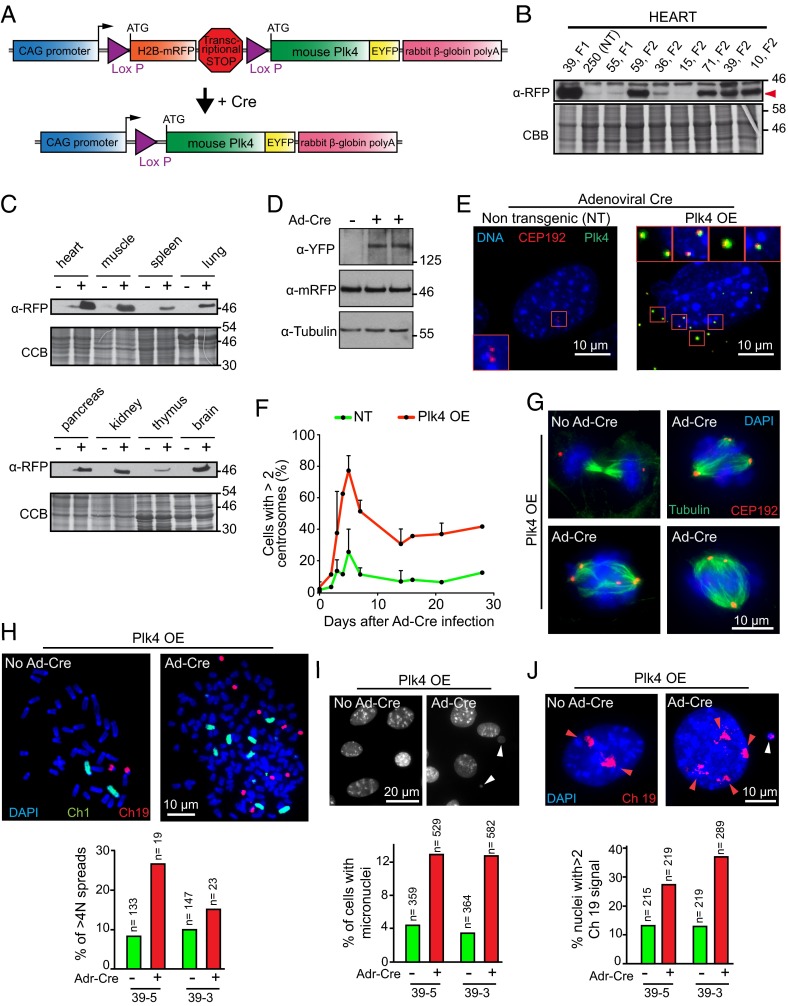
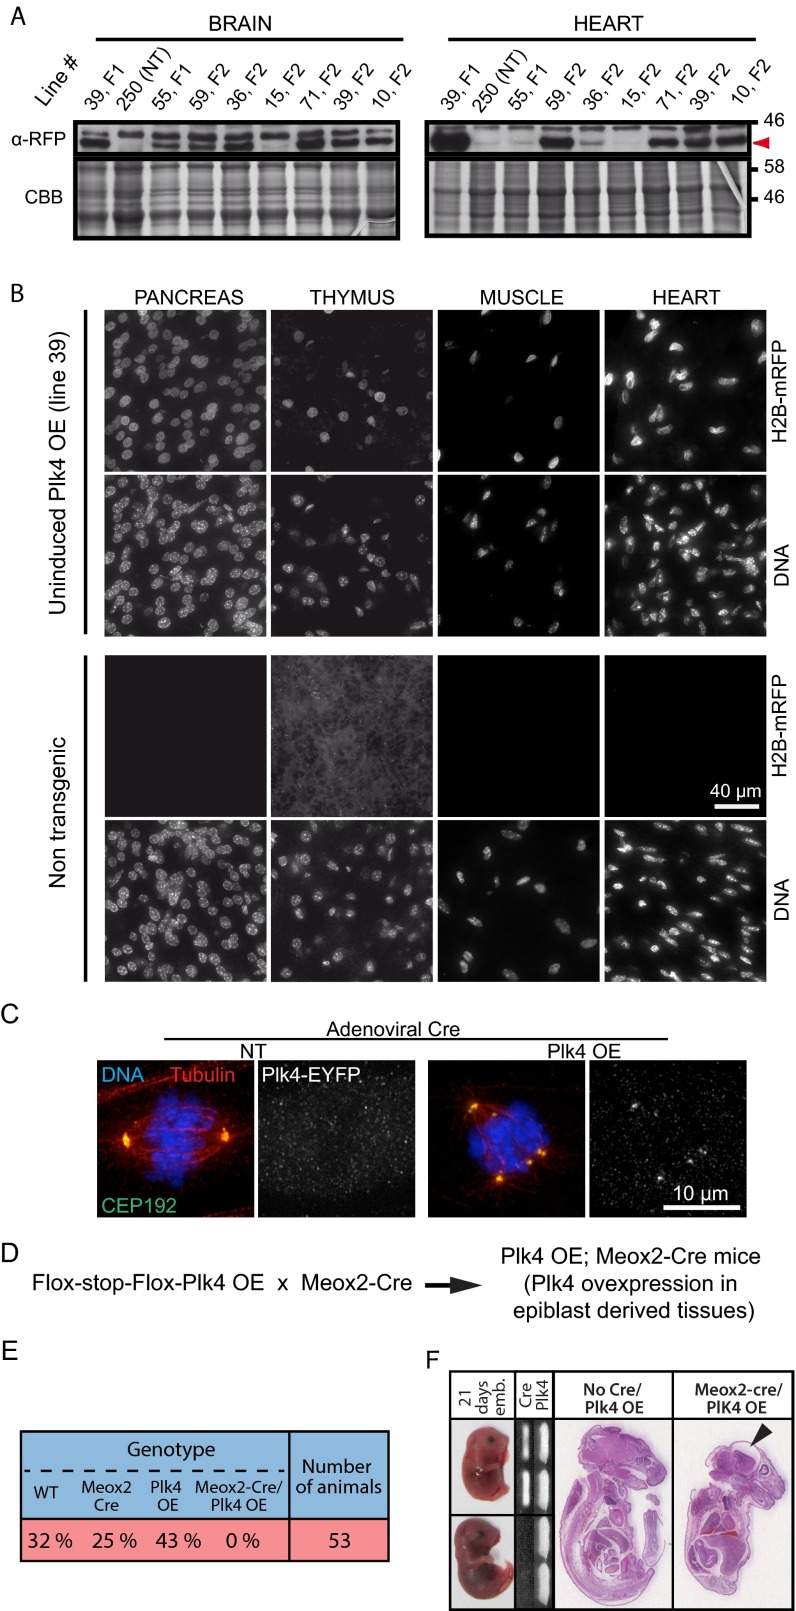
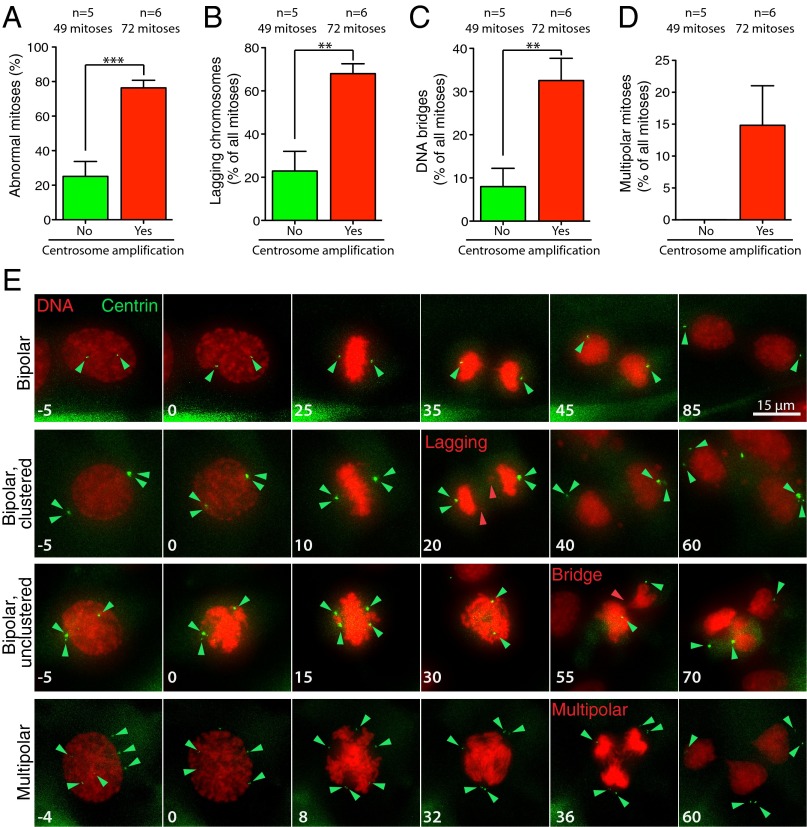
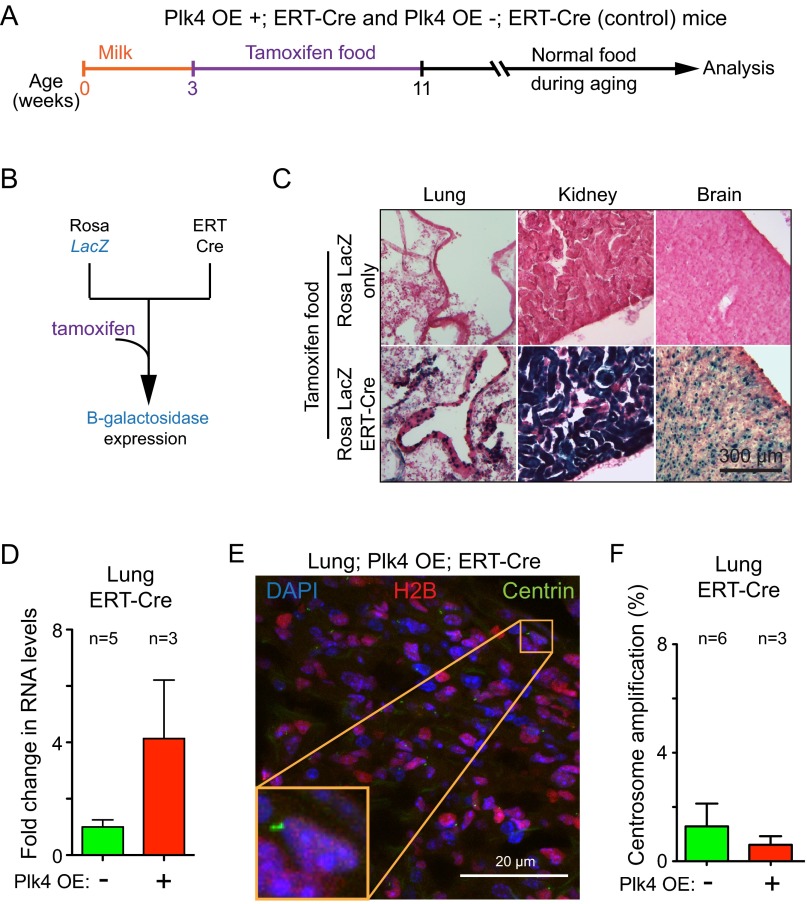
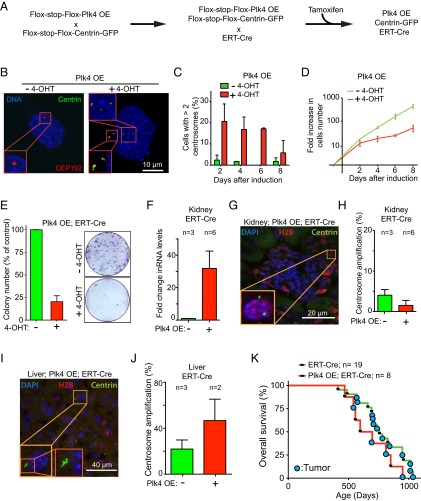
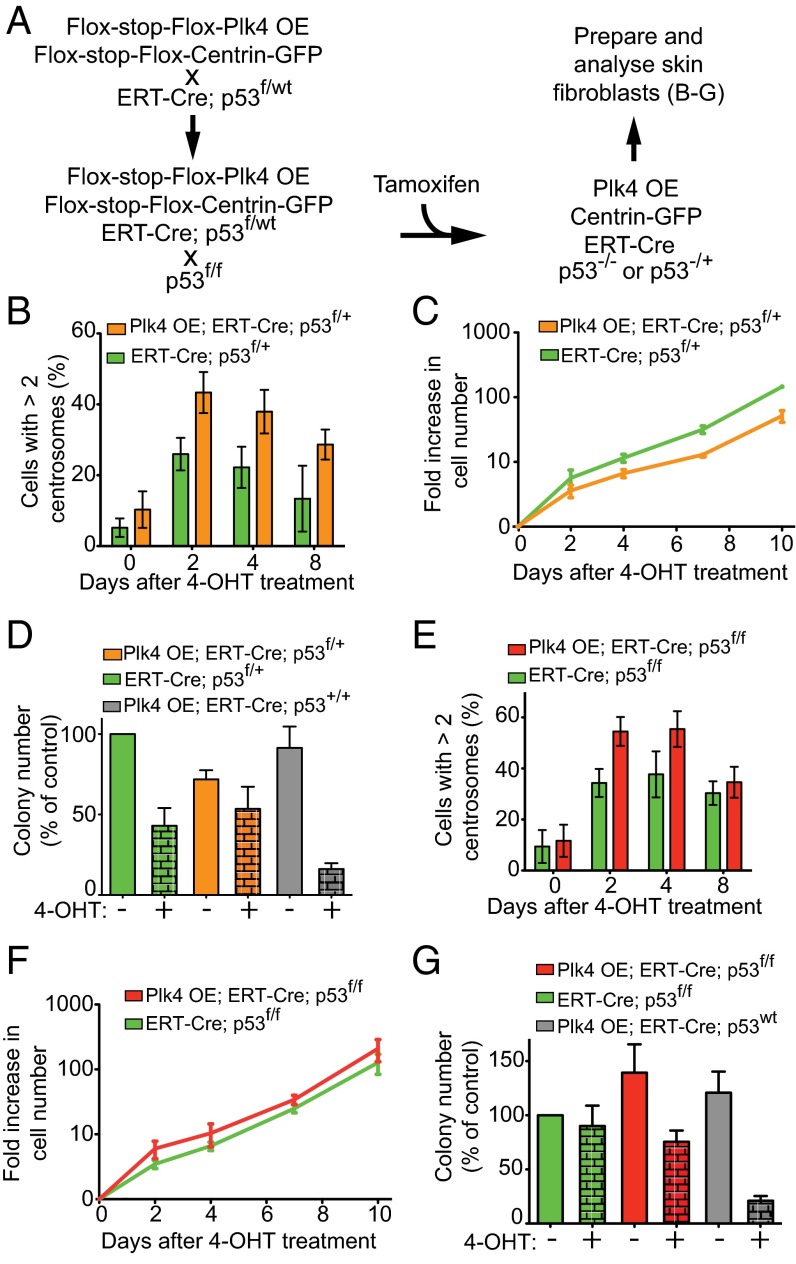
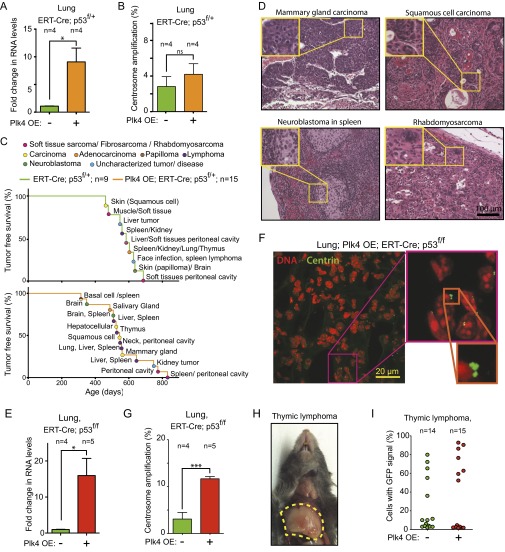
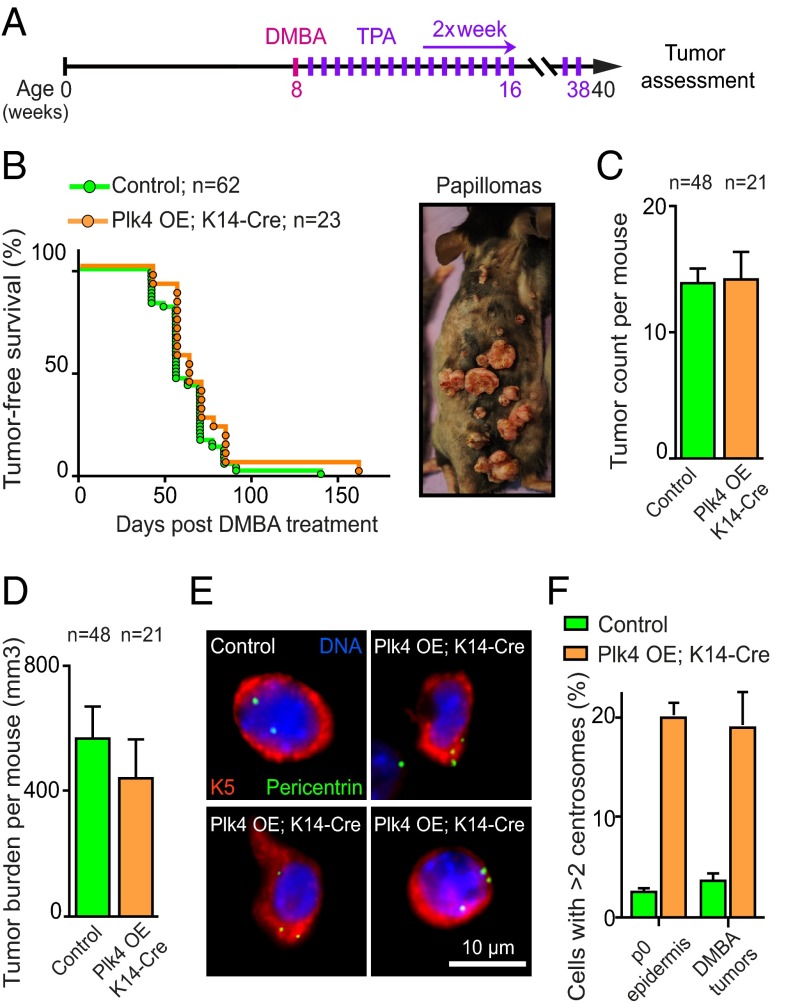
Centrosomes are microtubule-organizing centers that facilitate bipolar mitotic spindle assembly and chromosome segregation. Recognizing that centrosome amplification is a common feature of aneuploid cancer cells, we tested whether supernumerary centrosomes are sufficient to drive tumor development. To do this, we constructed and analyzed mice in which centrosome amplification can be induced by a Cre-recombinase-mediated increase in expression of Polo-like kinase 4 (Plk4). Elevated Plk4 in mouse fibroblasts produced supernumerary centrosomes and enhanced the expected mitotic errors, but proliferation continued only after inactivation of the p53 tumor suppressor. Increasing Plk4 levels in mice with functional p53 produced centrosome amplification in liver and skin, but this did not promote spontaneous tumor development in these tissues or enhance the growth of chemically induced skin tumors. In the absence of p53, Plk4 overexpression generated widespread centrosome amplification, but did not drive additional tumors or affect development of the fatal thymic lymphomas that arise in animals lacking p53. We conclude that, independent of p53 status, supernumerary centrosomes are not sufficient to drive tumor formation.

Keywords: Plk4 kinase; centrosome amplification; p53; tumorigenesis.


Conflict of interest statement

The authors declare no conflict of interest.

Figures

Fig. 1.
Fig. 1.
Generation of a mouse model for Cre-inducible Plk4 expression. (A) Schematic of the gene construct used to generate inducible Plk4 OE transgenic mice. A chicken β-actin (CAG) promoter initially directs production of H2B-mRFP. Action of Cre at the two Lox P sites will excise the H2B-mRFP gene and the transcriptional stop cassette, thereby activating Plk4-EYFP expression. (B) Immunoblot of H2B-mRFP in heart tissue lysates from various Plk4 OE mouse founder lines. Numbers indicate the founder line. NT, nontransgenic. The red arrowhead indicates the mRFP signal. (C) Immunoblots to determine the expression of H2B-mRFP in various tissues from the transgenic mouse line 39. (−), control (nontransgenic) mice; (+), Plk4 OE mice. (D) Immunoblot of lysates from MEFs showing the accumulation of the Plk4-EYFP protein. (E) Immunofluorescence images of MEFs at 2 d after transduction with Ad-Cre. Plk4-EYFP (green) is visualized only after Cre expression. Accumulation of supernumerary centrosomes was tracked using CEP192 (red). (Scale bar: 10 μm.) (F) Quantification of centrosome amplification (>2 centrosomes per cell) in MEFs at various times after transduction with Ad-Cre. Points represent the mean of two independent experiments. Error bars indicate SD. (G) Immunofluorescence images showing mitotic figures in Plk4 OE MEFs at 5 d after Ad-Cre transduction or without treatment. (Scale bar: 10 μm.) (H) Representative immunofluorescence image of a chromosome spread of an MEF derived from a Plk4 OE mouse at 5 d after treatment with Ad-Cre. Chromosomes 1 and 19 are shown in green and red, respectively. Forty chromosomes are visible in the “no Ad-Cre” condition, and 167 chromosomes are visible in the “Ad-Cre” condition. The graph represents the proportion of cell spreads with >4N DNA content. The quantification was made in two independent populations of MEFs (39-3, 39-5). (I) Representative immunofluorescence image of MEFs derived from a Plk4 OE animal at 5 d after treatment with Ad-Cre. White arrowheads indicate micronuclei. The graph represents the proportion of cells with micronuclei. The quantification was made in two independent populations of MEFs (39-3, 39-5). (J) Representative immunofluorescence image of MEFs, derived from a Plk4 OE animal, at 5 d after treatment with Ad-Cre. The cells were treated with a chromosome painting probe to visualize chromosome 19 (red). Red arrowheads point to chromosome 19 signals. The white arrowhead indicates a chromosome 19 signal in a micronucleus. The graph represents the proportion of cells presenting more than two signals for chromosome 19. The quantification was made in two independent populations of MEFs (39-3, 39-5).
Fig. S1.
Fig. S1.
Chronic Plk4 overexpression beginning early in embryogenesis is lethal. (A) Immunoblots of brain and heart tissue lysates obtained from different inducible Plk4 mouse lines. Numbers indicate the founder line. Note that the Right panel presenting heart tissue lysates also appears in Fig. 1B. NT, nontransgenic. Red arrowhead indicates the mRFP signal. (B) Immunofluorescence images of tissues from nontransgenic control or the Plk4 OE mouse line (line 39). H2B-mRFP–positive nuclei are present in all tissues anlayzed. (Scale bar: 40 μm.) (C) Immunofluorescence images showing mitotic spindles in nontransgenic and Plk4 OE MEFs at 2 d after Ad-Cre transduction. (Scale bar: 10 μm.) (D) Outline of the breeding scheme used to obtain Meox2-Cre;Plk4 OE animals. (E) The Plk4 transgenic line 39 was crossed to mice expressing Cre under the control of the Meox2 promoter. The table shows the proportion of animals obtained with the indicated genotypes. No Meox2-Cre;Plk4 OE animals were obtained, indicating that early and ubiquitous Plk4 overexpression leads to embryonic lethality. (F) Meox2-Cre;Plk4 OE embryos where collected at 21 d postfertilization. (Left) Images documenting delayed development in Meox2-Cre;Plk4 OE embryos. (Middle) PCR genotyping of the embryos. (Right) H&E staining of sections of control (no Meox2-Cre; Plk4 OE) and Meox2-Cre;Plk4 OE embryos. The black arrowhead points to microcephaly in the Meox2-Cre;Plk4 OE embryo.
Fig. 2.
Fig. 2.
Supernumerary centrosomes promote chromosome mis-segregation in fibroblasts. (A) Quantification of chromosome segregation errors in the Centrin 1-GFP–positive cell population at 48 h after 4-OHT treatment in ERT-Cre;Centrin-GFP and ERT-Cre;Centrin-GFP;Plk4 OE skin fibroblasts with p53f/+, p53f/f, or p53+/+ alleles. Bars represent the mean. Error bars indicate SEM. (B) Quantification of lagging chromosomes during anaphase in cells as described in A. Bars represent the mean of at least five independent experiments. Error bars indicate SEM. ***P < 0.005; P value of unpaired t test calculated on the mean values from five and six independent measurements. (C) Quantification of DNA bridges during anaphase in cells as described in A. Bars represent the mean of at least five independent experiments. Error bars indicate SEM. **P < 0.01; P value of unpaired t test calculated on the mean values from five and six independent measurements. (D) Quantification of multipolar mitoses in cells as described in A. Bars represent the mean of at least five independent experiments. Error bars indicate SEM. **P < 0.01; P value of unpaired t test calculated on the mean values from five and six independent measurements. (E) Representative image from time-lapse filming of skin fibroblasts undergoing mitosis with or without extra centrosomes. Green arrowheads point to centrosomes. Red arrowheads point to chromosome segregation defects. Numbers indicate time in minutes.
Fig. S2.
Fig. S2.
Centrosome amplification is not tolerated in vivo in the lung. (A) Protocol for activation of expression of Plk4-EYFP in Plk4-OE;ERT-Cre mice. Mice were fed tamoxifen for a 2-mo period beginning at weaning age. (B) Breeding scheme to generate a mouse line containing a tamoxifen-inducible Cre (ERT-Cre) together with a Cre-inducible β-galactosidase transgene. (C) Images show X-gal staining, and thus β-galactosidase activity, in a variety of tissues from a ERT-Cre;Lac Z mouse treated as in A. Control indicates mice containing only the Cre-activatable Lac Z gene without ERT-Cre transgene. (D) Fold change in Plk4 mRNA in the lungs of Plk4 OE;ERT-Cre;Centrin-GFP mice compared with control ERT-Cre;Centrin-GFP mice. Measurements were taken at 2 mo after tamoxifen treatment. Fold change is relative to nontransgenic control animals (−). Bars represent the mean, and error bars indicate SEM. n = 3 Plk4 OE (+) mice and n = 5 nontransgenic controls (−). (E) Representative immunofluorescence image of a lung section from a mouse overexpressing Plk4 after tamoxifen treatment. (F) Percentage of centrosome amplification within cells expressing Centrin 1-GFP in control lungs vs. Plk4 OE lungs. Bars represent the mean, and error bars indicate SEM. n = 3 Plk4 OE (+) mice and n = 6 nontransgenic controls (−). A minimum of 107 centrin-positive cells were counted for each data point.
Fig. 3.
Fig. 3.
Centrosome amplification is not tolerated in vitro and in most tissues in vivo. (A) Breeding scheme to obtain mice containing the tamoxifen-inducible Cre (ERT-Cre), the Cre-inducible Plk4 transgene, and the Cre-inducible Centrin-GFP centrosomal marker. (B) Representative immunofluorescence image of a skin fibroblast derived from a Plk4 OE;ERT-Cre;Centrin-GFP animal treated for 48 h with or without 4-OHT. (C) Centrosome quantification in cells as described in B. Bars represent the mean of two independent experiments. Error bars indicate SEM. A minimum of 60 cells were analyzed for each condition. (D) Change in cell numbers over time in Plk4 OE skin fibroblasts in which Plk4 expression was induced (+ tamoxifen) or not (− tamoxifen). Lines represent the mean of two experiments. Error bars indicate SEM. (E) Clonogenic analysis of Plk4 OE; ERT-Cre;Centrin-GFP skin fibroblasts treated with (+) or without (−) 4-OHT. The graph shows the percentage of clones that grew in Plk4-overexpressing (+ tamoxifen) cells compared with uninduced controls (− tamoxifen). Bars represent the mean of two experiments. Error bars indicate SEM. Two plates were analyzed for each data point. (F) Fold change in Plk4 mRNA in the kidney of Plk4 OE; ERT-Cre;Centrin-GFP mice compared with control ERT-Cre;Centrin-GFP mice. Measurements were taken at 2 mo after tamoxifen treatment. Bars represent the mean and error bars indicate SEM. n = 3 mice with Plk4 OE (+) and n = 6 nontransgenic control mice (−). (G) Representative immunofluorescence image of a kidney section (a glomerulus is visible in the middle of the image) from Plk4 OE mice after tamoxifen treatment. (H) Percentage of centrosome amplification in cells expressing Centrin 1-GFP in the kidney of tamoxifen-treated Plk4-overexpressing mice (+) and nontransgenic control mice (−). Bars represent the mean, and error bars indicate SEM. n = 3 mice with Plk4 OE (+) and n = 6 nontransgenic animals (−). A minimum of 86 centrin-positive cells were counted for each animal. (I) Representative immunofluorescence image of a liver section from a Plk4 OE mouse after tamoxifen treatment. (J) Percentage of centrosome amplification within cells expressing Centrin 1-GFP in control livers vs. Plk4 OE livers. Measurements were obtained at 2 mo after tamoxifen treatment. Bars represent the mean, and error bars indicate SEM. n = 2 mice with Plk4 OE (+) and n = 3 nontransgenic mice (−). A minimum of 25 centrin-positive cells were counted for each animal. (K) Survival analysis of mouse cohorts treated with tamoxifen citrate food (as in Fig. S2A). Animals developing overt tumors are marked with a blue circle.
Fig. 4.
Fig. 4.
p53 reduction or inactivation allows Plk4-induced centrosome amplification in cell culture. (A) Breeding scheme to obtain mice with a Cre-inducible Plk4 transgene, tamoxifen-inducible Cre (ERT-Cre), a Cre-inducible Centrin-GFP allele, and one or two Cre-inactivable p53 alleles. (B) Quantification of centrosome amplification within the Centrin-GFP–positive cell population after 4-OHT treatment. Measurements were done at various times after 4-OHT treatment in Plk4 OE; ERT-Cre;Centrin-GFP;p53f/+ skin fibroblasts and ERT-Cre;Centrin-GFP;p53f/+ control fibroblasts. Bars represent the mean of a minimum of three independent experiments (except for day 8 without the Plk4 OE where two independent experiments were quantified). Error bars indicate SEM. A minimum of 47 cells were analyzed for each data point. (C) Quantification of the change in cell number over time after 4-OHT treatment of Plk4 OE; ERT-Cre;Centrin-GFP;p53f/+ skin fibroblasts and ERT-Cre;Centrin-GFP;p53f/+ control fibroblasts. Lines represent the mean of two experiments. Error bars indicate SEM. (D) Clonogenic survival of Plk4 OE;ERT-Cre;Centrin-GFP;p53f/+ skin fibroblasts and ERT-Cre;Centrin-GFP;p53f/+ control fibroblasts treated with 4-OHT. Bars represent the mean of a minimum of three independent experiments. Error bars indicate SEM. Two plates were analyzed for each data point. (E) Quantification of centrosome amplification within the Centrin-GFP–positive cell population after 4-OHT treatment. Measurements were made at various times after tamoxifen treatment in Plk4 OE; ERT-Cre;Centrin-GFP;p53f/f skin fibroblasts and ERT-Cre;Centrin-GFP;p53f/f control fibroblasts. Bars represent the mean of at least three independent experiments. Error bars indicate SEM. A minimum of 48 cells were analyzed for each data point. (F) Quantification of change in cell numbers over time after 4-OHT treatment of Plk4 OE;ERT-Cre;Centrin-GFP;p53f/f skin fibroblasts and ERT-Cre;Centrin-GFP;p53f/f control fibroblasts. Lines represent the mean of two independent experiments. Error bars indicate SEM. (G) Clonogenic capabilities of Plk4 OE; ERT-Cre;Centrin-GFP;p53f/f skin fibroblasts and ERT-Cre;Centrin-GFP;p53f/f control fibroblasts treated with 4-OHT. Bars represent the mean of a minimum of three independent experiments. Error bars indicate SEM. Two plates were analyzed for each data point.
Fig. 5.
Fig. 5.
Plk4-driven centrosome amplification does not affect the development of tumors resulting from p53 loss. (A) Fold change in Plk4 mRNA in the kidney of Plk4 OE; ERT-Cre;Centrin-GFP;p53f/+ mice compared with control ERT-Cre;Centrin-GFP;p53f/+ mice. Measurements were taken at 2 mo after tamoxifen treatment. Bars represent the mean, and error bars indicate SEM. n = 4 animals for each group. *P < 0.05; P value of unpaired t test calculated on the mean values from four independent measurements. (B) Percentage of centrosome amplification within cells expressing Centrin-GFP in the kidney of Plk4 OE; ERT-Cre;Centrin-GFP;p53f/+ mice and in control ERT-Cre;Centrin-GFP;p53f/+ mice. Measurements were taken at 2 mo after tamoxifen treatment. Bars represent the mean, and error bars indicate SEM. n = 6 mice with Plk4 OE activation and n = 6 without Plk4 OE activation. ns, P > 0.05; P value of unpaired t test calculated on the mean values from six independent measurements. A minimum of 177 centrin-positive cells were counted for each animal. (C) Tumor-free survival of Plk4 OE; ERT-Cre;Centrin-GFP;p53f/+ mice and control ERT-Cre;Centrin-GFP;p53f/+ mice after 2 mo of tamoxifen treatment. n = 15 mice with tamoxifen treatment and n = 9 without tamoxifen treatment. (D) Fold change in Plk4 mRNA in kidneys of Plk4 OE; ERT-Cre;Centrin-GFP;p53f/f mice compared with control ERT-Cre;Centrin-GFP;p53f/f mice. Measurements were taken at 2 mo after tamoxifen treatment. Bars represent the mean, and error bars indicate SEM. n = 6 mice for tamoxifen-induced and n = 4 for uninduced. *P < 0.05; P value of unpaired t test calculated on the mean values from four and six independent measurements. (E) Representative immunofluorescence image of a kidney section (a glomerulus is visible in the middle of the image) from a Plk4 OE; ERT-Cre;Centrin-GFP;p53f/f mouse after tamoxifen treatment. (F) Percentage of centrosome amplification within cells expressing Centrin-GFP in the kidney of Plk4 OE; ERT-Cre;Centrin-GFP;p53f/f mice and in control ERT-Cre;Centrin-GFP;p53f/f mice. Measurements were taken two months after tamoxifen treatment. Bars represent the mean, and error bars indicate SEM. n = 6 mice with Plk4 OE and n = 4 controls. *P < 0.05; P value of unpaired t test calculated on the mean values from four and six independent measurements. A minimum of 172 centrin-positive cells were counted for each animal. (G) Tumor-free survival of Plk4 OE; ERT-Cre;Centrin-GFP;p53f/f mice and control ERT-Cre;Centrin-GFP;p53f/f mice after 2 mo of tamoxifen treatment. n = 25 mice with Plk4 OE and n = 27 controls. (H) (Left) Representative immunofluorescence image of a thymic lymphoma section. (Right) Quantitation of centrosome amplification in individual tumors scored within cells containing a Centrin-GFP signal. Tumors from 15 mice with the Plk4 OE gene and 14 mice without the Plk4 OE gene were analyzed. A minimum of 40 centrin-positive cells were analyzed for each tumor. Bars represent the mean, and errors bars indicate mean and SEM. (I) Mitotic figures in H&E staining of thymic lymphoma sections from Plk4 OE;ERT-Cre;p53f/f mice after tamoxifen induction of Cre to activate the Plk4 OE gene and inactivate p53. Red arrowheads point to segregation errors. The graph shows the proportion of abnormal anaphases (lagging chromosomes, chromosome bridges, and multipolar anaphases). Bars show the mean and error bars show the SEM from measurements from six individual tumors for each condition. ***P < 0.001; P value of an unpaired t test calculated on the mean values of measurements from six independent tumors. A total of 107 anaphases were analyzed for the control condition, and 121 anaphases were analyzed for the Plk4 OE condition.
Fig. S3.
Fig. S3.
Plk4 overexpression does not affect the type of tumor arising from heterozygous loss of p53. (A) Fold change in Plk4 mRNA in the lungs of Plk4 OE; ERT-Cre;Centrin-GFP;p53f/+ mice compared with control ERT-Cre;Centrin-GFP;p53f/+ mice. Measurements were taken at 2 mo after tamoxifen treatment. Bars represent the mean, and error bars indicate SEM. n = 4 mice with Plk4 OE and n = 4 mice without Plk4 OE. *P < 0.05; P value of unpaired t test calculated on the mean values from four independent measurements. (B) Percentage of centrosome amplification within cells expressing Centrin 1-GFP in the lung of Plk4 OE;ERT-Cre;Centrin-GFP;p53f/+ mice and control ERT-Cre;Centrin-GFP;p53f/+ mice. Measurements were taken at 2 mo after tamoxifen treatment. Bars represent the mean, and error bars indicate SEM. n = 6 mice with Plk4 OE and n = 4 mice without Plk4 OE. A minimum of 116 centrin-positive cells were counted for each data point. ns, P value > 0.05; P value of unpaired t test calculated on the mean values from four independent measurements. (C) Tumor-free survival and tumor spectrum of Plk4 OE;ERT-Cre;Centrin-GFP;p53f/+ mice and control ERT-Cre;Centrin-GFP;p53f/+ mice after 2 mo of feeding with food containing tamoxifen. At each event, the location and tumor type are described using a color code. (D) H&E-stained sections of tumors developed in Plk4 OE;ERT-Cre;Centrin-GFP;p53f/+ mice (mammary gland carcinoma, squamous cell carcinoma, and neuroblastoma within spleen) and in ERT-Cre;Centrin1-GFP;p53f/+ control mice (rhabdomyosarcoma). (E) Fold change in Plk4 mRNA in the lungs of Plk4 OE;ERT-Cre;Centrin-GFP;p53f/f mice compared with control ERT-Cre;Centrin-GFP;p53f/f mice. Measurements were taken at 2 mo after tamoxifen treatment. Bars represent the mean, and error bars indicate SEM. n = 5 mice with Plk4 OE and n = 4 mice without Plk4 OE. *P < 0.05; P value of unpaired t test calculated on the mean values from four and five independent measurements. (F) Representative immunofluorescence image of a lung section from a Plk4 OE;ERT-Cre;Centrin-GFP;p53f/f mouse after tamoxifen treatment. (G) Percentage of centrosome amplification within cells expressing Centrin 1-GFP in lungs of Plk4 OE;ERT-Cre;Centrin1-GFP;p53f/f mice and in control ERT-Cre;Centrin1-GFP;p53f/f mice. Measurements were taken at 2 mo after tamoxifen treatment. Bars represent the mean, and error bars indicate SEM. n = 5 mice with Plk4 OE and n = 4 mice without Plk4 OE. ***P < 0.001; P value of unpaired t test calculated on the mean values from four and five independent measurements. A minimum of 101 centrin-positive cells were counted for each animal. (H) Image of a thymic lymphoma developed in a Plk4 OE;ERT-Cre;Centrin-GFP;p53f/f mouse fed with tamoxifen. The dotted line highlights the tumor. (I) Percentage of Centrin 1-GFP–positive cells in individual thymic lymphomas. Tumors were from 15 ERT-Cre;Centrin-GFP;p53f/f animals and 14 Plk4 OE;ERT-Cre;Centrin1-GFP;p53f/f animals. A minimum of 40 centrin-positive cells were analyzed for each tumor.
Fig. 6.
Fig. 6.
Centrosome amplification does not enhance DMBA/TPA-induced tumorigenesis. (A) Schematic showing the DMBA and TPA treatment course. (B) Tumor-free survival curves of Plk4 OE;K14-Cre and control (Plk4 OE, K14-Cre and WT) mice treated with DMBA/TPA. (Inset) A Plk4 OE;K14-Cre mouse with lesions at various stages of tumor progression. A total of 62 control animals (22 Plk4 OE, 20 K14-Cre, and 20 WT) and 23 Plk4 OE;K14-Cre animals were monitored. (C and D) Quantification of tumor number (C) and total tumor volume (D) per mouse assessed after 32 wk of DMBA/TPA treatment. Bars show the mean, and error bars indicate the SEM from 48 control animals and 21 Plk4 OE; K14-Cre animals. (E) Representative image of cells isolated from DMBA/TPA-induced tumors from control or Plk4 OE;K14-Cre mice. (F) Quantification of centrosome number in cells isolated from P0 epidermis and DMBA/TPA-induced tumors. Bars show the mean and error bars represents the SEM from at least four individual animals and tumors for each condition.

References

    1. Boveri T. Zellen-Studien: Über die Natur der Centrosomen. Gustav Fischer; Jena, Germany: 1900.
    1. Strnad P, Gönczy P. Mechanisms of procentriole formation. Trends Cell Biol. 2008;18(8):389–396. - PubMed
    1. Nigg EA, Raff JW. Centrioles, centrosomes, and cilia in health and disease. Cell. 2009;139(4):663–678. - PubMed
    1. Holland AJ, Cleveland DW. Boveri revisited: Chromosomal instability, aneuploidy and tumorigenesis. Nat Rev Mol Cell Biol. 2009;10(7):478–487. - PMC - PubMed
    1. Vitre BD, Cleveland DW. Centrosomes, chromosome instability (CIN), and aneuploidy. Curr Opin Cell Biol. 2012;24(6):809–815. - PMC - PubMed

Publication types

MeSH terms

Substances