

Diagnostic ultrasound estimates of muscle mass and muscle quality discriminate between women with and without sarcopenia
- PMID: 26578974
- PMCID: PMC4625057
- DOI: 10.3389/fphys.2015.00302
Diagnostic ultrasound estimates of muscle mass and muscle quality discriminate between women with and without sarcopenia
Abstract
Introduction: Age-related changes in muscle mass and muscle tissue composition contribute to diminished strength in older adults. The objectives of this study are to examine if an assessment method using mobile diagnostic ultrasound augments well-known determinants of lean body mass (LBM) to aid sarcopenia staging, and if a sonographic measure of muscle quality is associated with muscle performance.
Methods: Twenty community-dwelling female subjects participated in the study (age = 43.4 ± 20.9 years; BMI: 23.8, interquartile range: 8.5). Dual energy X-ray absorptiometry (DXA) and diagnostic ultrasound morphometry were used to estimate LBM. Muscle tissue quality was estimated via the echogenicity using grayscale histogram analysis. Peak force was measured with grip dynamometry and scaled for body size. Bivariate and multiple regression analyses were used to determine the association of the predictor variables with appendicular lean mass (aLM/ht(2)), and examine the relationship between scaled peak force values and muscle echogenicity. The sarcopenia LBM cut point value of 6.75 kg/m(2) determined participant assignment into the Normal LBM and Low LBM subgroups.
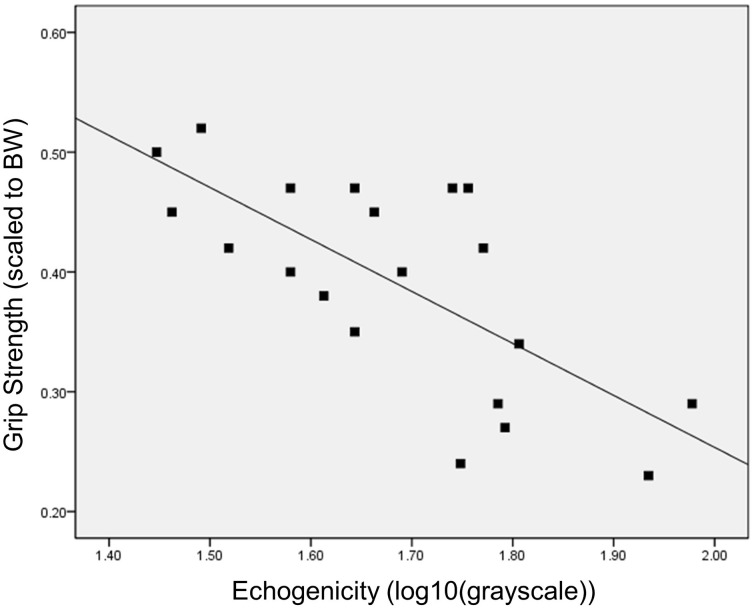
Results: The selected LBM predictor variables were body mass index (BMI), ultrasound morphometry, and age. Although BMI exhibited a significant positive relationship with aLM/ht(2) (adj. R (2) = 0.61, p < 0.001), the strength of association improved with the addition of ultrasound morphometry and age as predictor variables (adj. R (2) = 0.85, p < 0.001). Scaled peak force was associated with age and echogenicity (adj. R (2) = 0.53, p < 0.001), but not LBM. The Low LBM subgroup of women (n = 10) had higher scaled peak force, lower BMI, and lower echogenicity values in comparison to the Normal LBM subgroup (n = 10; p < 0.05).
Conclusions: Diagnostic ultrasound morphometry values are associated with LBM, and improve the BMI predictive model for aLM/ht(2) in women. In addition, ultrasound proxy measures of muscle quality are more strongly associated with strength than muscle mass within the study sample.
Keywords: body composition; diagnostic ultrasound; dual-energy X-ray absorptiometry; geriatric assessment; muscle performance; muscle strength; myosteatosis; sarcopenia.
Figures

Similar articles
-
Combination of DXA and BIS body composition measurements is highly correlated with physical function-an approach to improve muscle mass assessment.Arch Osteoporos. 2018 Sep 14;13(1):97. doi: 10.1007/s11657-018-0508-7. Arch Osteoporos. 2018. PMID: 30218261
-
Could bioelectric impedance spectroscopy (BIS) measured appendicular intracellular water serve as a lean mass measurement in sarcopenia definitions? A pilot study.Osteoporos Int. 2018 Jul;29(7):1653-1657. doi: 10.1007/s00198-018-4475-z. Epub 2018 Mar 25. Osteoporos Int. 2018. PMID: 29574521
-
Muscle mass, muscle strength, and functional capacity in patients with heart failure of Chagas disease and other aetiologies.ESC Heart Fail. 2020 Oct;7(5):3086-3094. doi: 10.1002/ehf2.12936. Epub 2020 Aug 28. ESC Heart Fail. 2020. PMID: 32860353 Free PMC article.
-
Assessment of Lean Mass and Physical Performance in Sarcopenia.J Clin Densitom. 2015 Oct-Dec;18(4):467-71. doi: 10.1016/j.jocd.2015.05.063. Epub 2015 Jun 10. J Clin Densitom. 2015. PMID: 26071168 Review.
-
D3 -Creatine dilution and the importance of accuracy in the assessment of skeletal muscle mass.J Cachexia Sarcopenia Muscle. 2019 Feb;10(1):14-21. doi: 10.1002/jcsm.12390. Epub 2019 Mar 21. J Cachexia Sarcopenia Muscle. 2019. PMID: 30900400 Free PMC article. Review.
Cited by
-
Effects of virtual dance exercise on skeletal muscle architecture and function of community dwelling older women.J Musculoskelet Neuronal Interact. 2019 Mar 1;19(1):50-61. J Musculoskelet Neuronal Interact. 2019. PMID: 30839303 Free PMC article. Clinical Trial.
-
The Need for Standardized Assessment of Muscle Quality in Skeletal Muscle Function Deficit and Other Aging-Related Muscle Dysfunctions: A Symposium Report.Front Physiol. 2017 Feb 15;8:87. doi: 10.3389/fphys.2017.00087. eCollection 2017. Front Physiol. 2017. PMID: 28261109 Free PMC article. Review.
-
Acute Sarcopenia: Mechanisms and Management.Nutrients. 2024 Oct 10;16(20):3428. doi: 10.3390/nu16203428. Nutrients. 2024. PMID: 39458423 Free PMC article. Review.
-
Ultrasound measures of muscle morphology in people with multiple sclerosis are associated with muscle performance and functional mobility.Mult Scler Relat Disord. 2023 Jul;75:104759. doi: 10.1016/j.msard.2023.104759. Epub 2023 May 10. Mult Scler Relat Disord. 2023. PMID: 37192587 Free PMC article.
-
Myosteatosis for Early Detection of Muscle Disorder in Patients With Liver Cirrhosis.J Clin Exp Hepatol. 2024 Mar-Apr;14(2):101312. doi: 10.1016/j.jceh.2023.101312. Epub 2023 Dec 4. J Clin Exp Hepatol. 2024. PMID: 38274507 Free PMC article.
References
-
- Alexandre Tda S., Duarte Y. A. D. O., Santos J. L. F., Wong R., Lebrão M. L. (2014). Sarcopenia according to the European Working Group on Sarcopenia in Older People (EWGSOP) versus dynapenia as a risk factor for mortality in the elderly. J. Nutr. Health Aging 18, 751–756. 10.1007/s12603-014-0540-2 - DOI - PubMed
Grants and funding
LinkOut - more resources
Full Text Sources
Other Literature Sources