. 2015 Oct 30:6:308.
doi: 10.3389/fphys.2015.00308. eCollection 2015.

Gas analyzer's drift leads to systematic error in maximal oxygen uptake and maximal respiratory exchange ratio determination

Affiliations

Gas analyzer's drift leads to systematic error in maximal oxygen uptake and maximal respiratory exchange ratio determination

Ibai Garcia-Tabar et al. Front Physiol. .

Abstract

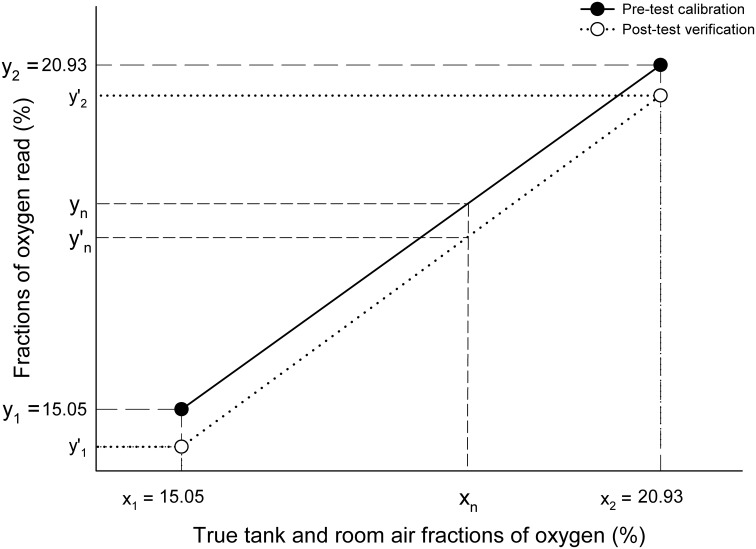
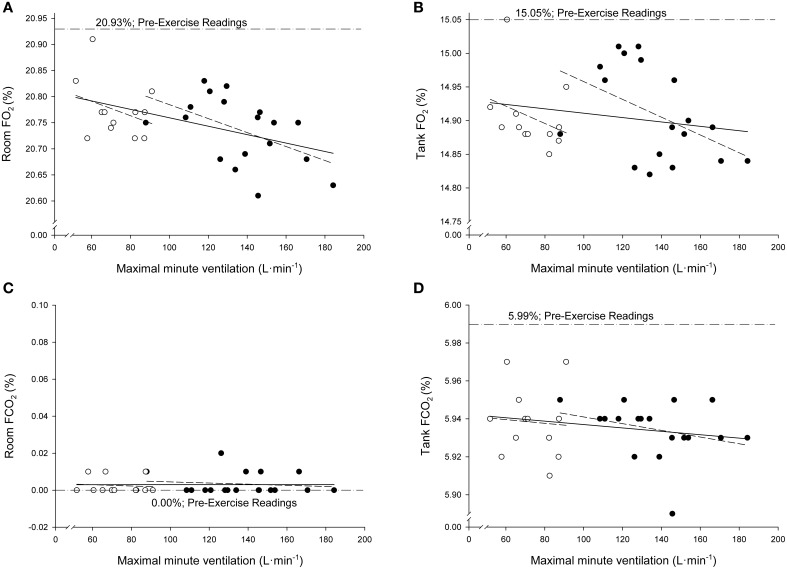
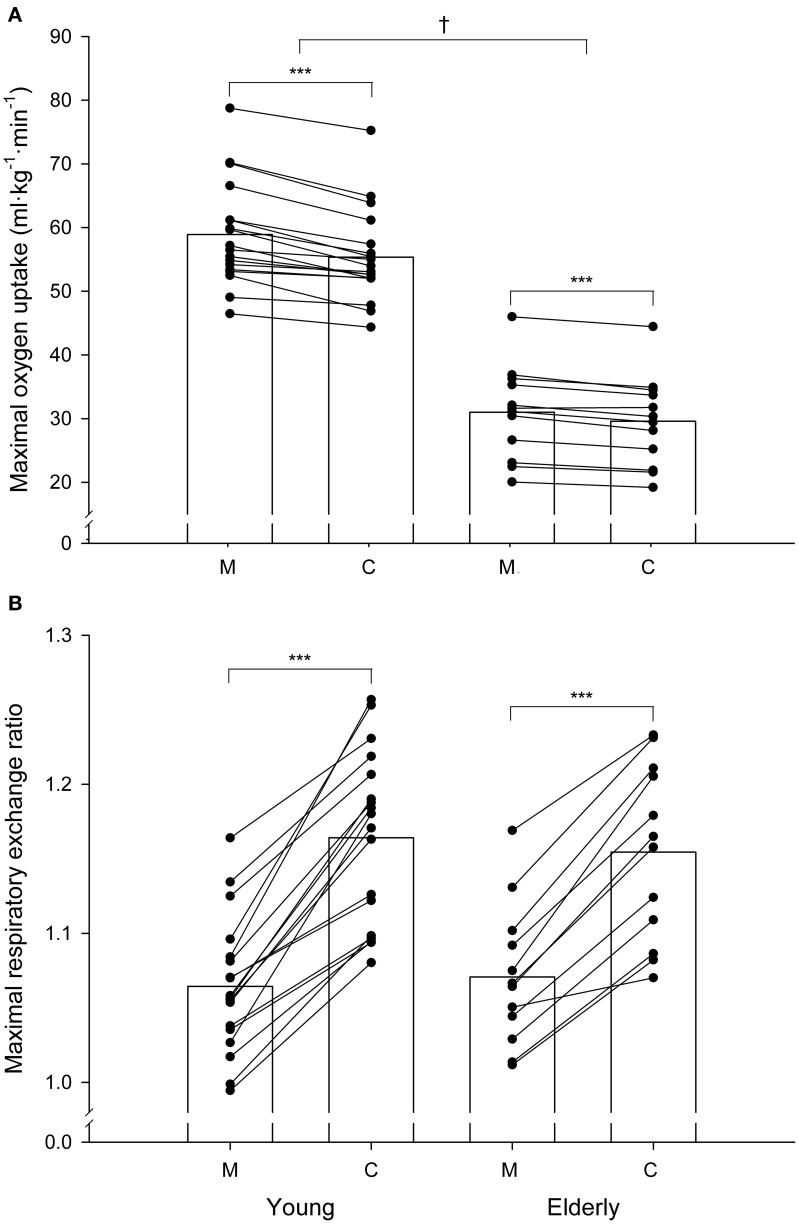
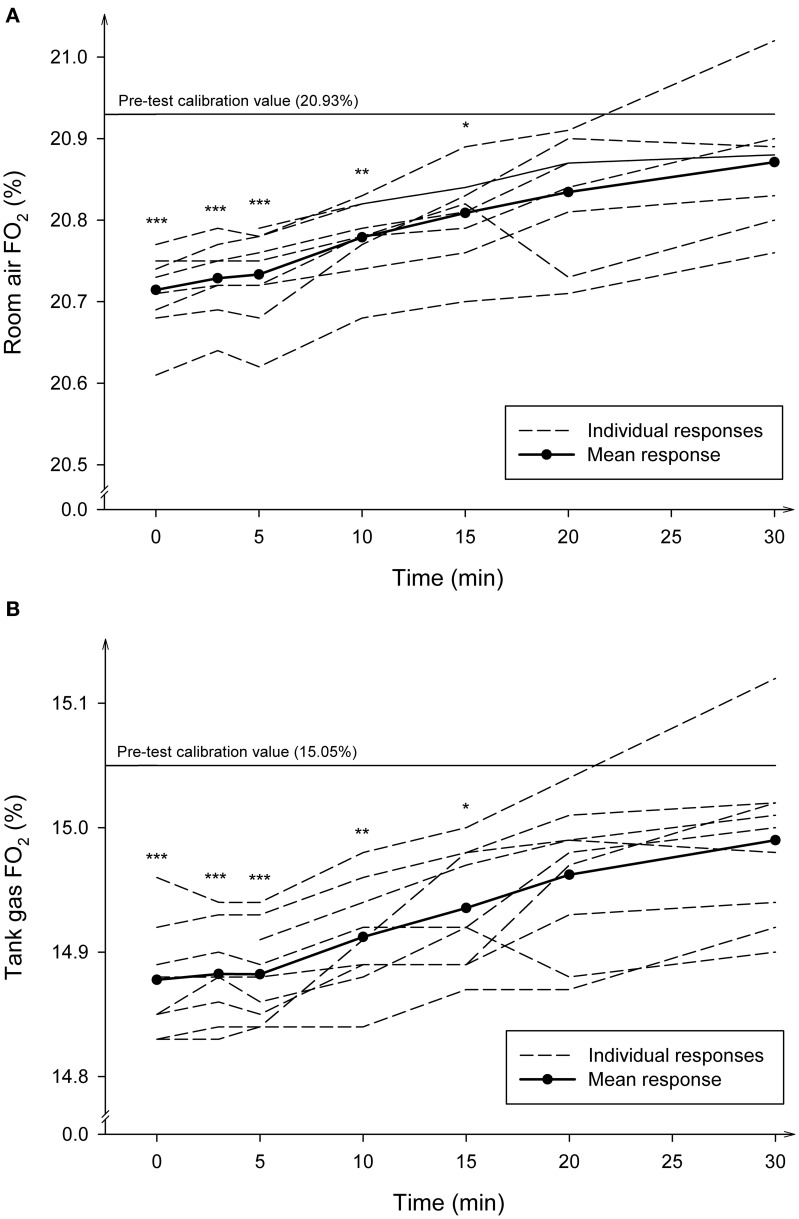
The aim was to examine the drift in the measurements of fractional concentration of oxygen (FO2) and carbon dioxide (FCO2) of a Nafion-using metabolic cart during incremental maximal exercise in 18 young and 12 elderly males, and to propose a way in which the drift can be corrected. The drift was verified by comparing the pre-test calibration values with the immediate post-test verification values of the calibration gases. The system demonstrated an average downscale drift (P < 0.001) in FO2 and FCO2 of -0.18% and -0.05%, respectively. Compared with measured values, corrected average maximal oxygen uptakevalues were 5-6% lower (P < 0.001) whereas corrected maximal respiratory exchange ratio values were 8-9% higher (P < 0.001). The drift was not due to an electronic instability in the analyzers because it was reverted after 20 min of recovery from the end of the exercise. The drift may be related to an incomplete removal of water vapor from the expired gas during transit through the Nafion conducting tube. These data demonstrate the importance of checking FO2 and FCO2 values by regular pre-test calibrations and post-test verifications, and also the importance of correcting a possible shift immediately after exercise.

Keywords: calibration; exercise testing; gas exchange; maximal oxygen consumption; verification.


Figures

Figure 1
Figure 1
Correction of fractional concentrations of oxygen. x1 and x2, true tank (x1 = 15.05%) and room air (x2 = 20.93%) fractions of oxygen; y1 and y2, fractions of tank (y1 = 15.05%) and room oxygen (y2 = 20.93%) read by the analyzer during the pre-test calibration process when the true tank (x1) and room air (x2) gases were aspirated by the analyzers; y′1 and y′2, fractions of tank (y′1), and room oxygen (y′2) read by the oxygen analyzer during the post-test verification process when true tank (x1) and room air (x2) gases were aspirated by the analyzers.
Figure 2
Figure 2
Relationships between the individual values of maximal minute ventilation and the individual post-test verification values of fractional concentrations of oxygen (FO2; A,B) and carbon dioxide (FCO2; C,D) when both calibration gases (room air and tank gas) were run through the metabolic system after maximal exercise. Open circles: elderly sedentary subjects. Filled circles: young athletes.
Figure 3
Figure 3
Individual measured (M) and corrected (C) values of maximal oxygen uptake (A) and maximal respiratory exchange ratio (B) in the young and elderly groups. Maximal oxygen uptake is expressed in ml·kg·min−1. The bars indicate mean values. ***Significant difference between the corrected and the corresponding measured values (P < 0.001). †Significant difference between groups (P < 0.05).
Figure 4
Figure 4
Average and individual time course of the fractional concentrations of oxygen (FO2) during recovery after maximal exercise. The post-test verification values read by the gas analyzers using the room air (A) and the tank gas (B) were measured at 20 s, 3, 5, 10, 15, 20, and 30 min of recovery. The number of observations made at each time-point was 9. ***Significantly different from pre-test (P < 0.001); **Significantly different from pre-test (P < 0.01); *Significantly different form pre-test (P < 0.05).

References

    1. Adami A., Sivieri A., Moia C., Perini R., Ferretti G. (2013). Effects of step duration in incremental ramp protocols on peak power and maximal oxygen consumption. Eur. J. Appl. Physiol. 113, 2647–2653. 10.1007/s00421-013-2705-9 - DOI - PubMed
    1. American College of Sports Medicine (2009). ACSM's Guidelines for Exercise Testing and Prescription. Philadelphia, PA: Lippincott Williams & Wilkins.
    1. American Thoracic Society (1987). Standardization of spirometry: 1987 update. statement of the american thoraccic society. Am. Rev. Respir. Dis. 136, 1285–1298. 10.1164/ajrccm/136.5.1285 - DOI - PubMed
    1. Armstrong L. E., Costill D. L. (1985). Variability of respiration and metabolism: responses to submaximal cycling and running. Res. Q. Exerc. Sport 56, 93–96. 10.1080/02701367.1985.10608441 - DOI
    1. Atkinson G., Davison R. C., Nevill A. M. (2005). Performance characteristics of gas analysis systems: what we know and what we need to know. Int. J. Sports Med. 26(Suppl. 1), S2–S10. 10.1055/s-2004-830505 - DOI - PubMed

LinkOut - more resources