

Panamanian frog species host unique skin bacterial communities
- PMID: 26579083
- PMCID: PMC4621460
- DOI: 10.3389/fmicb.2015.01171
Panamanian frog species host unique skin bacterial communities
Abstract
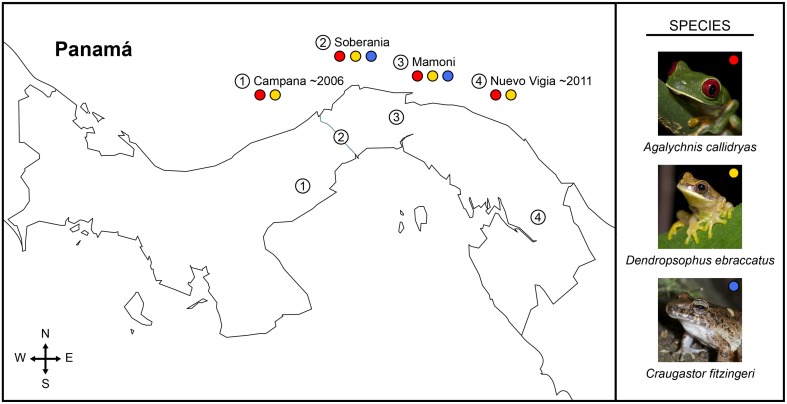
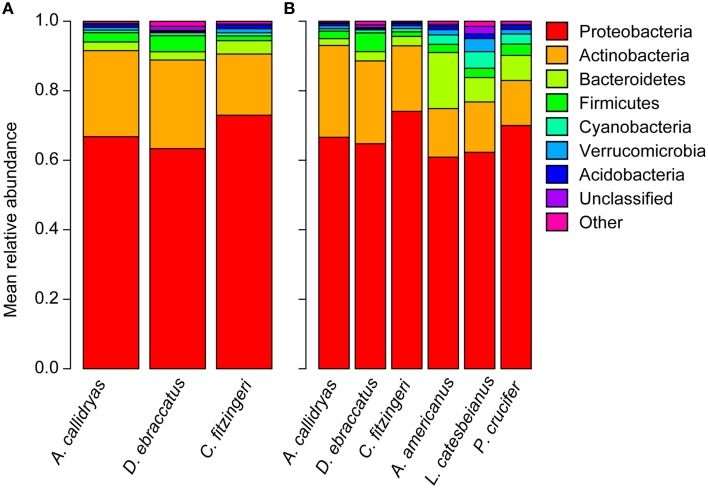
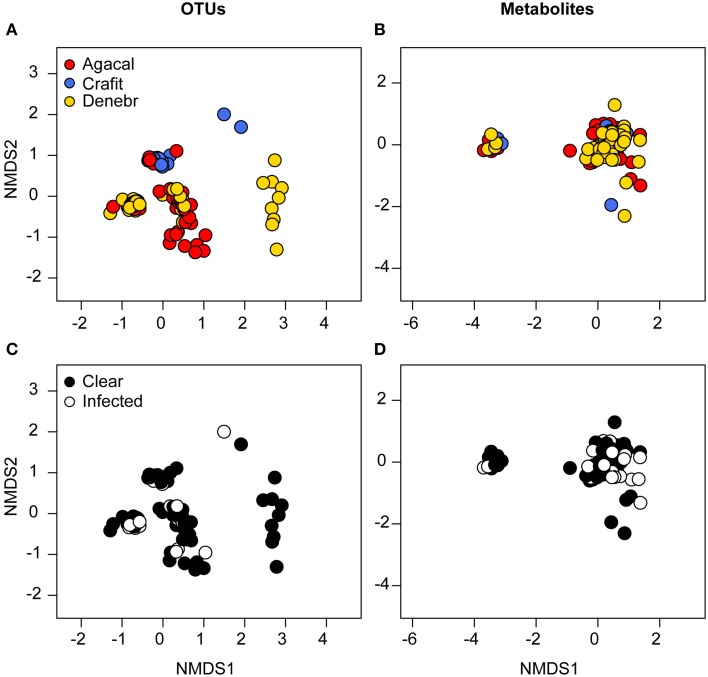
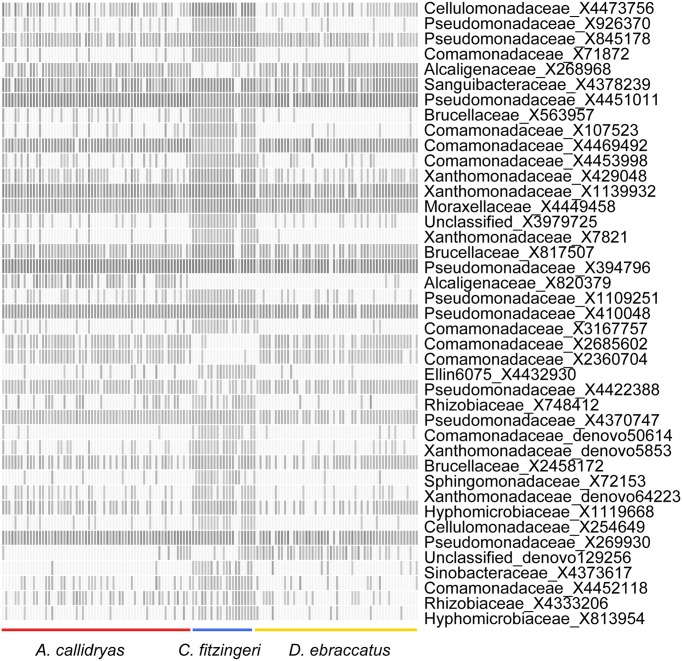
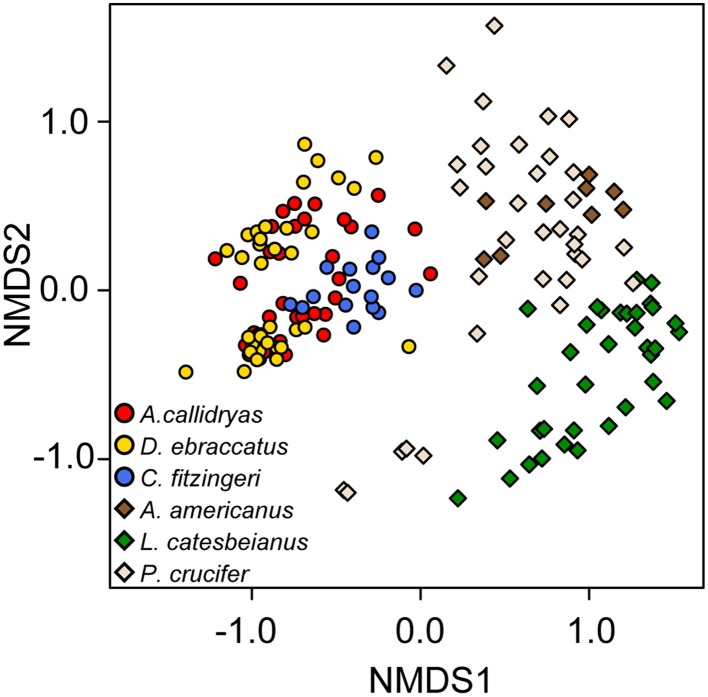
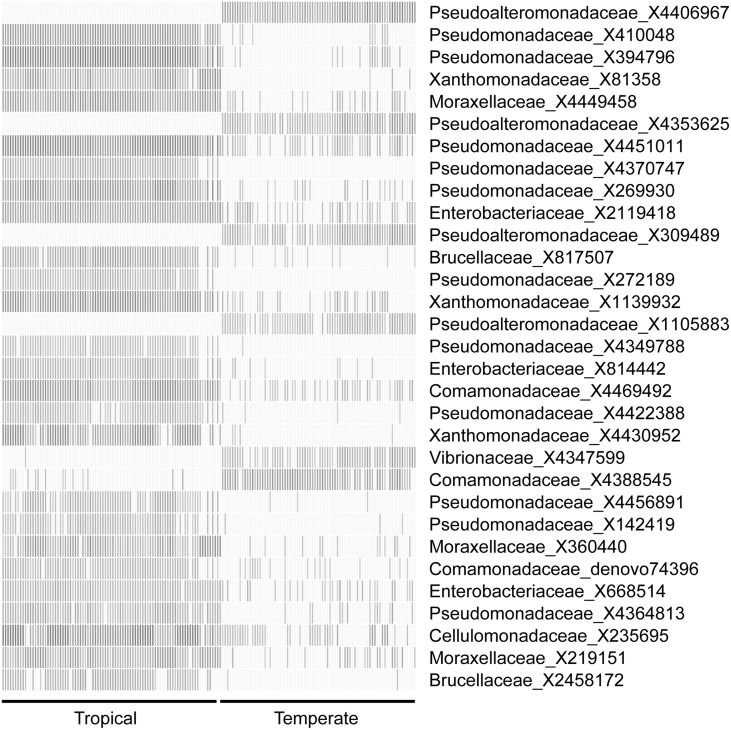
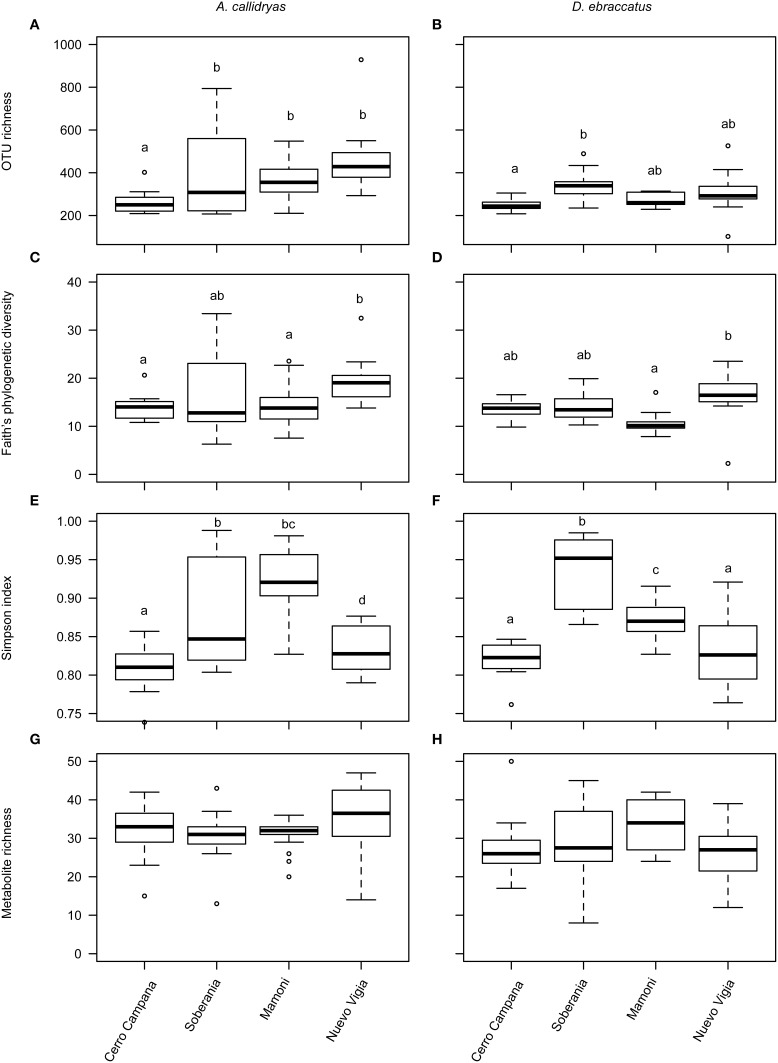
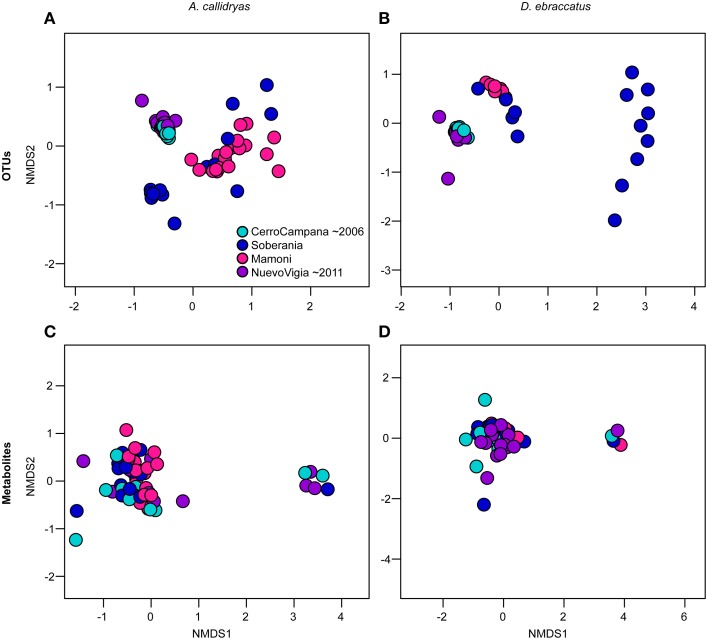
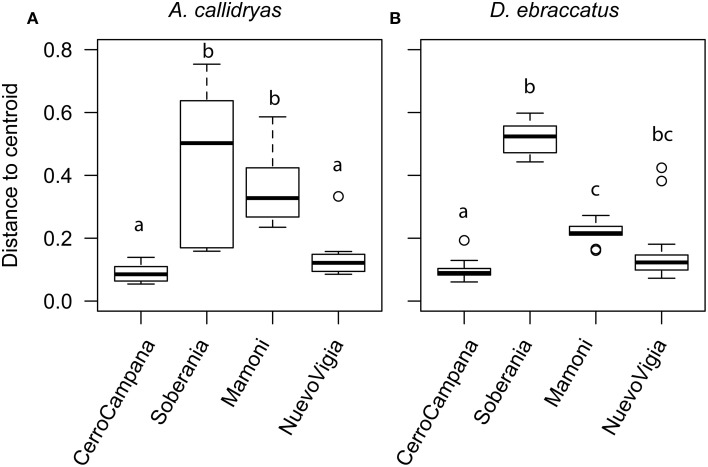
Vertebrates, including amphibians, host diverse symbiotic microbes that contribute to host disease resistance. Globally, and especially in montane tropical systems, many amphibian species are threatened by a chytrid fungus, Batrachochytrium dendrobatidis (Bd), that causes a lethal skin disease. Bd therefore may be a strong selective agent on the diversity and function of the microbial communities inhabiting amphibian skin. In Panamá, amphibian population declines and the spread of Bd have been tracked. In 2012, we completed a field survey in Panamá to examine frog skin microbiota in the context of Bd infection. We focused on three frog species and collected two skin swabs per frog from a total of 136 frogs across four sites that varied from west to east in the time since Bd arrival. One swab was used to assess bacterial community structure using 16S rRNA amplicon sequencing and to determine Bd infection status, and one was used to assess metabolite diversity, as the bacterial production of anti-fungal metabolites is an important disease resistance function. The skin microbiota of the three Panamanian frog species differed in OTU (operational taxonomic unit, ~bacterial species) community composition and metabolite profiles, although the pattern was less strong for the metabolites. Comparisons between frog skin bacterial communities from Panamá and the US suggest broad similarities at the phylum level, but key differences at lower taxonomic levels. In our field survey in Panamá, across all four sites, only 35 individuals (~26%) were Bd infected. There was no clustering of OTUs or metabolite profiles based on Bd infection status and no clear pattern of west-east changes in OTUs or metabolite profiles across the four sites. Overall, our field survey data suggest that different bacterial communities might be producing broadly similar sets of metabolites across frog hosts and sites. Community structure and function may not be as tightly coupled in these skin symbiont microbial systems as it is in many macro-systems.
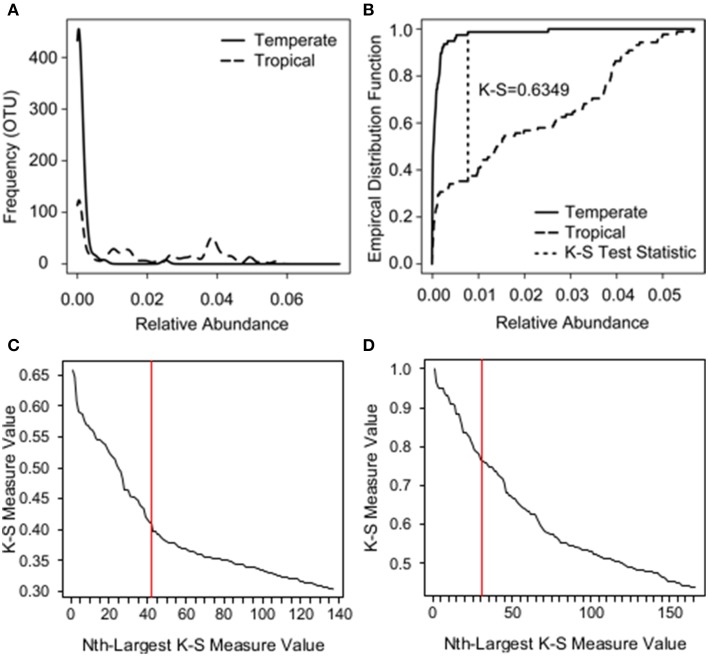
Keywords: Batrachochytrium dendrobatidis; Kolmogorov-Smirnov measure; amphibian; chytrid fungus; microbiome; microbiota; structure-function relationship.
Figures
Similar articles
-
Frog Skin Microbiota Vary With Host Species and Environment but Not Chytrid Infection.Front Microbiol. 2020 Jun 24;11:1330. doi: 10.3389/fmicb.2020.01330. eCollection 2020. Front Microbiol. 2020. PMID: 32670233 Free PMC article.
-
Variation in Metabolite Profiles of Amphibian Skin Bacterial Communities Across Elevations in the Neotropics.Microb Ecol. 2017 Jul;74(1):227-238. doi: 10.1007/s00248-017-0933-y. Epub 2017 Jan 19. Microb Ecol. 2017. PMID: 28105509
-
Skin bacterial diversity of Panamanian frogs is associated with host susceptibility and presence of Batrachochytrium dendrobatidis.ISME J. 2016 Jul;10(7):1682-95. doi: 10.1038/ismej.2015.234. Epub 2016 Jan 8. ISME J. 2016. PMID: 26744810 Free PMC article.
-
Composition of symbiotic bacteria predicts survival in Panamanian golden frogs infected with a lethal fungus.Proc Biol Sci. 2015 Apr 22;282(1805):20142881. doi: 10.1098/rspb.2014.2881. Proc Biol Sci. 2015. PMID: 25788591 Free PMC article.
-
Using "Omics" and Integrated Multi-Omics Approaches to Guide Probiotic Selection to Mitigate Chytridiomycosis and Other Emerging Infectious Diseases.Front Microbiol. 2016 Feb 2;7:68. doi: 10.3389/fmicb.2016.00068. eCollection 2016. Front Microbiol. 2016. PMID: 26870025 Free PMC article. Review.
Cited by
-
Amphibian skin-associated Pigmentiphaga: Genome sequence and occurrence across geography and hosts.PLoS One. 2019 Oct 11;14(10):e0223747. doi: 10.1371/journal.pone.0223747. eCollection 2019. PLoS One. 2019. PMID: 31603945 Free PMC article.
-
Body condition, skin bacterial communities and disease status: insights from the first release trial of the limosa harlequin frog, Atelopus limosus.Proc Biol Sci. 2022 Jul 13;289(1978):20220586. doi: 10.1098/rspb.2022.0586. Epub 2022 Jul 13. Proc Biol Sci. 2022. PMID: 35858072 Free PMC article.
-
Frog Skin Innate Immune Defences: Sensing and Surviving Pathogens.Front Immunol. 2019 Jan 14;9:3128. doi: 10.3389/fimmu.2018.03128. eCollection 2018. Front Immunol. 2019. PMID: 30692997 Free PMC article. Review.
-
Culture Media and Individual Hosts Affect the Recovery of Culturable Bacterial Diversity from Amphibian Skin.Front Microbiol. 2017 Aug 24;8:1574. doi: 10.3389/fmicb.2017.01574. eCollection 2017. Front Microbiol. 2017. PMID: 28883811 Free PMC article.
-
Land cover and forest connectivity alter the interactions among host, pathogen and skin microbiome.Proc Biol Sci. 2017 Aug 30;284(1861):20170582. doi: 10.1098/rspb.2017.0582. Proc Biol Sci. 2017. PMID: 28835551 Free PMC article.
References
-
- Anderson M. J. (2001). A new method for non-parametric multivariate analysis of variance. Austr. Ecol. 26, 32–46. 10.1046/j.1442-9993.2001.01070.x - DOI
-
- Aronesty E. (2011). Ea-utlls: Command-line Tools for Processing Biological Sequencing Data. Available online at: http://code.google.com/p/ea-utils
LinkOut - more resources
Full Text Sources
Other Literature Sources