

Metagenomic sequencing of marine periphyton: taxonomic and functional insights into biofilm communities
- PMID: 26579098
- PMCID: PMC4626570
- DOI: 10.3389/fmicb.2015.01192
Metagenomic sequencing of marine periphyton: taxonomic and functional insights into biofilm communities
Abstract
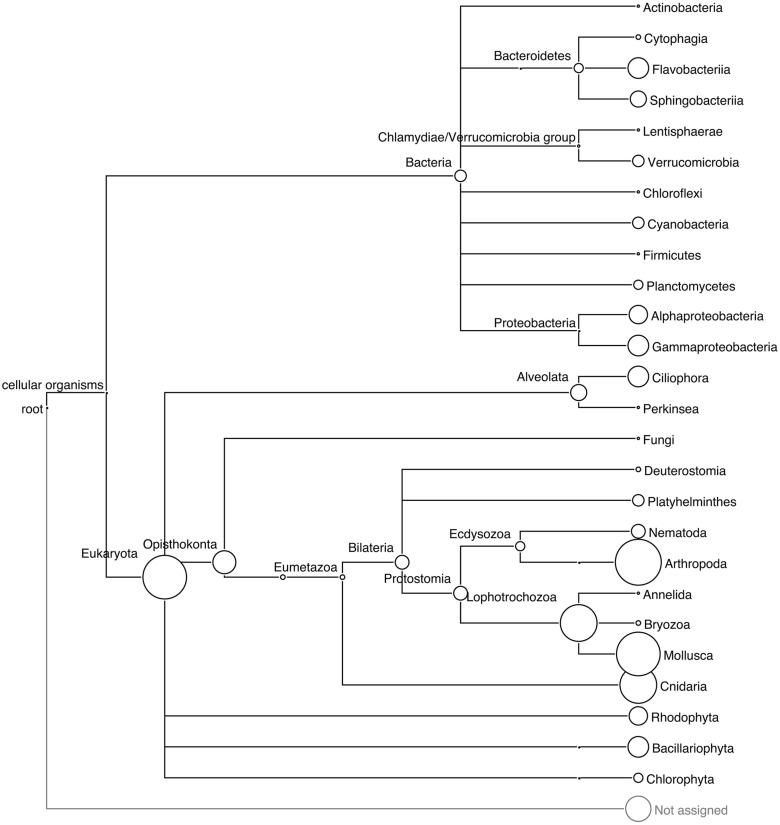
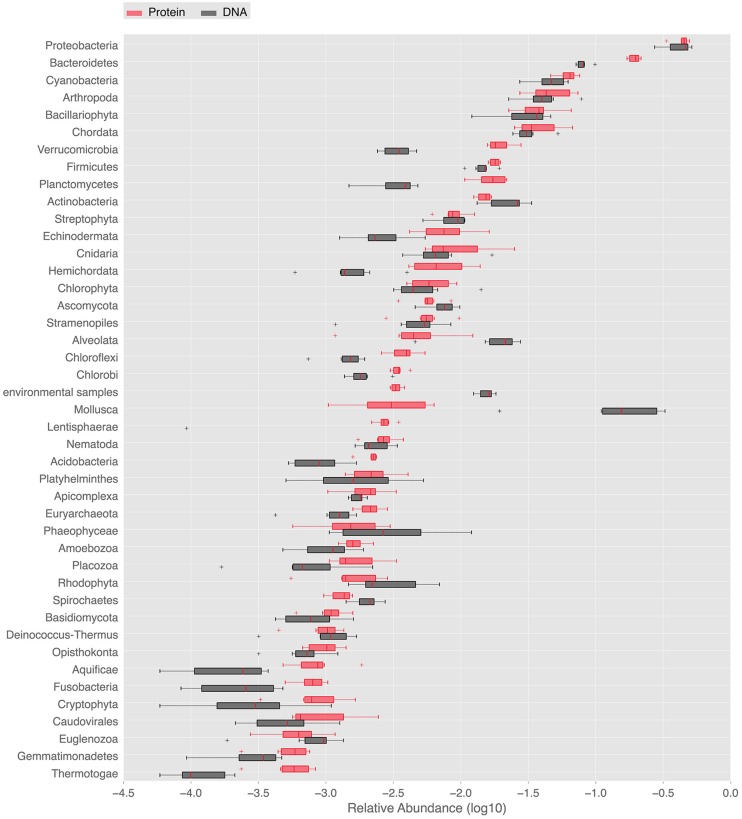
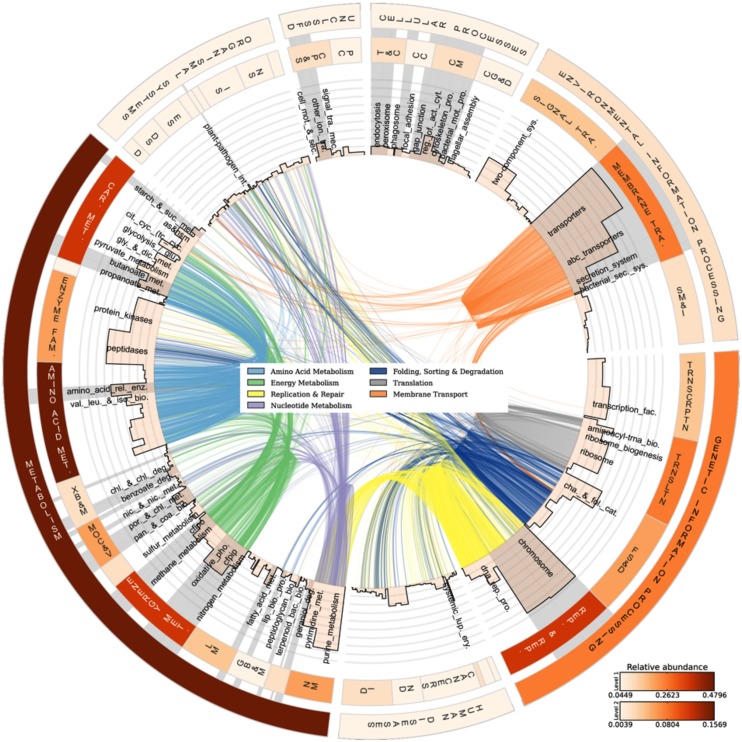
Periphyton communities are complex phototrophic, multispecies biofilms that develop on surfaces in aquatic environments. These communities harbor a large diversity of organisms comprising viruses, bacteria, algae, fungi, protozoans, and metazoans. However, thus far the total biodiversity of periphyton has not been described. In this study, we use metagenomics to characterize periphyton communities from the marine environment of the Swedish west coast. Although we found approximately ten times more eukaryotic rRNA marker gene sequences compared to prokaryotic, the whole metagenome-based similarity searches showed that bacteria constitute the most abundant phyla in these biofilms. We show that marine periphyton encompass a range of heterotrophic and phototrophic organisms. Heterotrophic bacteria, including the majority of proteobacterial clades and Bacteroidetes, and eukaryotic macro-invertebrates were found to dominate periphyton. The phototrophic groups comprise Cyanobacteria and the alpha-proteobacterial genus Roseobacter, followed by different micro- and macro-algae. We also assess the metabolic pathways that predispose these communities to an attached lifestyle. Functional indicators of the biofilm form of life in periphyton involve genes coding for enzymes that catalyze the production and degradation of extracellular polymeric substances, mainly in the form of complex sugars such as starch and glycogen-like meshes together with chitin. Genes for 278 different transporter proteins were detected in the metagenome, constituting the most abundant protein complexes. Finally, genes encoding enzymes that participate in anaerobic pathways, such as denitrification and methanogenesis, were detected suggesting the presence of anaerobic or low-oxygen micro-zones within the biofilms.
Keywords: biodiversity; biofouling; marine biofilms; microbial ecology; next generation sequencing; pathway analysis; shotgun metagenomics; shotgun sequencing.
Figures
Similar articles
-
Metagenomic Analysis of Zinc Surface-Associated Marine Biofilms.Microb Ecol. 2019 Feb;77(2):406-416. doi: 10.1007/s00248-018-01313-3. Epub 2019 Jan 5. Microb Ecol. 2019. PMID: 30612183
-
Marine biofilms: diversity of communities and of chemical cues.Environ Microbiol Rep. 2019 Jun;11(3):287-305. doi: 10.1111/1758-2229.12694. Epub 2018 Oct 15. Environ Microbiol Rep. 2019. PMID: 30246474 Review.
-
Integrated metagenomic and metaproteomic analyses of marine biofilm communities.Biofouling. 2014;30(10):1211-23. doi: 10.1080/08927014.2014.977267. Biofouling. 2014. PMID: 25407927
-
Metagenomic analysis of sludge and early-stage biofilm communities of a submerged membrane bioreactor.Sci Total Environ. 2020 Jan 20;701:134682. doi: 10.1016/j.scitotenv.2019.134682. Epub 2019 Oct 24. Sci Total Environ. 2020. PMID: 31704413
-
Substratum-associated microbiota.Water Environ Res. 2020 Oct;92(10):1629-1648. doi: 10.1002/wer.1410. Epub 2020 Aug 25. Water Environ Res. 2020. PMID: 33463854 Review.
Cited by
-
Copper Affects Composition and Functioning of Microbial Communities in Marine Biofilms at Environmentally Relevant Concentrations.Front Microbiol. 2019 Jan 8;9:3248. doi: 10.3389/fmicb.2018.03248. eCollection 2018. Front Microbiol. 2019. PMID: 30671047 Free PMC article.
-
A comprehensive fungi-specific 18S rRNA gene sequence primer toolkit suited for diverse research issues and sequencing platforms.BMC Microbiol. 2018 Nov 20;18(1):190. doi: 10.1186/s12866-018-1331-4. BMC Microbiol. 2018. PMID: 30458701 Free PMC article.
-
Distinct Temporal Succession of Bacterial Communities in Early Marine Biofilms in a Portuguese Atlantic Port.Front Microbiol. 2020 Aug 11;11:1938. doi: 10.3389/fmicb.2020.01938. eCollection 2020. Front Microbiol. 2020. PMID: 32849482 Free PMC article.
-
Comparison of Methods for Picking the Operational Taxonomic Units From Amplicon Sequences.Front Microbiol. 2021 Mar 24;12:644012. doi: 10.3389/fmicb.2021.644012. eCollection 2021. Front Microbiol. 2021. PMID: 33841367 Free PMC article.
-
Microbial community and network responses across strong environmental gradients: How do they compare with macroorganisms?FEMS Microbiol Ecol. 2024 Feb 14;100(3):fiae017. doi: 10.1093/femsec/fiae017. FEMS Microbiol Ecol. 2024. PMID: 38327185 Free PMC article.
References
LinkOut - more resources
Full Text Sources
Other Literature Sources
Molecular Biology Databases