. 2015 Oct 27:6:1200.
doi: 10.3389/fmicb.2015.01200. eCollection 2015.

Cross-biome comparison of microbial association networks

Affiliations

Cross-biome comparison of microbial association networks

Karoline Faust et al. Front Microbiol. .

Abstract

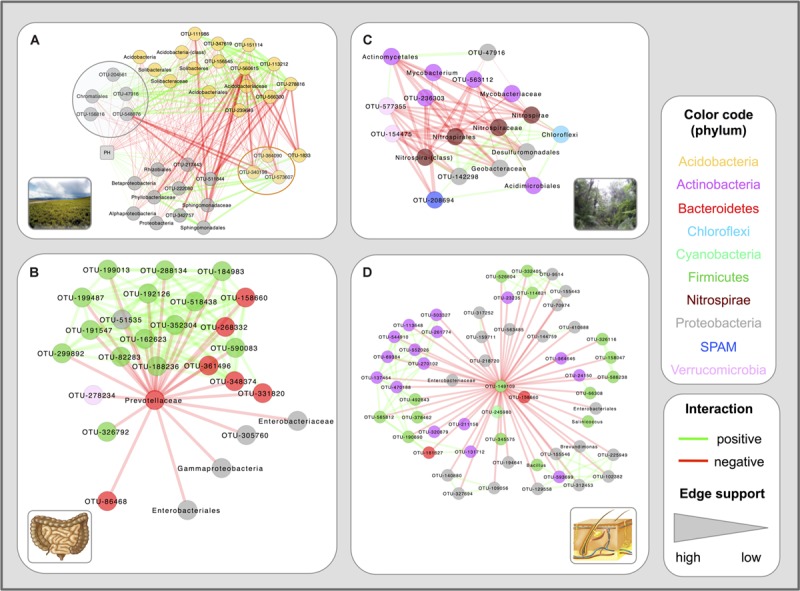
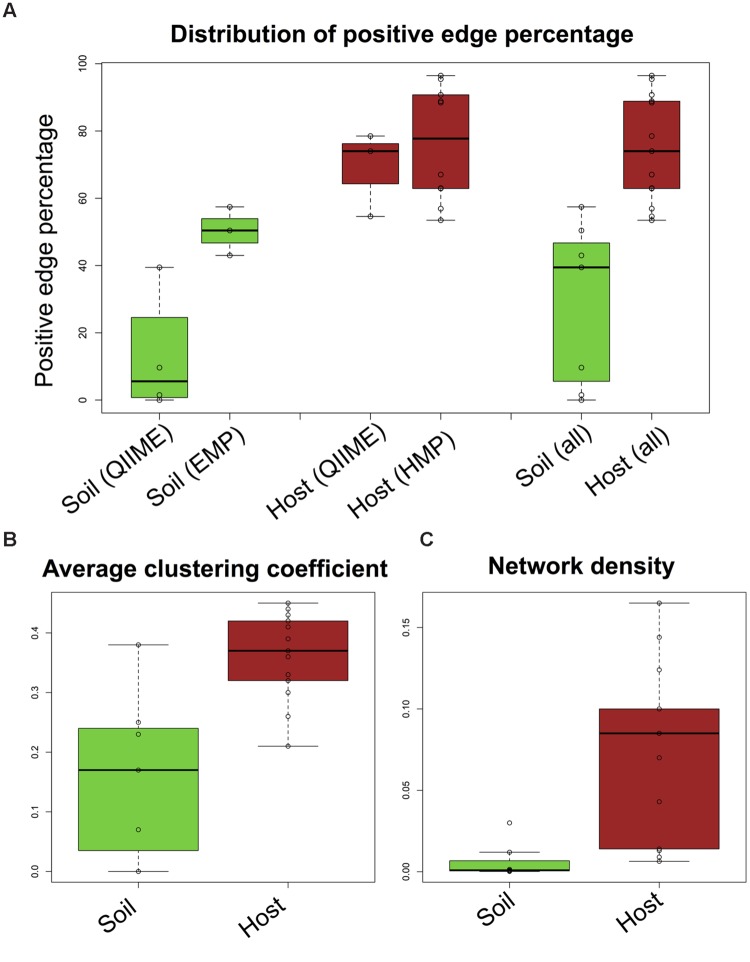
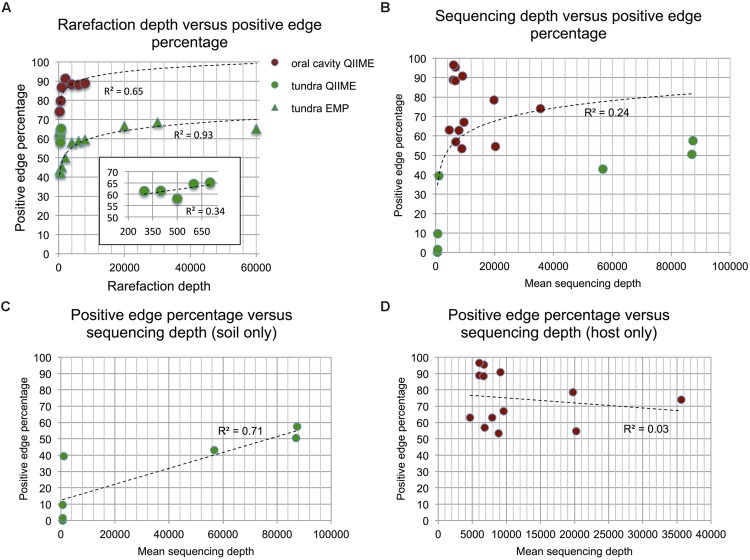
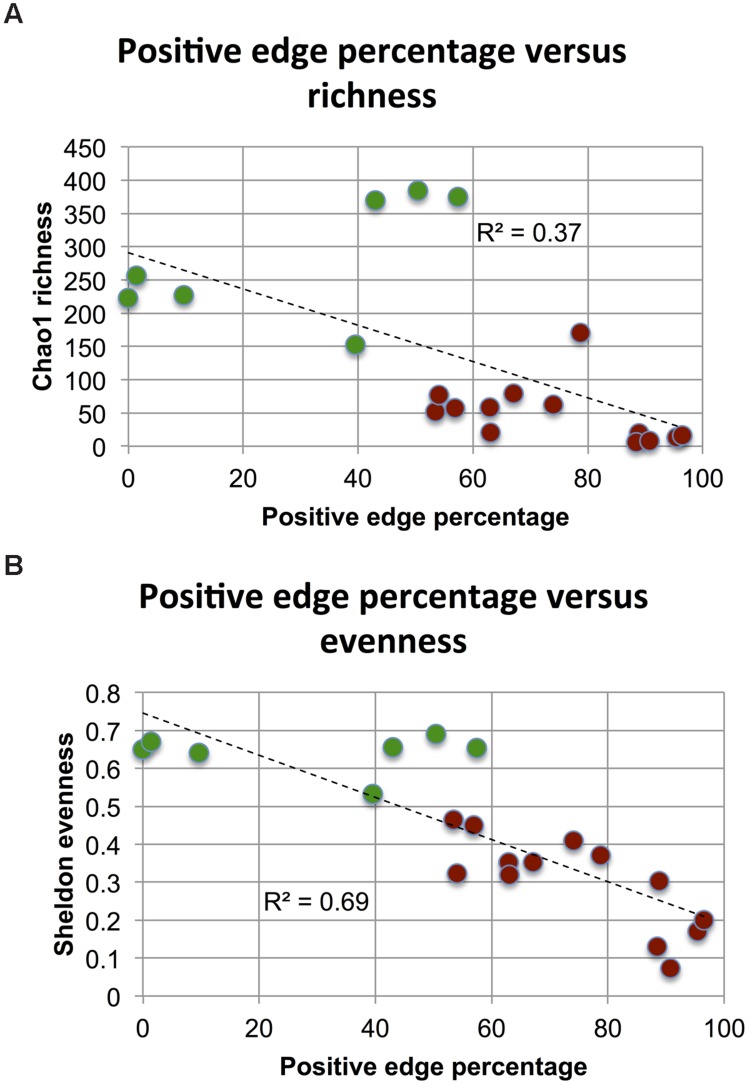
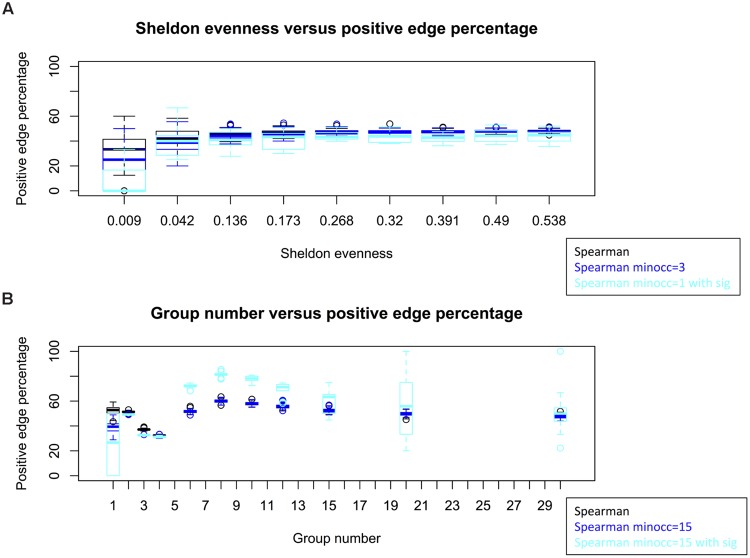
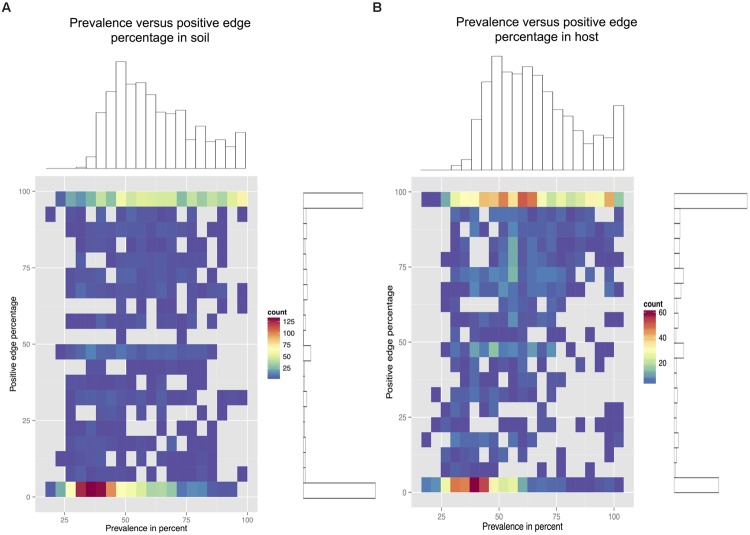
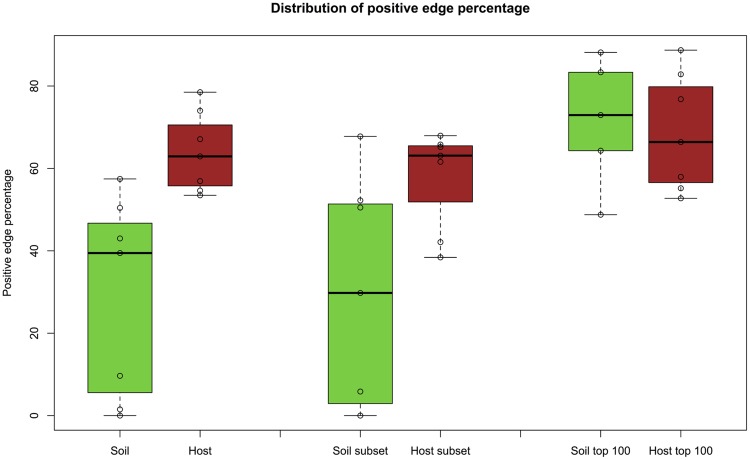
Clinical and environmental meta-omics studies are accumulating an ever-growing amount of microbial abundance data over a wide range of ecosystems. With a sufficiently large sample number, these microbial communities can be explored by constructing and analyzing co-occurrence networks, which detect taxon associations from abundance data and can give insights into community structure. Here, we investigate how co-occurrence networks differ across biomes and which other factors influence their properties. For this, we inferred microbial association networks from 20 different 16S rDNA sequencing data sets and observed that soil microbial networks harbor proportionally fewer positive associations and are less densely interconnected than host-associated networks. After excluding sample number, sequencing depth and beta-diversity as possible drivers, we found a negative correlation between community evenness and positive edge percentage. This correlation likely results from a skewed distribution of negative interactions, which take place preferentially between less prevalent taxa. Overall, our results suggest an under-appreciated role of evenness in shaping microbial association networks.

Keywords: 16S rDNA sequencing; co-occurrence; evenness; microbial communities; network comparison; positive edge percentage.


Figures

FIGURE 1
FIGURE 1
Example networks constructed from QIIME 16S data. Four sub-networks, i.e. node and edge sub-sets from the inferred networks, are shown. The tundra sub-network (A) is dominated by two mutually exclusive clusters consisting of Acidobacteria and Alphaproteobacteria, the first of which is anti-correlated and the second correlated to pH. Notable exceptions to this trend are the Chloracidobacteria (a class within the Acidobacteria, here highlighted with an orange circle) which are positively correlated to pH, and several Rhizobiales (Alphaproteobacteria) and Chromatiales (Gammaproteobacteria) members (gray circle), which are negatively correlated to pH. The gut sub-network (B) reproduces the Prevotella enterotype, including negative correlations of the Prevotellaceae to an Akkermansia and an Escherichia OTU as well as to several Bacteroides OTUs. The moist forest sub-network (C) displays the neighbors of higher-level Nitrospirae representatives, among them the Geobacteraceae, with which Nitrospirales members might cross-feed. The skin sub-network (D) shows the neighbors of a Streptococcus OTU that acts as a negative hub.
FIGURE 2
FIGURE 2
Differences between host and soil networks. Soil networks fall into two groups, characterized by low (QIIME soils) and high sequencing depth [Earth Microbiome Project (EMP) soils], whereas host networks constructed from QIIME and Human Microbiome Project (HMP) samples have comparable PEP. When taking all networks together, PEP in soil is significantly lower (p-value: 0.0002 according to the Wilcoxon rank sum test) than in host (A). The average clustering coefficient (B) and network density (C) are also significantly different (p-values: 0.004 and 0.002, Wilcoxon rank sum test). Network density is computed as 2E/N(N-1), where E is the edge number and N the number of taxa in the processed matrix.
FIGURE 3
FIGURE 3
Impact of sequencing depth. Oral cavity and tundra networks were re-constructed from QIIME and EMP data rarefied to different depths (minimum occurrence was set to 13 for tundra QIIME, to 22 for tundra EMP and to 137 for oral cavity). In all cases, positive edge percentage (PEP) is correlated with sequencing depth (A; Spearman’s rho tundra QIIME: 0.7, p-value: 0.23, tundra EMP: 0.95, p-value: 2E-16, oral cavity: 0.75, p-value: 0.07). The trend line for oral cavity and tundra EMP is a logarithmic function of sequencing depth, whereas a linear trend line was fitted to tundra QIIME. Although sequencing depth is not significantly associated to PEP for all biomes (B; Spearman’s rho: 0.155, p-value: 0.51, logarithmic trend line), a significant correlation is detected when only soil biomes are considered (C; Spearman’s rho: 1, p-value: 0.0004). For host biomes, the correlation between PEP and sequencing depth is not significant (D; Spearman’s rho: 0.34, p-value: 0.26). Host data is colored in brown, soil data in green.
FIGURE 4
FIGURE 4
Impact of richness and evenness. When assessing richness (using median Chao1) and evenness (using median Sheldon’s index) in 20 (processed and rarefied) soil and host biomes, richness is found to be weakly anti-correlated (A) and evenness strongly anti-correlated to PEP (B). Host data is colored in brown, soil data in green.
FIGURE 5
FIGURE 5
Simulations with an interaction-free null model. Evenness does not alter PEP in simulations, though the variance of PEP increases for low evenness, when most taxa are absent across all samples (A). When introducing group structure, PEP varies non-linearly with group number (B). Count matrices were simulated with 50 taxa and 10 samples (A) and 120 taxa and 60 samples (B) and networks were built using Spearman with cut-off at ±0.2. For the cyan box plots, significance was assessed by computing p-values from permutation and bootstrap distributions and correcting for multiple testing with Benjamini and Hochberg’s (1995) procedure. Matrix generation and network construction were repeated 100 times for each box plot (10 times when significance was assessed). Permutations and bootstraps were carried out with 100 iterations each. The parameter “minocc” refers to a filter step that removes all taxa occurring in less than the specified sample number.
FIGURE 6
FIGURE 6
Prevalence density plots. The prevalence (measured as the percentage of occurrence across samples) and PEP in soil networks (A) and host networks (B) is divided in 20 bins and each node is placed in its bin combination. On the right and top of each density plot, the node-specific PEP and prevalence histograms are shown. In soil networks, node PEP tends to be low at lower prevalence, whereas in host networks, low PEP at low prevalence is balanced by high PEP at higher prevalence.
FIGURE 7
FIGURE 7
PEP for top 100 prevalent taxa. When networks are inferred from the top 100 prevalent taxa, the average PEP of soil networks increases, in contrast to host networks (fifth and sixth box plot). For comparison, PEP distributions of soil and host networks (first and second box plot) as well as soil and host networks excluding biomes with less than 100 OTUs (nasal cavity, skin, and vagina from the HMP dataset) and without higher-level taxa and metadata (third and fourth box plot) are also displayed. The Wilcoxon rank sum test for the latter case (third and fourth box plot) gives a p-value of 0.0014, whereas the PEP distribution difference for top-prevalent soil and host OTUs is no longer significant (p-value: 0.88).

References

    1. Aderhold A., Husmeier D., Lennon J. J., Beale C. M., Smith V. A. (2012). Hierarchical Bayesian models in ecology: reconstructing species interaction networks from non-homogeneous species abundance data. Ecol. Inform. 11 55–64. 10.1016/j.ecoinf.2012.05.002 - DOI
    1. Aitchison J. (2003). “A concise guide to compositional data analysis,” in Proceedings of the 2nd Compositional Data Analysis Workshop Girona.
    1. Alatalo R. V. (1981). Problems in the measurement of evenness in ecology. Oikos 37 199–204. 10.2307/3544465 - DOI
    1. Arumugam M., Raes J., Pelletier E., Le Paslier D., Yamada T., Mende D. R., et al. (2011). Enterotypes of the human gut microbiome. Nature 473 174–180. 10.1038/nature09944 - DOI - PMC - PubMed
    1. Ban Y., An L., Jiang H. (2015). Investigating microbial co-occurrence patterns based on metagenomic compositional data. Bioinformatics 31 3322–3329. 10.1093/bioinformatics/btv364 - DOI - PMC - PubMed