

2-Deoxy-2-fluoro-d-glucose metabolism in Arabidopsis thaliana
- PMID: 26579178
- PMCID: PMC4630959
- DOI: 10.3389/fpls.2015.00935
2-Deoxy-2-fluoro-d-glucose metabolism in Arabidopsis thaliana
Abstract
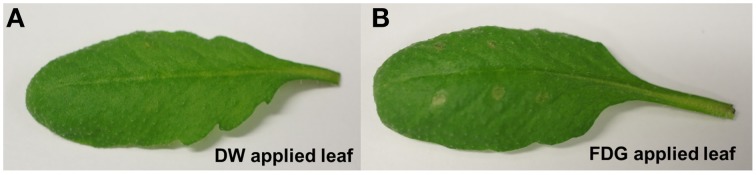
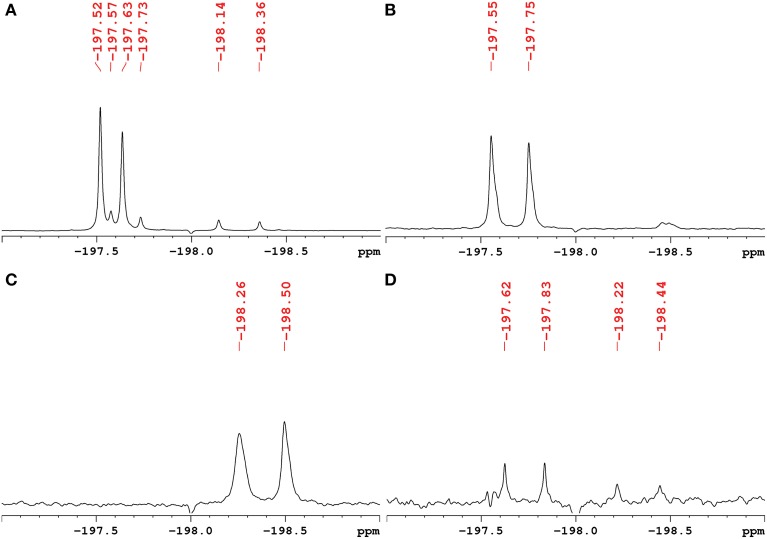
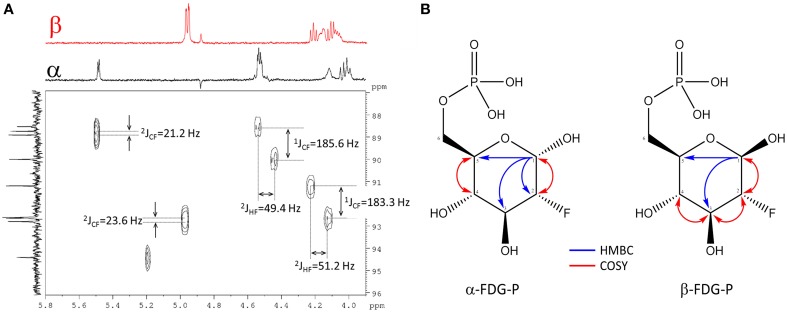
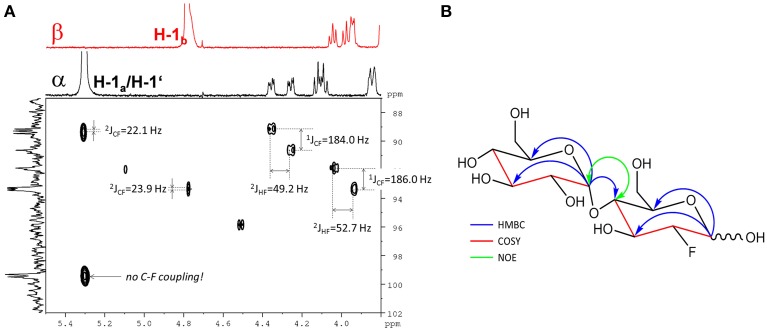
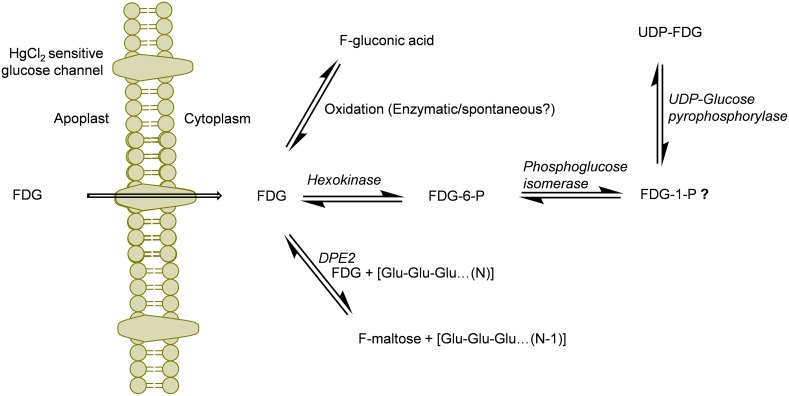
2-Deoxy-2-fluoro-d-glucose (FDG) is glucose analog routinely used in clinical and animal radiotracer studies to trace glucose uptake but it has rarely been used in plants. Previous studies analyzed FDG translocation and distribution pattern in plants and proposed that FDG could be used as a tracer for photoassimilates in plants. Elucidating FDG metabolism in plants is a crucial aspect for establishing its application as a radiotracer in plant imaging. Here, we describe the metabolic fate of FDG in the model plant species Arabidopsis thaliana. We fed FDG to leaf tissue and analyzed leaf extracts using MS and NMR. On the basis of exact mono-isotopic masses, MS/MS fragmentation, and NMR data, we identified 2-deoxy-2-fluoro-gluconic acid, FDG-6-phosphate, 2-deoxy-2-fluoro-maltose, and uridine-diphosphate-FDG as four major end products of FDG metabolism. Glycolysis and starch degradation seemed to be the important pathways for FDG metabolism. We showed that FDG metabolism in plants is considerably different than animal cells and goes beyond FDG-phosphate as previously presumed.
Keywords: 2-deoxy-2-fluoro-d-glucose; Arabidopsis thaliana; F-maltose; FDG; FDG-6-phosphate; UDP-FDG; metabolism; plant.
Figures
Similar articles
-
Applications of 2-deoxy-2-fluoro-D-glucose (FDG) in Plant Imaging: Past, Present, and Future.Front Plant Sci. 2016 May 9;7:483. doi: 10.3389/fpls.2016.00483. eCollection 2016. Front Plant Sci. 2016. PMID: 27242806 Free PMC article. Review.
-
Comparing 2-[18F]fluoro-2-deoxy-D-glucose and [68Ga]gallium-citrate translocation in Arabidopsis thaliana.Nucl Med Biol. 2014 Oct;41(9):737-43. doi: 10.1016/j.nucmedbio.2014.05.143. Epub 2014 Jun 9. Nucl Med Biol. 2014. PMID: 25037754
-
Reciprocal effects of 2-fluoro-2-deoxy-D-glucose and glucose on their metabolism in Saccharomyces cerevisiae studied by multi-nuclear NMR spectroscopy.Biochimie. 1995;77(4):233-9. doi: 10.1016/0300-9084(96)88129-6. Biochimie. 1995. PMID: 8589050
-
Novel application of 2-[(18)F]fluoro-2-deoxy-D-glucose to study plant defenses.Nucl Med Biol. 2012 Nov;39(8):1152-60. doi: 10.1016/j.nucmedbio.2012.06.005. Epub 2012 Jul 12. Nucl Med Biol. 2012. PMID: 22795788
-
[The value of 18F-fluoro-2-deoxy-D-glucose positron emission tomography (18F-FDG PET) in diagnosis of neoplastic diseases].Med Clin (Barc). 2005 Feb 19;124(6):229-36. doi: 10.1157/13071769. Med Clin (Barc). 2005. PMID: 15737307 Review. Spanish.
Cited by
-
Applications of 2-deoxy-2-fluoro-D-glucose (FDG) in Plant Imaging: Past, Present, and Future.Front Plant Sci. 2016 May 9;7:483. doi: 10.3389/fpls.2016.00483. eCollection 2016. Front Plant Sci. 2016. PMID: 27242806 Free PMC article. Review.
-
2-NBDG Uptake in Gossypium hirsutum in vitro ovules: exploring tissue-specific accumulation and its impact on hexokinase-mediated glycolysis regulation.Front Plant Sci. 2023 Sep 25;14:1242150. doi: 10.3389/fpls.2023.1242150. eCollection 2023. Front Plant Sci. 2023. PMID: 37818315 Free PMC article.
-
Past and Future of Plant Stress Detection: An Overview From Remote Sensing to Positron Emission Tomography.Front Plant Sci. 2021 Jan 27;11:609155. doi: 10.3389/fpls.2020.609155. eCollection 2020. Front Plant Sci. 2021. PMID: 33584752 Free PMC article. Review.
References
-
- Alavi A., Reivich M., Jones S. C., Greenberg J. H., Wolf A. P. (1982). Functional imaging of the brain with positron emission tomography, in Nuclear Medicine Annual, eds Freeman L. M., Weissmann H. S. (New York, NY: Raven Press; ), 319–372.
-
- Avril N. (2004). GLUT1 expression in tissue and (18) F-FDG uptake. J. Nucl. Med. 45:930. - PubMed
-
- Bender D., Munk O. L., Feng H. Q., Keiding S. (2001). Metabolites of (18) F-FDG and 3-O-(11) C-methylglucose in pig liver. J. Nucl. Med. 42:1673. - PubMed
LinkOut - more resources
Full Text Sources
Other Literature Sources