. 2015 Nov 17:8:47.
doi: 10.1186/s13072-015-0038-0. eCollection 2015.

Remodeling of nuclear landscapes during human myelopoietic cell differentiation maintains co-aligned active and inactive nuclear compartments

Affiliations

Remodeling of nuclear landscapes during human myelopoietic cell differentiation maintains co-aligned active and inactive nuclear compartments

Barbara Hübner et al. Epigenetics Chromatin. .

Abstract

Background: Previous studies of higher order chromatin organization in nuclei of mammalian species revealed both structural consistency and species-specific differences between cell lines and during early embryonic development. Here, we extended our studies to nuclear landscapes in the human myelopoietic lineage representing a somatic cell differentiation system. Our longterm goal is a search for structural features of nuclei, which are restricted to certain cell types/species, as compared to features, which are evolutionary highly conserved, arguing for their basic functional roles in nuclear organization.

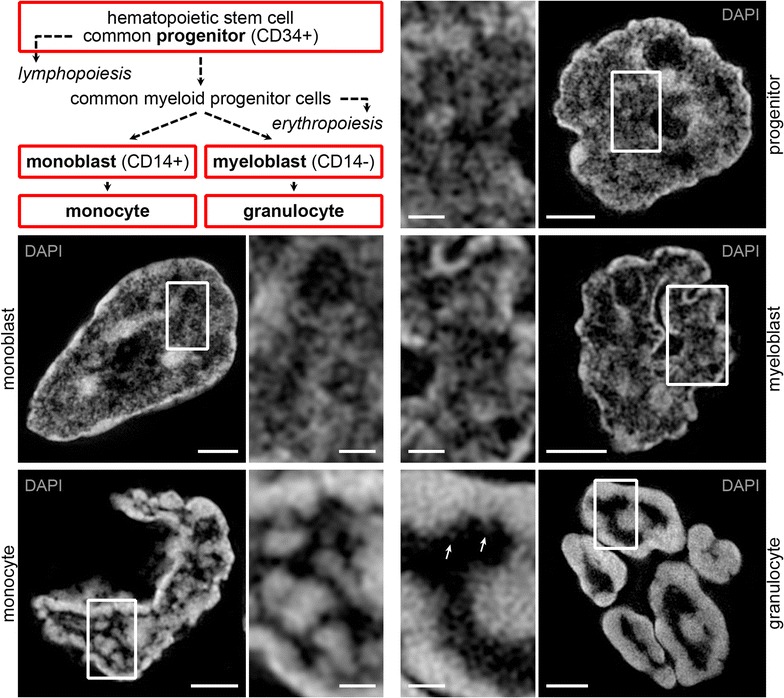
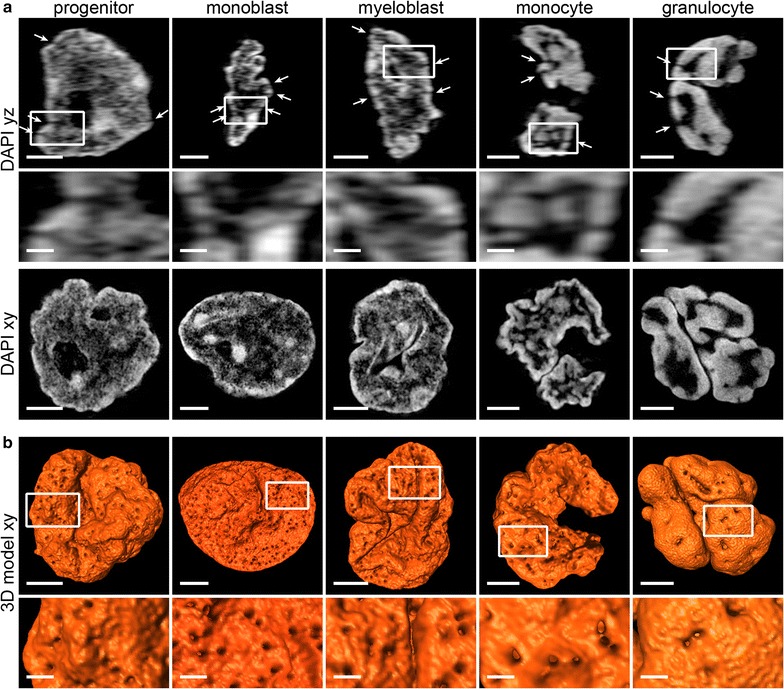
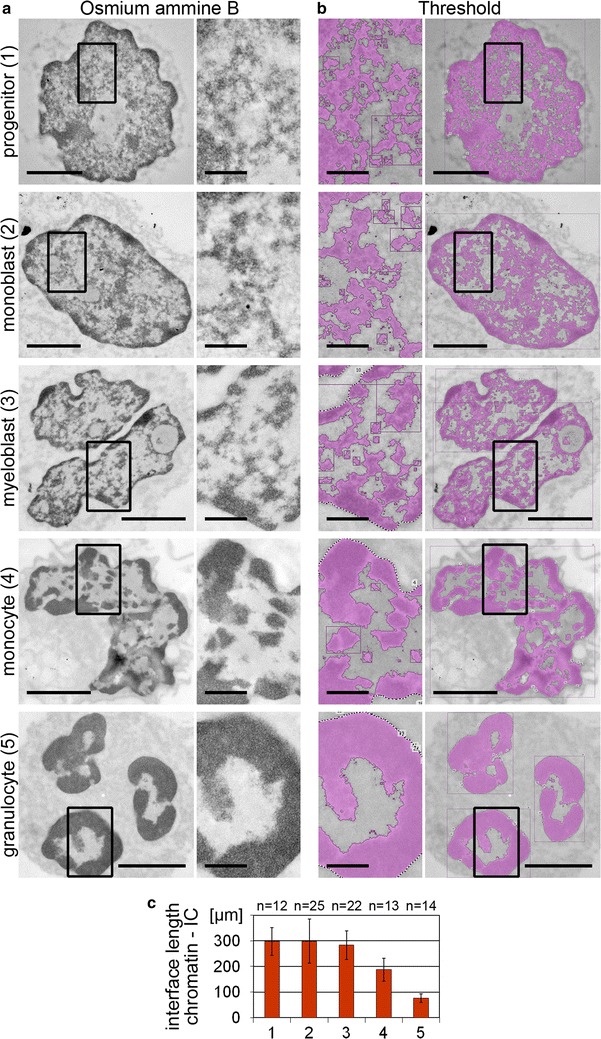
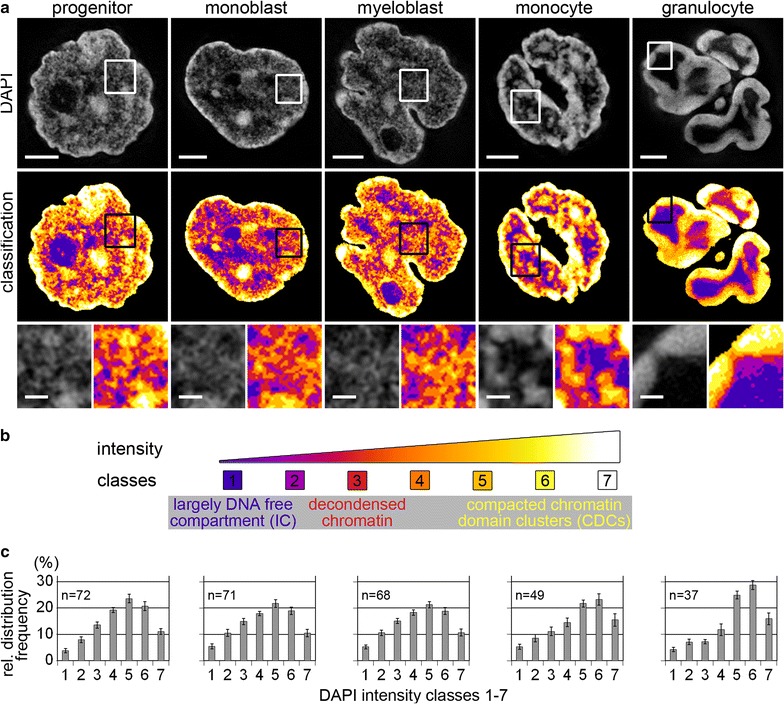
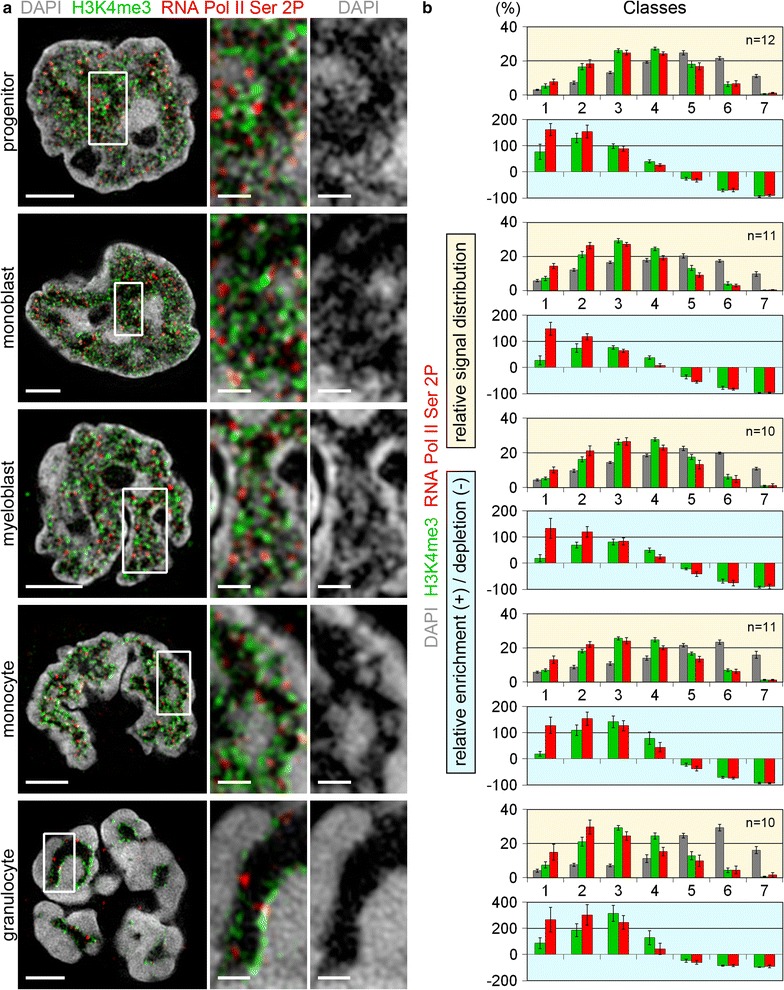
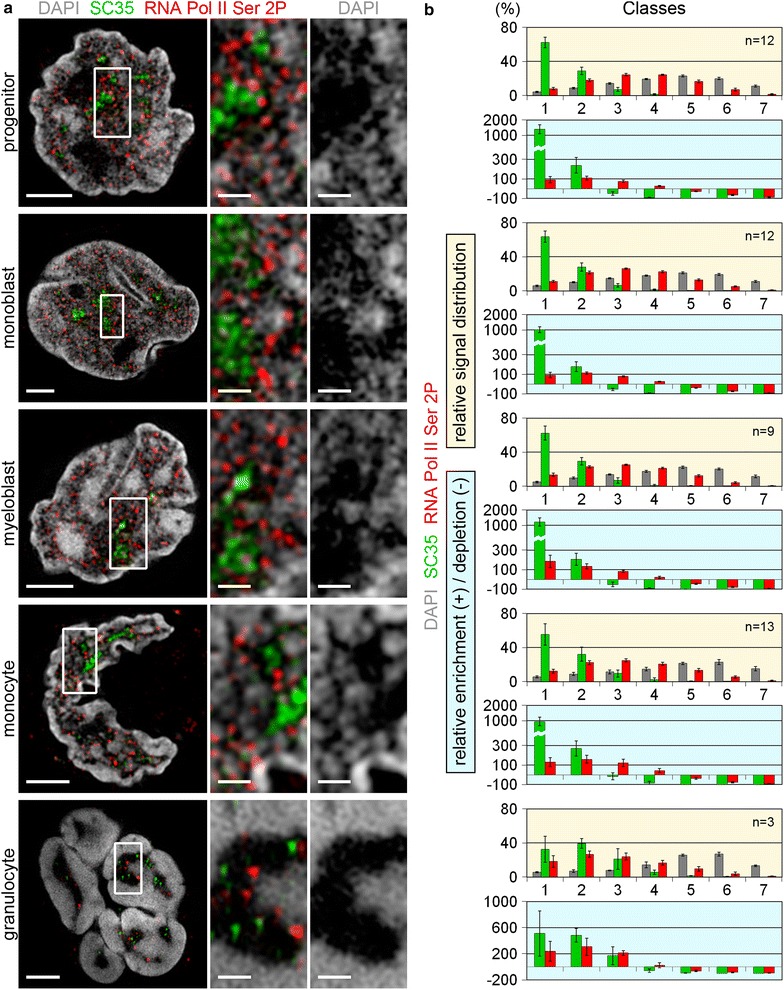
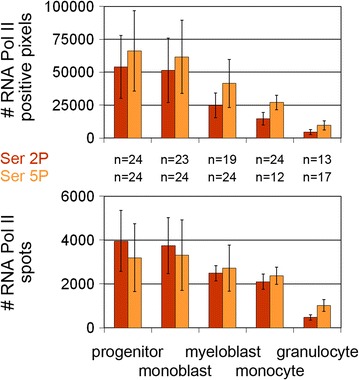
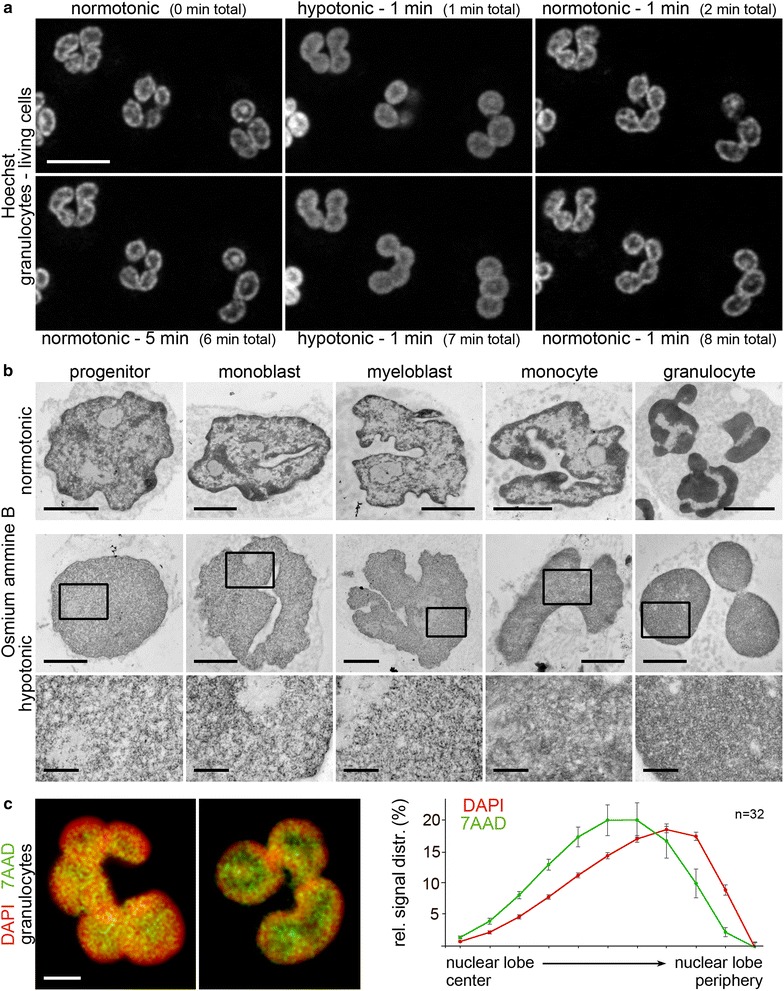
Results: Common human hematopoietic progenitors, myeloid precursor cells, differentiated monocytes and granulocytes analyzed by super-resolution fluorescence microscopy and electron microscopy revealed profound differences with respect to global chromatin arrangements, the nuclear space occupied by the interchromatin compartment and the distribution of nuclear pores. In contrast, we noted a consistent organization in all cell types with regard to two co-aligned networks, an active (ANC) and an inactive (INC) nuclear compartment delineated by functionally relevant hallmarks. The ANC is enriched in active RNA polymerase II, splicing speckles and histone signatures for transcriptionally competent chromatin (H3K4me3), whereas the INC carries marks for repressed chromatin (H3K9me3).

Conclusions: Our findings substantiate the conservation of the recently published ANC-INC network model of mammalian nuclear organization during human myelopoiesis irrespective of profound changes of the global nuclear architecture observed during this differentiation process. According to this model, two spatially co-aligned and functionally interacting active and inactive nuclear compartments (ANC and INC) pervade the nuclear space.

Keywords: Active nuclear compartment; Chromatin density classification; Chromatin domain; Electron microscopy; Interchromatin compartment; Myelopoiesis; Nuclear architecture; Perichromatin region; Somatic cell differentiation; Super-resolution microscopy.


Figures

Fig. 1
Fig. 1
3D-SIM recorded chromatin landscapes of nuclei representing various myelopoietic differentiation stages. Upper left panel allocation of the analyzed cell types (framed) within the myeloid differentiation pathway. Remaining panels representative xy mid-sections of DAPI stained nuclei recorded with 3D-SIM, exemplifying the transforming global nuclear landscapes during myeloid cell differentiation. A network of chromatin domain clusters (CDCs) permeated by finely branched IC channels is seen in progenitor and precursor cells. Monocytes are characterized by compacted chromatin islets formed by tight aggregations of CDCs embedded within wide IC channels. Granulocytes show a rather uniformly arranged compacted chromatin layer at the nuclear periphery around a central IC lacuna. Arrows in inset magnification point to few decondensed chromatin sites expanding from the compact chromatin layer. Scale bars 2 µm, insets 0.5 µm
Fig. 2
Fig. 2
IC channels and nuclear pores. a upper and mid panel: In all studied cell types IC channels penetrate peripheral (hetero)chromatin toward the nuclear envelope (arrows) as shown in vertical (yz) sections of 3D-SIM acquisitions. Bottom panel xy mid-sections from the respective nuclei for comparison. b surface rendering of 3D reconstructions (Amira) of the same nuclei shown in (a) reveal small “chromatin holes” mirroring exit point of IC channels (nuclear pores, [23, 24]) at the nuclear envelope. Scale bars 2 µm, insets 0.5 µm
Fig. 3
Fig. 3
Chromatin landscapes of nuclei of various myelopoietic differentiation stages visualized by TEM in osmium ammine B stained physical sections and assessment of the chromatin/IC interface length. a A transition from a fine network of CDCs/IC channels toward a dense and more lump-like pattern was observed with progressive myeloid differentiation. b Thresholded masks for the delineation of osmium ammine B stained chromatin (pink) and the IC (gray) in the respective sections. Scale bars 2 µm, insets 0.5 µm. c The interface length between the thresholded chromatin and the IC is reduced in differentiated cell types (1 progenitor; 2 monoblast; 3 myeloblast; 4 monocyte; 5 granulocyte). n Number of analyzed nuclei; error bars standard deviation; p < 0.001 for monocytes and granulocytes versus respective precursors and progenitors
Fig. 4
Fig. 4
Topological chromatin density mapping of differentiating myelopoietic cell nuclei. a Upper panel: DAPI stained mid-sections of representative nuclei acquired by 3D-SIM. Mid panel same sections after chromatin density classification, based on seven DAPI intensity classes, are displayed in false colors, ranging from class 1 (blue) representing pixels close to background intensity, largely reflecting the interchromatin compartment (IC), up to class 7 (white) representing pixels with highest density. Bottom panel inset magnifications in progenitors, monoblasts and myeloblasts (precursors) reveal a loosely arranged network of small chromatin domain clusters (CDCs) comprising a compacted core part (classes 5–6/7) and a surrounding low-density layer (class 2–4), the perichromatin region. Largely DNA-free class 1 regions meander between CDCs as part of the IC system. Monocytes are characterized by closed up CDCs forming larger islets, surrounded by a decondensed perichromatin layer (classes 2–3). In the lobed granulocyte nucleus, an extended class 1 region, representing the large IC lacuna in the interior of each lobe is lined by a small rim of decondensed chromatin (classes 2–4) at the interface with the highly compacted peripheral chromatin layer (classes 5–7). b classification scheme. c relative 3D signal distributions of the DAPI intensity classes for each cell type. Note the shift toward higher intensity classes with progressing differentiation but similar values for class 1 despite profoundly different nuclear landscapes. n Number of analyzed nuclei; error bars standard deviation
Fig. 5
Fig. 5
Comparative topology of H3K4me3 and RNA Pol II Ser2P, markers for transcriptionally permissive/active chromatin in relation to chromatin density maps. a 3D-SIM light optical mid-sections from 3D acquisitions of whole nuclei and representative inset magnifications delineating DAPI stained DNA (gray), immuno-stained H3K4me3 (green) and RNA Pol II Ser2P (red). All cell types show a preferential localization of H3K4me3 and RNA Pol II Ser2P at decondensed chromatin sites or at the surface of compacted chromatin domain clusters. Scale bars 2 µm; insets 0.5 µm. b graphs highlighted with yellow background: relative signal distribution of H3K4me3 (green) and RNA Pol II Ser2P (red) within respective DAPI defined DNA intensity classes. p < 0.001 for DAPI vs. H3K4me3 and RNA Pol II Ser2P in all cell types. Graphs highlighted with light-blue background quantified levels of relative enrichment (positive values) or depletion (negative values) of H3K4me3 (green) and RNA Pol II Ser2P (red) signals relative to the classified DAPI signals. All cell types show a similar profile with a distinct overrepresentation of both markers in low chromatin density classes and a corresponding underrepresentation in high density classes. Note the stronger enrichment of RNA Pol II Ser2P compared to H3K4me3 in class 1 (IC compartment). n Number of analyzed nuclei; error bars standard deviation
Fig. 6
Fig. 6
Comparative topology of SC35 and RNA Pol II Ser2P, markers for transcriptional activity in relation to chromatin density maps. a 3D-SIM light optical mid-sections from whole 3D acquisitions of nuclei and representative inset magnifications delineating DAPI stained DNA (gray), immuno-stained SC35 (green) and RNA Pol II Ser2P (red). SC35, an integral part of splicing speckles, is seen almost exclusively in the IC compartment, while RNA Pol II Ser2P shows a preferential localization at decondensed chromatin sites or at the surface of compacted chromatin domain clusters (compare Fig. 5). Scale bars 2 µm; insets 0.5 µm b graphs highlighted with yellow background: relative signal distribution of SC35 (green) and RNA Pol II Ser2P (red) within respective DAPI defined DNA intensity classes. Graphs highlighted with light-blue background quantified levels of relative enrichment (positive values) or depletion (negative values) of SC35 (green) and RNA Pol II Ser2P (red) signals relative to the DAPI signals confirm the massive enrichment of SC35 signals in class 1 reflecting the IC compartment. n Number of analyzed nuclei; error bars standard deviation; p < 0.001 for DAPI vs. SC35 and RNA Pol II Ser2P, and for SC35 vs. RNA Pol II Ser 2P
Fig. 7
Fig. 7
Comparative topology of H3K9me3, a global marker for transcriptionally repressed (hetero)chromatin and H3K4me3 in relation to chromatin density maps. a 3D-SIM light optical mid-sections from whole 3D acquisitions of nuclei and representative inset magnifications delineating DAPI stained DNA (gray), immuno-stained H3K4me3 (green) and H3K9me3 (red). H3K4me3 marks decondensed chromatin sites and lines compacted CDCs (compare Fig. 5). H3K9me3 marks highly compacted chromatin clusters but is also seen at decondensed sites (arrows). Scale bars 2 µm; insets 0.5 µm. b Graphs highlighted with yellow background relative signal distribution of H3K4me3 (green) and H3K9me3 (red) within respective DAPI defined DNA intensity classes. p < 0.001 for DAPI vs. H3K4me3 and H3K4me3 vs. H3K9me3. Graphs highlighted with light-blue background quantified levels of relative enrichment (positive values) or depletion (negative values) of H3K4me3 (green) and H3K9me3 (red) signals relative to DAPI signals reveal a relative depletion of H3K9me3 signals in classes 1 and 2 in undifferentiated cells (progenitors and precursors) and a relative enrichment of H3K9me3 signals in classes 6 and 7 in monocytes. In both cases the signals are distributed similar to the DAPI intensity classified distributions for the remaining classes. n Number of analyzed nuclei; error bars standard deviation
Fig. 8
Fig. 8
Decrease of RNA Pol II Ser2P/Ser5P signals during myelopoiesis. Quantification of both the number of pixels (upper graph) and of spots (see “Methods” part, lower graph) reveals a distinct decrease of RNA Pol II Ser2P and Ser5P during differentiation, in particular in granulocytes. n number of analyzed nuclei; error bars standard deviation
Fig. 9
Fig. 9
Reversible decondensation of chromatin in myelopoietic cells triggered by hypotonic conditions. a Live cell observation of granulocytes with Hoechst33342 stained DNA recorded by spinning disc LSM during repeated circles of normotonic (270 mOsm) and hypotonic (90 mOsm) conditions. The compacted chromatin rim surrounding large interior IC lacunae is seen under normotonic conditions (0 min). Within <1 min in hypotonic conditions a nuclear phenotype appears with (decondensed) chromatin expanding into the IC lacunae. This effect is reversible upon restoring normotonic conditions (2 min) and can be repeated over several cycles (7 and 8 min). Scale bar 10 µm. b comparison of representative myelopoietic cell nuclei seen under normotonic (upper panel) and hypotonic conditions (lower panel) in osmium ammine B stained TEM sections. Inset magnifications of hypotonic TEM sections demonstrate a similar, rather even distribution of (decondensed) chromatin throughout the nucleus in all cell types, with loss of larger IC channels and IC lacunae, in particular evident in monocytes and granulocytes. Scale bars 2 µm; insets 0.5 µm. c left panel: Different staining intensities after simultaneous DNA staining of granulocytes fixed after 30 s incubation in hypotonic conditions with DAPI (red) and 7-AAD (green). 7-AAD (high affinity to GC-rich regions) denotes the lobe interior while DAPI (high affinity to AT-rich regions) strongly stains the peripheral rim. This radial divergence of the two dyes illustrates a preferential expansion of GC enriched (gene dense) DNA segments toward the nuclear interior. z-projections of 400 nm axial distance are shown. Right panel 3D distance measurements of DAPI (red) and 7-AAD (green) signals to the nuclear border of granulocyte lobes confirm their significantly distinct radial distribution (p < 0.001, assessed by Mann–Whitney rank sum test). The ordinate denotes the normalized sum of voxel intensities for a respective fluorochrome, the abscissa the relative distance to the nuclear border. n number of analyzed nuclei; error bars standard error of means
Fig. 10
Fig. 10
Distinct radial positioning of gene-poor and gene-dense segments of chromosomes 1 and 12 with regard to the border of granulocyte nuclear lobes. a ideograms of chromosomes 1 and 12 with regional gene density (left bar). Localization of individual BAC clones representing either gene-dense (green) or gene-poor segments (red) used in this study is marked by an asterisk. b left panel: respective 2D-FISH control experiments with the expected banded pattern on metaphase chromosomes; right panel: z-projections of 3D-FISH experiments. c 3D measurements for the distance distributions of signals delineating gene-dense (green) and gene-poor (red) segments, respectively, reveal their significantly distinct radial distribution both for chromosome 1 (top) and for chromosome 12 (bottom); (p < 0.005 for both curves, assessed by Mann–Whitney rank sum test). The ordinate denotes the normalized sum of voxel intensities for a respective fluorochrome, the abscissa the relative distance to the nuclear border. Nuclear counterstain (DAPI) is denoted in blue. n number of analyzed nuclei; error bars standard error of means

References

    1. Tashiro S, Lanctot C. The International Nucleome Consortium. Nucleus 2015;1–4. - PMC - PubMed
    1. Markaki Y, Gunkel M, Schermelleh L, Beichmanis S, Neumann J, et al. Functional nuclear organization of transcription and DNA replication: a topographical marriage between chromatin domains and the interchromatin compartment. Cold Spring Harb Symp Quant Biol. 2010;75:475–492. doi: 10.1101/sqb.2010.75.042. - DOI - PubMed
    1. Markaki Y, Smeets D, Fiedler S, Schmid VJ, Schermelleh L, et al. The potential of 3D-FISH and super-resolution structured illumination microscopy for studies of 3D nuclear architecture: 3D structured illumination microscopy of defined chromosomal structures visualized by 3D (immuno)-FISH opens new perspectives for studies of nuclear architecture. Bioessays. 2012;34:412–426. doi: 10.1002/bies.201100176. - DOI - PubMed
    1. Rouquette J, Genoud C, Vazquez-Nin GH, Kraus B, Cremer T, et al. Revealing the high-resolution three-dimensional network of chromatin and interchromatin space: a novel electron-microscopic approach to reconstructing nuclear architecture. Chromosome Res. 2009;17:801–810. doi: 10.1007/s10577-009-9070-x. - DOI - PubMed
    1. Smeets D, Markaki Y, Schmid VJ, Kraus F, Tattermusch A, et al. Three-dimensional super-resolution microscopy of the inactive X chromosome territory reveals a collapse of its active nuclear compartment harboring distinct Xist RNA foci. Epigenetics Chromatin. 2014;7:8. doi: 10.1186/1756-8935-7-8. - DOI - PMC - PubMed

LinkOut - more resources