

Transcranial magnetic stimulation to understand pathophysiology and as potential treatment for neurodegenerative diseases
- PMID: 26579223
- PMCID: PMC4647804
- DOI: 10.1186/s40035-015-0045-x
Transcranial magnetic stimulation to understand pathophysiology and as potential treatment for neurodegenerative diseases
Abstract
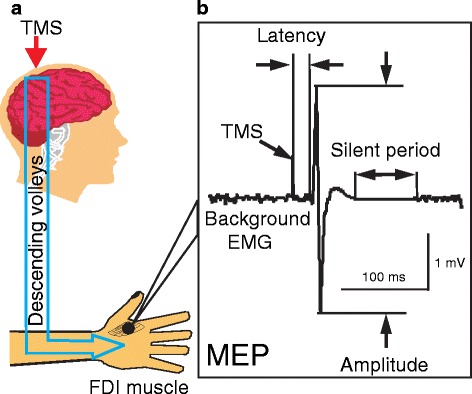
Common neurodegenerative diseases include Parkinson's disease (PD), Alzheimer's disease (AD), amyotrophic lateral sclerosis (ALS) and Huntington's disease (HD). Transcranial magnetic stimulation (TMS) is a noninvasive and painless method to stimulate the human brain. Single- and paired-pulse TMS paradigms are powerful ways to study the pathophysiological mechanisms of neurodegenerative diseases. Motor evoked potential studied with single-pulse TMS is increased in PD, AD and ALS, but is decreased in HD. Changes in motor cortical excitability in neurodegenerative diseases may be related to functional deficits in cortical circuits or to compensatory mechanisms. Reduction or even absence of short interval intracortical inhibition induced by paired-pulse TMS is common in neurodegenerative diseases, suggesting that there are functional impairments of inhibitory cortical circuits. Decreased short latency afferent inhibition in AD, PD and HD may be related to the cortical cholinergic deficits in these conditions. Cortical plasticity tested by paired associative stimulation or theta burst stimulation is impaired in PD, AD and HD. Repetitive TMS (rTMS) refers to the application of trains of regularly repeating TMS pulses. High-frequency facilitatory rTMS may improve motor symptoms in PD patients whereas low-frequency inhibitory stimulation is a potential treatment for levodopa induced dyskinesia. rTMS delivered both to the left and right dorsolateral prefrontal cortex improves memory in AD patients. Supplementary motor cortical stimulation in low frequency may be useful for HD patients. However, the effects of treatment with multiple sessions of rTMS for neurodegenerative diseases need to be tested in large, sham-controlled studies in the future before they can be adopted for routine clinical practice.
Keywords: Alzheimer’s disease; Amyotrophic lateral sclerosis; Huntington’s disease; Parkinson’s disease; Transcranial magnetic stimulation.
Figures
Similar articles
-
Improvement of motor performance and modulation of cortical excitability by repetitive transcranial magnetic stimulation of the motor cortex in Parkinson's disease.Clin Neurophysiol. 2004 Nov;115(11):2530-41. doi: 10.1016/j.clinph.2004.05.025. Clin Neurophysiol. 2004. PMID: 15465443 Clinical Trial.
-
Noninvasive brain stimulation in Huntington's disease.Handb Clin Neurol. 2013;116:555-60. doi: 10.1016/B978-0-444-53497-2.00044-9. Handb Clin Neurol. 2013. PMID: 24112923 Review.
-
Motor cortical excitability studied with repetitive transcranial magnetic stimulation in patients with Huntington's disease.Clin Neurophysiol. 2006 Aug;117(8):1677-81. doi: 10.1016/j.clinph.2006.04.012. Epub 2006 Jun 21. Clin Neurophysiol. 2006. PMID: 16793338
-
Effects of theta burst stimulation on motor cortex excitability in Parkinson's disease.Clin Neurophysiol. 2012 Apr;123(4):815-21. doi: 10.1016/j.clinph.2011.07.051. Epub 2011 Sep 25. Clin Neurophysiol. 2012. PMID: 21945152
-
Utility of transcranial magnetic stimulation in delineating amyotrophic lateral sclerosis pathophysiology.Handb Clin Neurol. 2013;116:561-75. doi: 10.1016/B978-0-444-53497-2.00045-0. Handb Clin Neurol. 2013. PMID: 24112924 Review.
Cited by
-
Nanoparticles for Stem Cell Tracking and the Potential Treatment of Cardiovascular Diseases.Front Cell Dev Biol. 2021 Jul 2;9:662406. doi: 10.3389/fcell.2021.662406. eCollection 2021. Front Cell Dev Biol. 2021. PMID: 34277609 Free PMC article. Review.
-
Repetitive Transcranial Magnetic Stimulation (rTMS) Improves the Gait Disorders of Rats Under Simulated Microgravity Conditions Associated With the Regulation of Motor Cortex.Front Physiol. 2021 Feb 4;12:587515. doi: 10.3389/fphys.2021.587515. eCollection 2021. Front Physiol. 2021. PMID: 33613305 Free PMC article.
-
Utility of transcranial magnetic stimulation in the assessment of spinal cord injury: Current status and future directions.Front Rehabil Sci. 2022 Oct 5;3:1005111. doi: 10.3389/fresc.2022.1005111. eCollection 2022. Front Rehabil Sci. 2022. PMID: 36275924 Free PMC article. Review.
-
Motor cortex excitability is reduced during freezing of upper limb movement in Parkinson's disease.NPJ Parkinsons Dis. 2022 Nov 23;8(1):161. doi: 10.1038/s41531-022-00420-w. NPJ Parkinsons Dis. 2022. PMID: 36424411 Free PMC article.
-
Targeting neural correlates of placebo effects.Cogn Affect Behav Neurosci. 2023 Apr;23(2):217-236. doi: 10.3758/s13415-022-01039-3. Epub 2022 Dec 14. Cogn Affect Behav Neurosci. 2023. PMID: 36517733 Review.
References
-
- The Huntington's Disease Collaborative Research Group (MacDonald ME, et al.) A novel gene containing a trinucleotide repeat that is expanded and unstable on Huntington's disease chromosomes. Cell. 1993. 72:971–83. - PubMed
Publication types
LinkOut - more resources
Full Text Sources
Other Literature Sources
Miscellaneous
