. 2015 Oct 29:5:244.
doi: 10.3389/fonc.2015.00244. eCollection 2015.

Putative Breast Cancer Driver Mutations in TBX3 Cause Impaired Transcriptional Repression

Affiliations

Putative Breast Cancer Driver Mutations in TBX3 Cause Impaired Transcriptional Repression

Kathrin Fischer et al. Front Oncol. .

Abstract

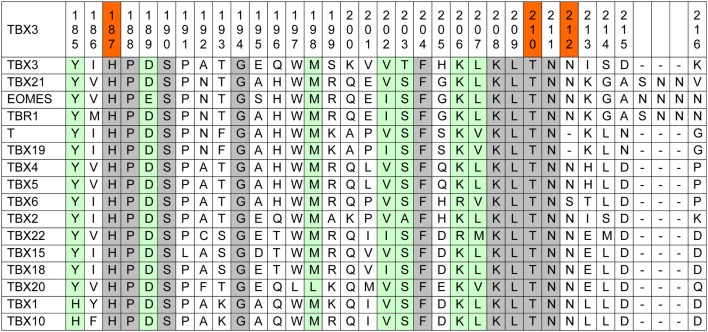
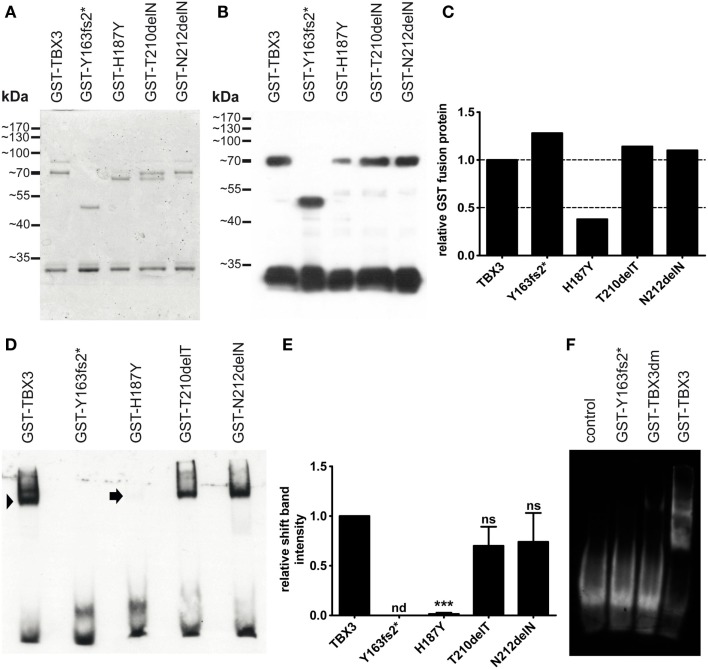
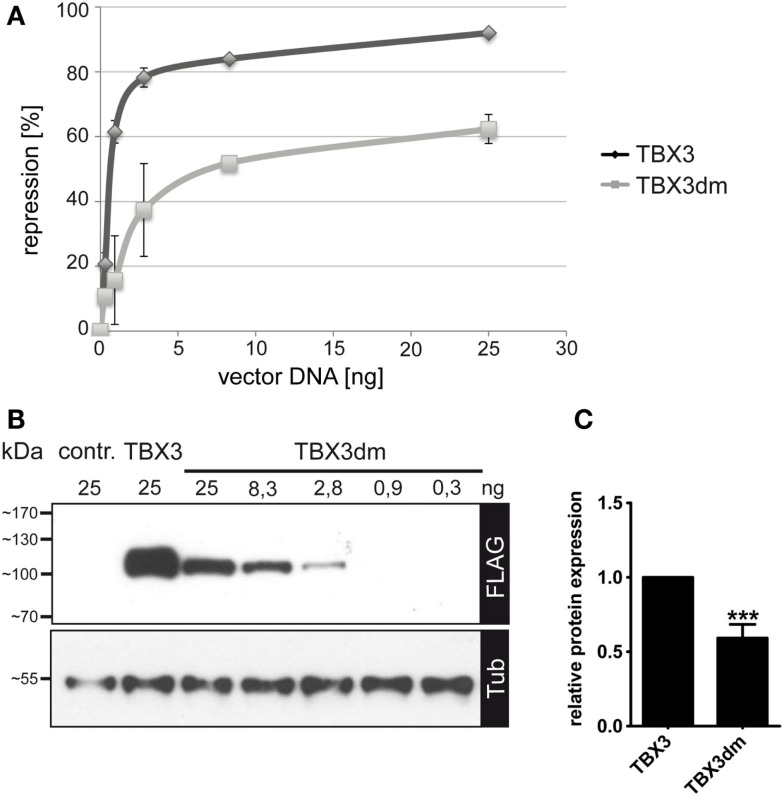
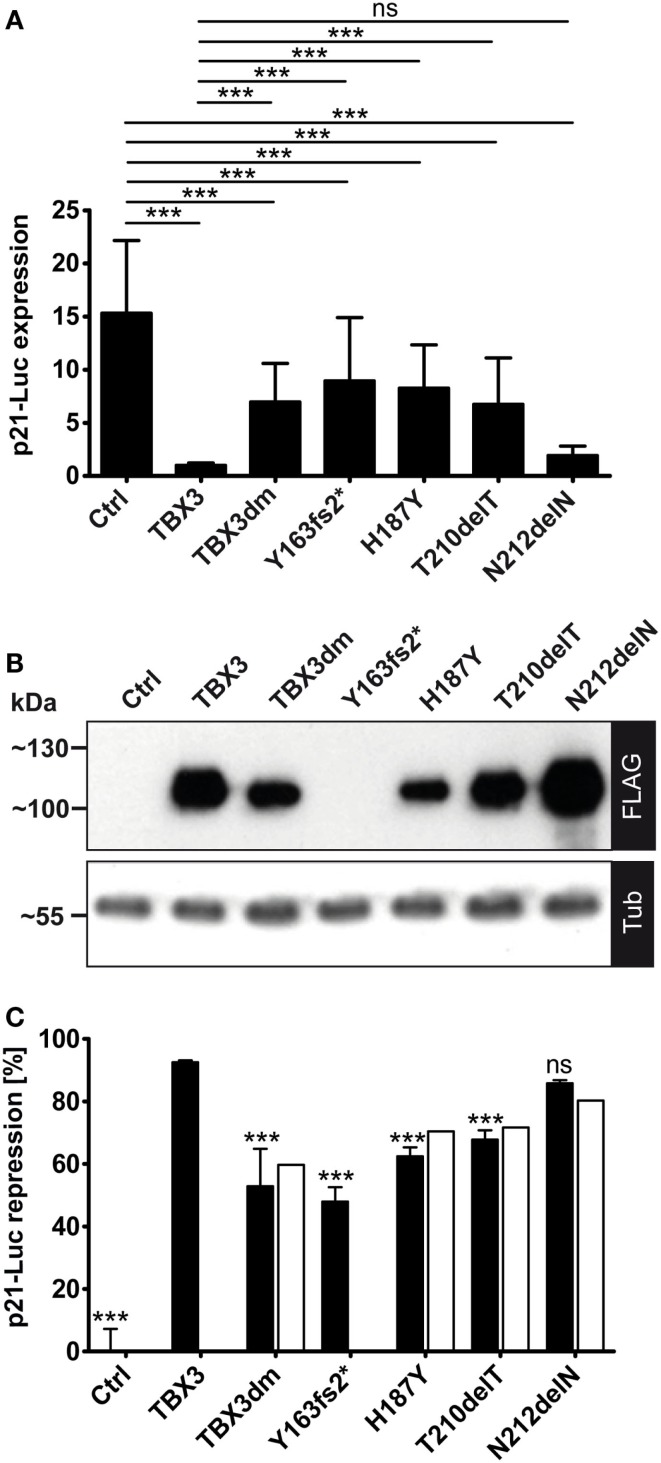
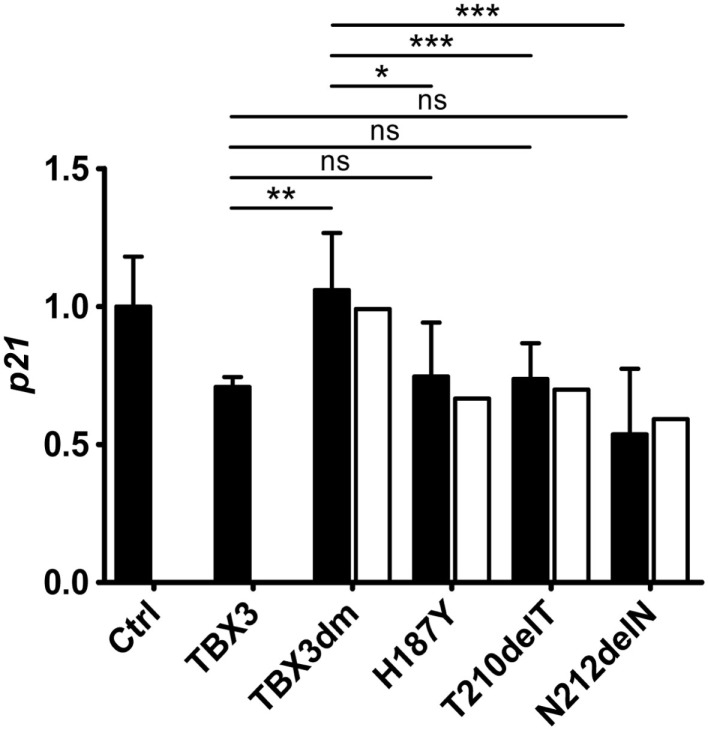
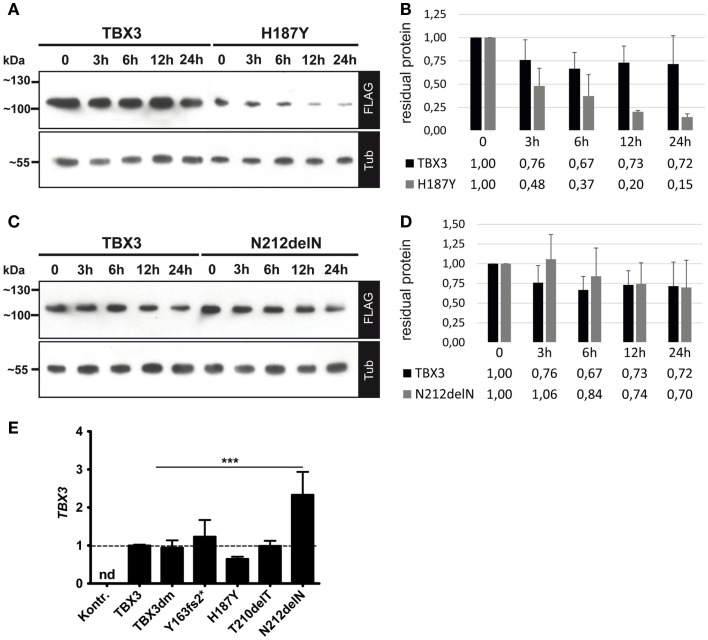
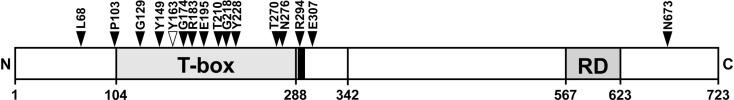
The closely related T-box transcription factors TBX2 and TBX3 are frequently overexpressed in melanoma and various types of human cancers, in particular, breast cancer. The overexpression of TBX2 and TBX3 can have several cellular effects, among them suppression of senescence, promotion of epithelial-mesenchymal transition, and invasive cell motility. In contrast, loss of function of TBX3 and most other human T-box genes causes developmental haploinsufficiency syndromes. Stephens and colleagues (1), by exome sequencing of breast tumor samples, identified five different mutations in TBX3, all affecting the DNA-binding T-domain. One in-frame deletion of a single amino acid, p.N212delN, was observed twice. Due to the clustering of these mutations to the T-domain and for statistical reasons, TBX3 was inferred to be a driver gene in breast cancer. Since mutations in the T-domain generally cause loss of function and because the tumorigenic action of TBX3 has generally been attributed to overexpression, we determined whether the putative driver mutations had loss- or gain-of-function properties. We tested two in-frame deletions, one missense, and one frameshift mutant protein for DNA-binding in vitro, and for target gene repression in cell culture. In addition, we performed an in silico analysis of somatic TBX mutations in breast cancer, collected in The Cancer Genome Atlas (TCGA). Both the experimental and the in silico analysis indicate that the observed mutations predominantly cause loss of TBX3 function.

Keywords: TBX3; breast cancer; driver mutation; frameshift mutation; in-frame deletion; p21; somatic mutations.


Figures

Figure 1
Figure 1
Human TBX proteins in alignment with TBX3. About one-sixth of the T-box, containing the mutations under consideration, is shown (TBX3 from 185 to 216). The complete TBX3 T-box encompasses residues 104–288 (66). Fully conserved amino acids are marked gray and T-box positions containing similar amino acids are green. In the top line, the three investigated mutations are marked red.
Figure 2
Figure 2
Bacterial expression and DNA binding of mutant TBX3 proteins. (A) GST-TBX3 protein variants after purification by glutathione affinity chromatography. Equal amounts of peak eluate protein were separated on a 10% SDS gel and stained with Coomassie Blue. Normal and point mutant protein fractions yielded a full-length band of 70 kDa [calculated molecular weight of the GST-TBX3(1–342) fusion protein is 65.4 kDa] and a band with ~30 kDa mobility. GST-TBX3(fs163fs2*) migrated with the expected mobility of ~48 kDa. (B) Anti-GST Western blot. A gel as shown in (A) was blotted and probed with anti-GST. Both the 70 and the 30-kDa band reacted with the antibody. Additional bands visible in the Coomassie-stained gel between 65 and 80 kDa were not immunoreactive. (C) Quantification of fusion band expression of the blot shown in (B). (D) Electrophoretic mobility shift assay of GST-TBX3 protein variants. Equal amounts of fusion protein as determined in (C) were employed. The GST-TBX3(1–342) wildtypic fusion protein effectively shifted the consensus T-box binding element oligonucleotide (arrowhead), the point mutant derivatives T210delT and N212delN were slightly less efficient, H187Y yielded only a faint signal (arrow). (E) Quantification of shift-band intensity. The amount of oligonucleotide shifted by TBX3 was set to 1 (n = 4). (n = not detected, ns = not significant) (F) EMSA comparison of p.Y163fs2* and the negative control mutant TBX3dm. Control is shift oligonucleotide alone.
Figure 3
Figure 3
Repression of p21-Luc reporter by TBX3 and the DNA binding-deficient mutant TBX3dm. (A) Comparison of p21-Luc repression by TBX3 and TBX3dm in transfected COS-7 cells. In all assays, a total of 25 ng of the expression vector was used, with a varying ratio of empty to TBX vector. In the control, 25 ng of empty expression vector was transfected. Repression of the p21-Luc reporter was measured at six different concentrations of TBX3 or TBX3dm. Luc activity in the absence of TBX3 was defined as 0 repression (n = 3). (B) Comparison of TBX3 and TBX3dm expression. TBX3dm expression is shown in a dilution series of its expression vector. Protein expression was visualized by Western blot of cell extract and FLAG immunodetection. Protein load was controlled with anti-alpha-tubulin. (C) Relative expression of TBX3 and TBX3dm. COS-7 cells were transfected with 25 ng expression vector (n = 6).
Figure 4
Figure 4
Repression of a p21-Luc reporter by TBX3 and mutant derivatives. (A) The repression of the p21-Luc reporter was measured with 25 ng of expression vector encoding the normal or mutant TBX3 proteins. For control, empty expression vector was transfected. Luc expression is in arbitrary units. The Luc data from six independent experiments were normalized to TBX3 (=1). Average and SD are shown. TBX3dm, Y163fs2*, H187Y, and T210delT were significantly weaker repressors than normal TBX3 but also differed significantly from control. The mutant N212delN did not differ significantly from normal TBX3; hence, was an effective repressor. (B) Quantification of protein expression. Protein expression was visualized by Western blot of cell extract and FLAG immunodetection. Protein load was controlled with anti-alpha-tubulin. (C) Normalization of Luc repression by TBX3 and mutant derivatives to their respective protein concentration. The luciferase activity values of one experiment, for which the protein expression data are shown in (B), were normalized to the control (=100%). To obtain repression data, these values were subtracted from 100 (0% repression in the control) and shown as black columns (error bars are SD, n = 6 technical replicates). The values after normalization to the different protein levels (see Materials and Methods) are presented by white columns.
Figure 5
Figure 5
Repression of the endogenous p21 gene by TBX3 and mutant derivatives. COS-7 cells were transfected with 50 ng of expression vector encoding TBX3 or its mutants (the empty vector was transfected in the control experiment). RNA was isolated and the level of p21 transcripts was determined by real-time qPCR. The p21 level is normalized to the control (1.0, black columns, error bars are SDs, n = 3 with three technical replicates each). To correct for differences in the amount of TBX protein, an adjustment was performed as described in Section “Materials and Methods” (white columns). Only TBX3dm differed significantly in p21 repression from normal TBX3, the three single mutants did not.
Figure 6
Figure 6
Protein stability and transcript abundance of TBX3 and mutant derivatives. COS-7 cells were transfected with 50 ng of expression vector encoding TBX3 or its mutants. Twenty-four hours after transfection cycloheximide (CHX) was added to 25 μg/ml. Cells were lysed at the indicated time points. Protein level was quantified by Western blot of cell extract and FLAG bioluminescence immunodetection. Protein load was controlled with anti-alpha-tubulin. (A,B) TBX3 and H187Y, (C,D) TBX3 and N212delN. (E) Quantification of TBX3 transcript levels by real time qPCR. COS-7 cells were transfected with 25 ng of expression vector encoding TBX3 or its mutants (the empty vector was transfected in the control experiment). RNA was isolated 48 h after transfection and analyzed. The data are normalized to TBX3. No TBX3 transcription was detected (nd) in cells transfected with empty vector. The higher level of N212delN RNA relative to normal TBX3 was statistically significant (n = 3).
Figure 7
Figure 7
Position of TBX3 frameshift mutations in breast cancer. The position of 16 somatic frameshift mutations identified in primary breast cancer tumors is indicated on a schematic drawing of TBX3 [723 amino acids (aa)]. The positions of the T-box, the nuclear localization sequence [290–295 aa, black bar adjacent to T-box (35)], and the C-terminal repression domain (35) are shown as gray boxes. Fifteen of 16 mutations cluster in the N-terminal half of the protein, most of them in the T-box.

Similar articles

Cited by

References

    1. Stephens PJ, Tarpey PS, Davies H, Van Loo P, Greenman C, Wedge DC, et al. The landscape of cancer genes and mutational processes in breast cancer. Nature (2012) 486(7403):400–4.10.1038/nature11017 - DOI - PMC - PubMed
    1. Stratton MR, Campbell PJ, Futreal PA. The cancer genome. Nature (2009) 458(7239):719–24.10.1038/nature07943 - DOI - PMC - PubMed
    1. Vogelstein B, Papadopoulos N, Velculescu VE, Zhou S, Diaz LA, Jr, Kinzler KW. Cancer genome landscapes. Science (2013) 339(6127):1546–58.10.1126/science.1235122 - DOI - PMC - PubMed
    1. Hoek K, Rimm DL, Williams KR, Zhao H, Ariyan S, Lin A, et al. Expression profiling reveals novel pathways in the transformation of melanocytes to melanomas. Cancer Res (2004) 64(15):5270–82.10.1158/0008-5472.CAN-04-0731 - DOI - PubMed
    1. Vance KW, Carreira S, Brosch G, Goding CR. Tbx2 is overexpressed and plays an important role in maintaining proliferation and suppression of senescence in melanomas. Cancer Res (2005) 65(6):2260–8.10.1158/0008-5472.CAN-04-3045 - DOI - PubMed

LinkOut - more resources