. 2016 Feb;278(2):563-77.
doi: 10.1148/radiol.2015151169. Epub 2015 Nov 18.

Radiomics: Images Are More than Pictures, They Are Data

Affiliations

Radiomics: Images Are More than Pictures, They Are Data

Robert J Gillies et al. Radiology. 2016 Feb.

Abstract

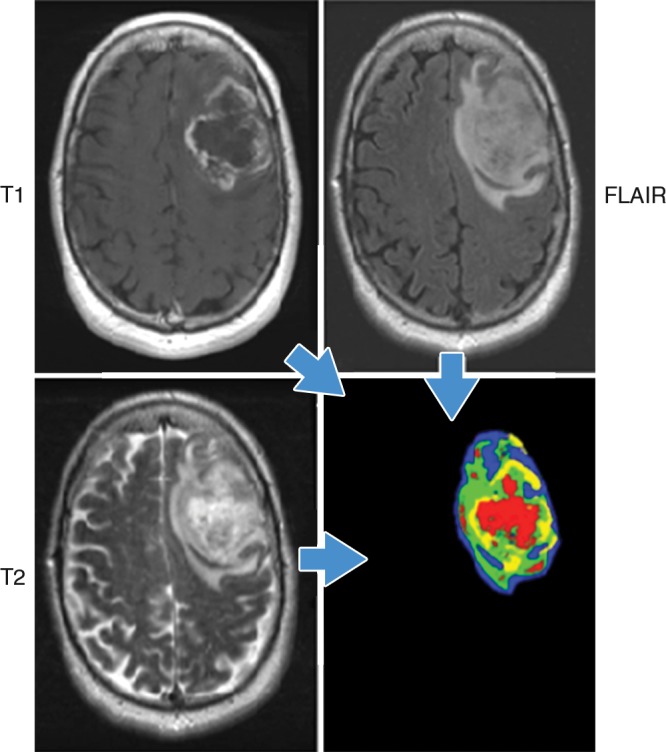
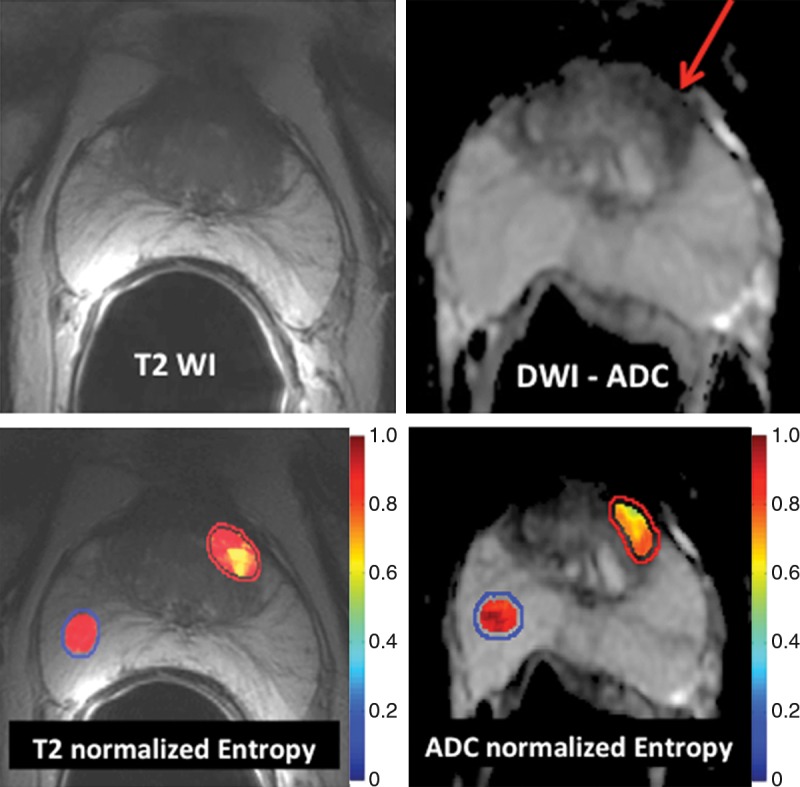
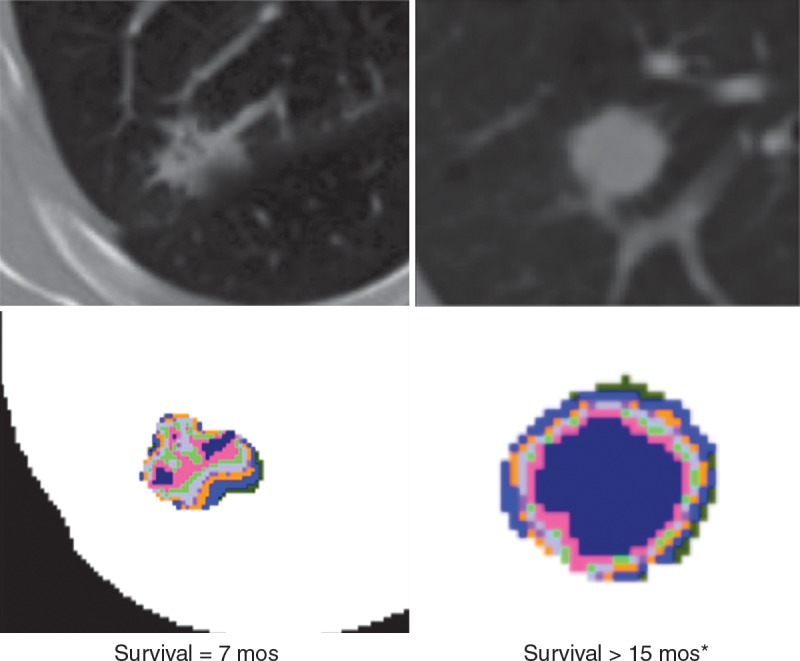
In the past decade, the field of medical image analysis has grown exponentially, with an increased number of pattern recognition tools and an increase in data set sizes. These advances have facilitated the development of processes for high-throughput extraction of quantitative features that result in the conversion of images into mineable data and the subsequent analysis of these data for decision support; this practice is termed radiomics. This is in contrast to the traditional practice of treating medical images as pictures intended solely for visual interpretation. Radiomic data contain first-, second-, and higher-order statistics. These data are combined with other patient data and are mined with sophisticated bioinformatics tools to develop models that may potentially improve diagnostic, prognostic, and predictive accuracy. Because radiomics analyses are intended to be conducted with standard of care images, it is conceivable that conversion of digital images to mineable data will eventually become routine practice. This report describes the process of radiomics, its challenges, and its potential power to facilitate better clinical decision making, particularly in the care of patients with cancer.


Figures

Figure 1:
Figure 1:
Flowchart shows the process of radiomics and the use of radiomics in decision support. Patient work-up requires information from disparate sources to be combined into a coherent model to describe where the lesion is, what it is, and what it is doing. Radiomics begins with acquisition of high-quality images. From these images, a region of interest (ROI) that contains either the whole tumor or subregions (ie, habitats) within the tumor can be identified. These are segmented with operator edits and are eventually rendered in three dimensions (3D). Quantitative features are extracted from these rendered volumes to generate a report, which is placed in a database along with other data, such as clinical and genomic data. These data are then mined to develop diagnostic, predictive, or prognostic models for outcomes of interest.
Figure 2:
Figure 2:
Habitats in a patient with glioblastoma multiforme. Habitats were defined by combining unenhanced and contrast-enhanced T1-weighted, 120-msec echo time T2-weighted, and fluid-attenuated inversion recovery (FLAIR) images. Data from each acquisition were sorted into low and high values with automated histogram analyses, yielding a potential for eight different combinations. In practice, only four distinct combinations were observed. They correspond to the red (low T1, high T2 and FLAIR), yellow (low T1 and T2, high FLAIR), blue (High T1 and FLAIR, low T2), and green (high T1, low FLAIR and T2) areas. Notably, while the identities of individual voxels were determined mathematically, they spatially clustered into contiguous regions reflecting different physiologic microenvironments. (Image courtesy of R. A. Gatenby.)
Figure 3:
Figure 3:
Covariance matrix of radiomic features. A total of 219 features were extracted from each non–small cell lung cancer tumor in 235 patients. Across all tumors, each feature was individually compared with all other features by using regression analysis, thereby generating correlation coefficients (R2). Individual features were then clustered and plotted along both axes, and R2 is shown as a heat map, with areas of high correlation (R2 > 0.95) shown in red. Thus, each of the red squares along the diagonal contains a group of features that are highly correlated with one another and are thus redundant. For data analysis, one feature was chosen to be representative of each of these groups. The representative feature chosen was the one that had the highest natural biologic range (interpatient variability) across the entire patient data set, with the explicit assumption that features that show the highest interpatient variability will be the most informative. (Image courtesy of Y. Balagurunathan.)
Figure 4:
Figure 4:
Application of texture analysis to T2-weighted MR images and ADC maps of prostate cancer. A lesion in the transition zone is barely discernible on the T2-weighted image (top left) and has higher conspicuity on the ADC map (top right). Texture features were computed on a per-voxel basis (using a 5 × 5 × 1 pixel window) from manually segmented regions of interest identifying the normal peripheral zone (outlined in blue) and cancer (outlined in red). From the computed texture features, a machine learning method was applied to distinguish between normal and cancerous structures and to stratify the Gleason patterns. Heat map images show clear differences between healthy tissue and cancer and depict intratumoral heterogeneity that may be useful in assessing tumor aggressiveness and informing fused MR imaging–ultrasonography biopsy.
Figure 5:
Figure 5:
Attenuation gradients of lung CT images. Data are representative of patients with (left) and without (right) recurrence after lobectomy. Although differences in texture were visible on the CT images (top), the color-coded attenuation maps (bottom) more dramatically show intratumoral complexity. Maps were generated by separating the attenuation into quartiles, with hotter colors representing higher attenuation.
Figure 6:
Figure 6:
Application of texture analysis to CT images of bladder cancer. On original contrast-enhanced CT image of bladder cancer (top left), a high-attenuation lesion is clearly visible, and there is some evidence of intratumoral heterogeneity. However, when the texture features of energy (top right), entropy (bottom left), and homogeneity (bottom right) are displayed over the source image, intratumoral heterogeneity can be readily appreciated. Other studies have shown that higher intratumoral heterogeneity is associated with a worse prognosis.
Figure 7:
Figure 7:
Application of radiomics to FDG-avid lymph nodes on PET and CT images in a patient with metastatic breast cancer. Left: Standard PET image shows there is little evidence of intranodal heterogeneity. Right: CT image shows calculation and display of the Haralick co-occurrence statistics with a 9 × 9 × 9 voxel matrix and clearly reveals some areas with lower co-occurrence (red), which have higher regional heterogeneity and would therefore be considered more suspicious for cancer. The results were used to select lymph nodes for image-informed biopsy.

Similar articles

Cited by

References

    1. Institute of Medicine I . Evolution of Translational Omics. Lessons learned and the path forward. Washington, DC: National Academies Press, 2012. - PubMed
    1. Giger ML. Update on the potential of computer-aided diagnosis for breast cancer. Future Oncol 2010;6(1):1–4. - PubMed
    1. Doi K. Computer-aided diagnosis in medical imaging: historical review, current status and future potential. Comput Med Imaging Graph 2007;31(4-5):198–211. - PMC - PubMed
    1. Guo Z, Shu Y, Zhou H, Zhang W, Wang H. Radiogenomics helps to achieve personalized therapy by evaluating patient responses to radiation treatment. Carcinogenesis 2015;36(3):307–317. - PubMed
    1. West CM, Barnett GC. Genetics and genomics of radiotherapy toxicity: towards prediction. Genome Med 2011;3(8):52. - PMC - PubMed

Publication types