

Molecular Dynamics Simulations of 441 Two-Residue Peptides in Aqueous Solution: Conformational Preferences and Neighboring Residue Effects with the Amber ff99SB-ildn-NMR Force Field
- PMID: 26579777
- PMCID: PMC4656151
- DOI: 10.1021/ct5010966
Molecular Dynamics Simulations of 441 Two-Residue Peptides in Aqueous Solution: Conformational Preferences and Neighboring Residue Effects with the Amber ff99SB-ildn-NMR Force Field
Abstract
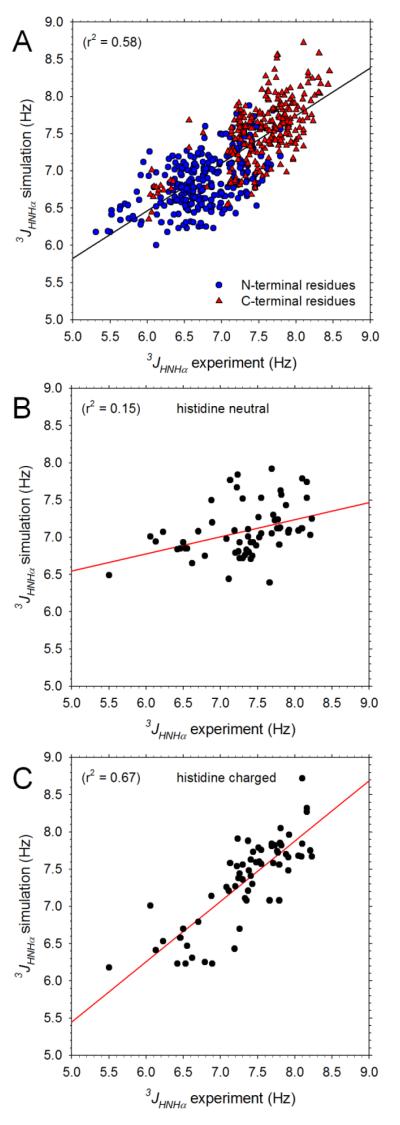
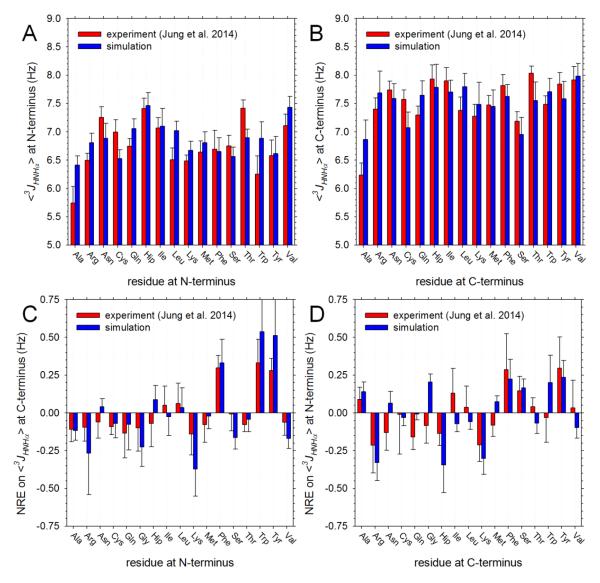
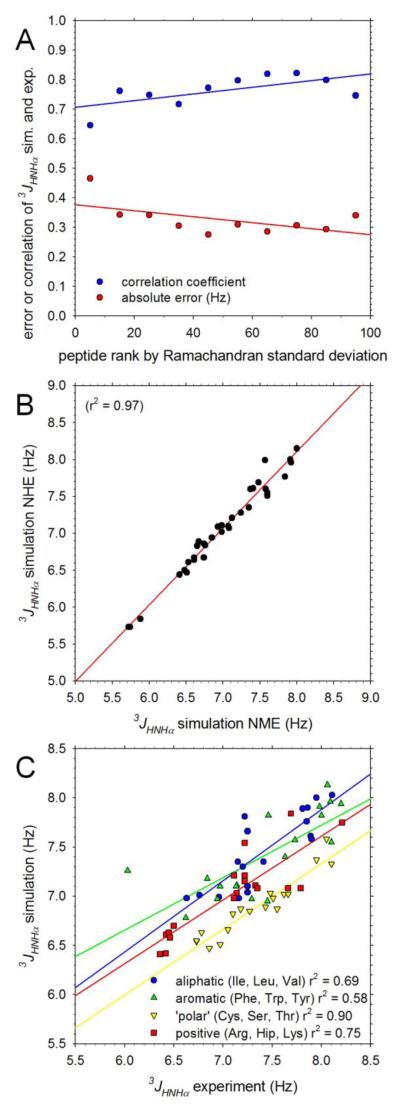
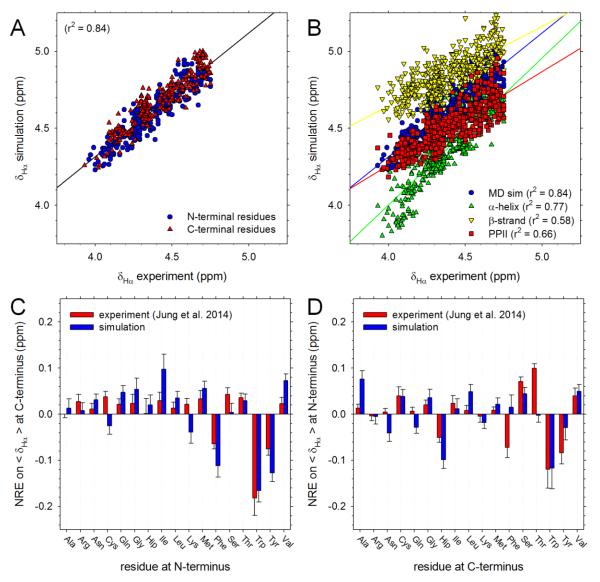
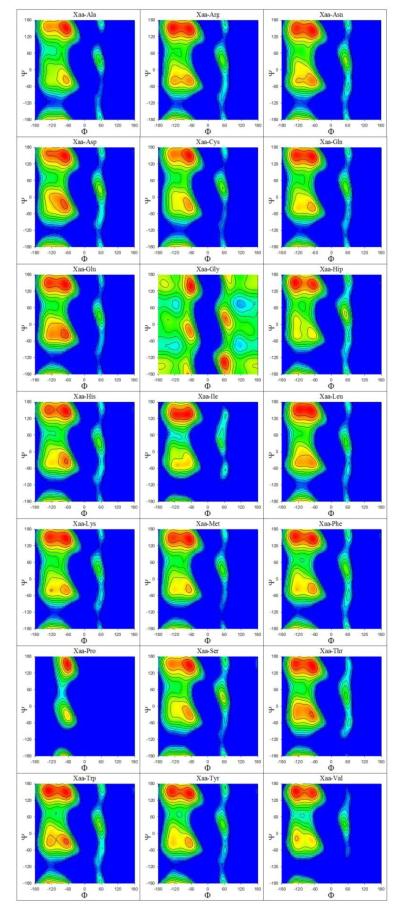
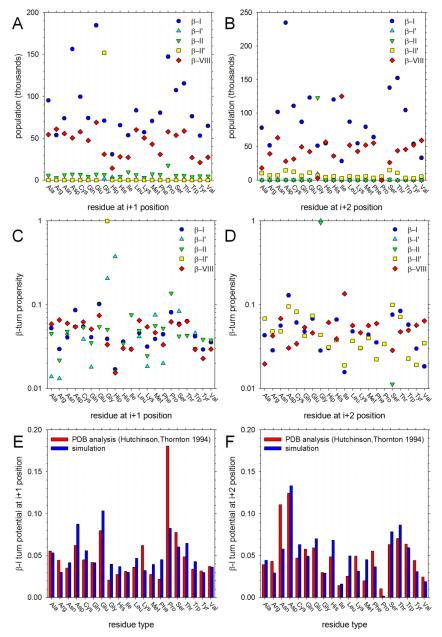
Understanding the intrinsic conformational preferences of amino acids and the extent to which they are modulated by neighboring residues is a key issue for developing predictive models of protein folding and stability. Here we present the results of 441 independent explicit-solvent MD simulations of all possible two-residue peptides that contain the 20 standard amino acids with histidine modeled in both its neutral and protonated states. (3)J(HNHα) coupling constants and δ(Hα) chemical shifts calculated from the MD simulations correlate quite well with recently published experimental measurements for a corresponding set of two-residue peptides. Neighboring residue effects (NREs) on the average (3)J(HNHα) and δ(Hα) values of adjacent residues are also reasonably well reproduced, with the large NREs exerted experimentally by aromatic residues, in particular, being accurately captured. NREs on the secondary structure preferences of adjacent amino acids have been computed and compared with corresponding effects observed in a coil library and the average β-turn preferences of all amino acid types have been determined. Finally, the intrinsic conformational preferences of histidine, and its NREs on the conformational preferences of adjacent residues, are both shown to be strongly affected by the protonation state of the imidazole ring.
Figures


Similar articles
-
Residue-Specific Force Field (RSFF2) Improves the Modeling of Conformational Behavior of Peptides and Proteins.J Phys Chem Lett. 2015 Jun 4;6(11):2127-33. doi: 10.1021/acs.jpclett.5b00654. Epub 2015 May 26. J Phys Chem Lett. 2015. PMID: 26266514 Free PMC article.
-
The intrinsic conformational features of amino acids from a protein coil library and their applications in force field development.Phys Chem Chem Phys. 2013 Mar 14;15(10):3413-28. doi: 10.1039/c2cp43633g. Phys Chem Chem Phys. 2013. PMID: 23385383
-
Influence of side chain conformations on local conformational features of amino acids and implication for force field development.J Phys Chem B. 2010 May 6;114(17):5840-50. doi: 10.1021/jp909088e. J Phys Chem B. 2010. PMID: 20392111
-
Developments and Applications of Coil-Library-Based Residue-Specific Force Fields for Molecular Dynamics Simulations of Peptides and Proteins.J Chem Theory Comput. 2019 May 14;15(5):2761-2773. doi: 10.1021/acs.jctc.8b00794. Epub 2019 Apr 8. J Chem Theory Comput. 2019. PMID: 30620582 Review.
-
Conformational characteristics of peptides containing alpha, beta-dehydroamino acid residues.Biopolymers. 1996;40(1):105-19. doi: 10.1002/(sici)1097-0282(1996)40:1<105::aid-bip5>3.0.co;2-#. Biopolymers. 1996. PMID: 8541443 Review.
Cited by
-
Osmotic Pressure Simulations of Amino Acids and Peptides Highlight Potential Routes to Protein Force Field Parameterization.J Phys Chem B. 2016 Aug 25;120(33):8217-29. doi: 10.1021/acs.jpcb.6b01902. Epub 2016 Apr 21. J Phys Chem B. 2016. PMID: 27052117 Free PMC article.
-
Parametrization of Backbone Flexibility in a Coarse-Grained Force Field for Proteins (COFFDROP) Derived from All-Atom Explicit-Solvent Molecular Dynamics Simulations of All Possible Two-Residue Peptides.J Chem Theory Comput. 2015 May 12;11(5):2341-54. doi: 10.1021/acs.jctc.5b00038. Epub 2015 Apr 30. J Chem Theory Comput. 2015. PMID: 26574429 Free PMC article.
-
Conformational energies of reference organic molecules: benchmarking of common efficient computational methods against coupled cluster theory.J Comput Aided Mol Des. 2023 Dec;37(12):607-656. doi: 10.1007/s10822-023-00513-5. Epub 2023 Aug 19. J Comput Aided Mol Des. 2023. PMID: 37597063 Free PMC article. Review.
-
Residue-Specific Force Field (RSFF2) Improves the Modeling of Conformational Behavior of Peptides and Proteins.J Phys Chem Lett. 2015 Jun 4;6(11):2127-33. doi: 10.1021/acs.jpclett.5b00654. Epub 2015 May 26. J Phys Chem Lett. 2015. PMID: 26266514 Free PMC article.
-
Stacking Free Energies of All DNA and RNA Nucleoside Pairs and Dinucleoside-Monophosphates Computed Using Recently Revised AMBER Parameters and Compared with Experiment.J Chem Theory Comput. 2015 May 12;11(5):2315-28. doi: 10.1021/ct501170h. Epub 2015 Apr 7. J Chem Theory Comput. 2015. PMID: 26574427 Free PMC article.
References
-
- Karplus M, McCammon JA. Molecular dynamics simulations of biomolecules. Nat. Struct. Mol. Biol. 2002;9:646–652. - PubMed
-
- Lange OF, van der Spoel D, de Groot BL. Scrutinizing Molecular Mechanics Force Fields on the Submicrosecond Timescale with NMR Data. Biophys. J. 99:647–655. - PMC - PubMed
- Best RB, Buchete N-V, Hummer G. Are Current Molecular Dynamics Force Fields too Helical? Biophys. J. 2008;95:L07–L09. - PMC - PubMed
- Beauchamp KA, Lin Y-S, Das R, Pande VS. Are Protein Force Fields Getting Better? A Systematic Benchmark on 524 Diverse NMR Measurements. J. Chem. Theory Comput. 2012;8:1409–1414. - PMC - PubMed
-
- Graf J, Nguyen PH, Stock G, Schwalbe H. Structure and Dynamics of the Homologous Series of Alanine Peptides: A Joint Molecular Dynamics/NMR Study. J. Am. Chem. Soc. 2007;129:1179–1189. - PubMed
-
- Hagarman A, Measey TJ, Mathieu D, Schwalbe H, Schweitzer-Stenner R. Intrinsic Propensities of Amino Acid Residues in GxG Peptides Inferred from Amide I′ Band Profiles and NMR Scalar Coupling Constants. J. Am. Chem. Soc. 2009;132:540–551. - PubMed
Publication types
MeSH terms
Substances
Grants and funding
LinkOut - more resources
Full Text Sources
Other Literature Sources