. 2015 Dec 3;528(7580):137-41.
doi: 10.1038/nature16151. Epub 2015 Nov 18.

Depletion of fat-resident Treg cells prevents age-associated insulin resistance

Affiliations

Depletion of fat-resident Treg cells prevents age-associated insulin resistance

Sagar P Bapat et al. Nature. .

Abstract

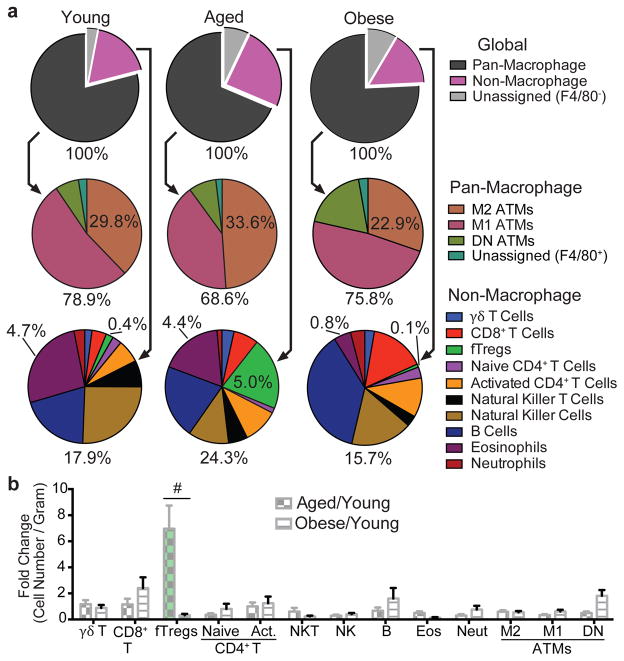
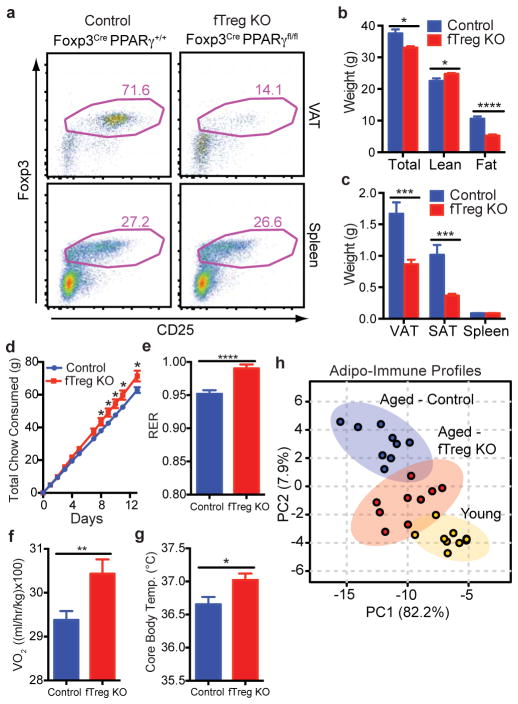
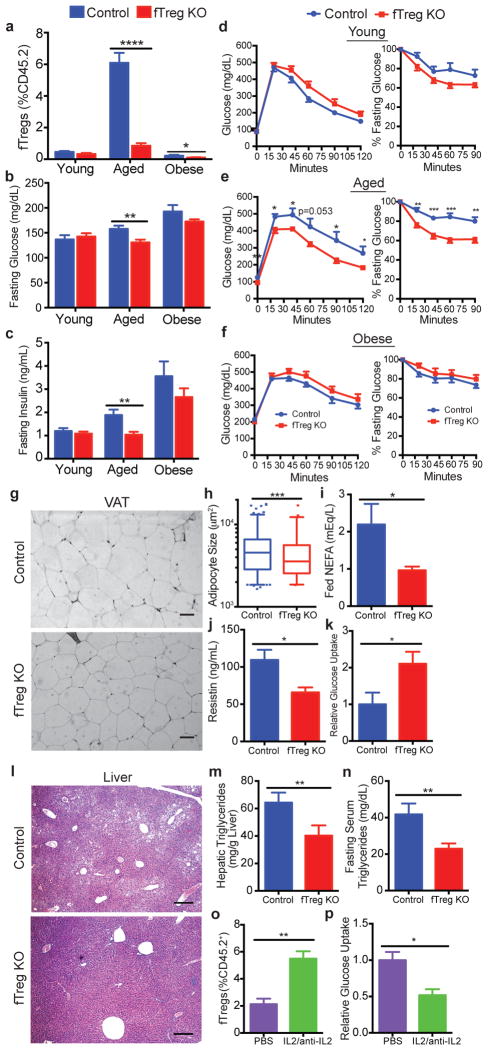
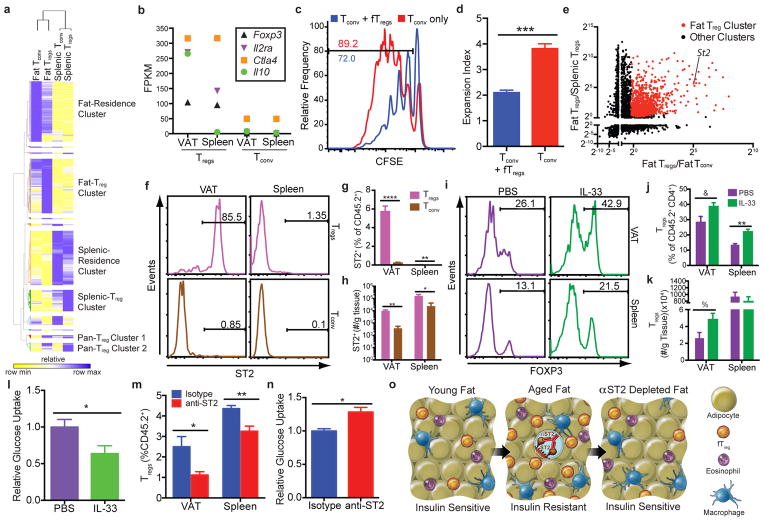
Age-associated insulin resistance (IR) and obesity-associated IR are two physiologically distinct forms of adult-onset diabetes. While macrophage-driven inflammation is a core driver of obesity-associated IR, the underlying mechanisms of the obesity-independent yet highly prevalent age-associated IR are largely unexplored. Here we show, using comparative adipo-immune profiling in mice, that fat-resident regulatory T cells, termed fTreg cells, accumulate in adipose tissue as a function of age, but not obesity. Supporting the existence of two distinct mechanisms underlying IR, mice deficient in fTreg cells are protected against age-associated IR, yet remain susceptible to obesity-associated IR and metabolic disease. By contrast, selective depletion of fTreg cells via anti-ST2 antibody treatment increases adipose tissue insulin sensitivity. These findings establish that distinct immune cell populations within adipose tissue underlie ageing- and obesity-associated IR, and implicate fTreg cells as adipo-immune drivers and potential therapeutic targets in the treatment of age-associated IR.


Figures

Extended Data Figure 1
Schematic outlining study premise and selected gating strategies used to generate adipo-immune profiles. (a) Schematic outlining study premise. (b–d) Adipo-immune profiles were generated through the use of several distinct antibody cocktails. Here using Foxp3YFP-Cre reporter mice we show how the stromal vascular fraction of VAT was analyzed by flow cytometry to identify several T cell subtypes (b), macrophage subsets (c), and eosinophils and neutrophils (d).
Extended Data Figure 2
Adipo-immune profiles of aged fTreg KO and control mice in VAT, SAT, and spleen. (a) Adipo-immune profiles of aged (~14 months old) fTreg KO and control male mice depicting immune cell abundance, expressed as percentage of CD45.2+ cells. Entirety of immune compartment (top) is further divided into pan-macrophage (middle) and non-macrophage (bottom) pie charts (n=9 mice per group). (b–d) Immune cell abundance between fTreg KO and control mice, expressed as cells per gram of VAT (b), SAT (c), and spleen (d) (n=9 mice per group). Data represents mean ± s.e.m. #, false discovery rate < 2%.
Extended Data Figure 3
Aged fTreg KO mice do not show signs of systemic autoimmunity or breakdown in peripheral tolerance. (a) Percentage of splenic naive CD4+ T cells as defined by CD62hi CD44lo relative to total CD4+ Foxp3YFP-Cre− CD25 population (n=9 mice per group). (b) Representative histology of gastrointestinal tract — duodenum, jejunum, ileum, colon (left to right). (n=3 mice per group). There were no significant lesions observed or differences in inflammation, epithelial changes, or mucosal architecture between the two groups (H&E, x100, scale bar 50 μm). (c) Histopathology score in the small intestine and colon of fTreg KO and control mice. The severity and extent of inflammation and epithelial changes as well as mucosal architecture were each graded on a score of 1 (minimal) to 5 (severe) and added to obtain an overall score over 20. There were minimal inflammatory changes with no significant differences between groups. (d) Multiplex inflammation panel of serum from fTreg KO and control mice (n=4 pooled samples (3 mice per sample) per group). Data represents mean ± s.e.m. *p<0.05, ***p<0.001.
Extended Data Figure 4
Weight-matched cohorts’ body weights and adipocyte size frequency in VAT of aged control and fTreg KO mice. (a) Body weights of fTreg KO and control male mice used in weight-matched metabolic studies in young (12 week old; control n=9; fTreg KO n=9), aged (36 week old; control, n=9 mice; fTreg KO, n=11 mice), and obese (DIO, 12 weeks of HFD starting at 12 weeks old; control n=10; fTreg KO n=10) settings. (b) Frequency of small (0–5,000 μm2), medium (5,000–10,000 μm2), and large (>10,000 μm2) adipocytes in VAT of aged control and fTreg KO mice (n=3 mice per group, 850 adipocytes counted from control mice, 269 adipocytes counted from fTreg KO adipose). Data represents mean ± s.e.m.
Extended Data Figure 5
VAT adipo-immune profiles of obese fTreg KO and control mice. (a) Adipo-immune profiles of diet-induced obese (16 weeks high fat diet started at 12 weeks of age) control (n=6 mice) and fTreg KO (n=8 mice) male mice depicting immune cell abundance, expressed as percentage of CD45.2+ cells. Entirety of immune compartment (top) is further divided into pan-macrophage (middle) and non-macrophage (bottom) pie charts. (b) Immune cell abundance between fTreg KO and control mice, expressed as cells per gram of VAT (n=9 mice per group). Data represents mean ± s.e.m.
Extended Data Figure 6
fTregs are dispensable for TZDs to exert their therapeutic insulin-sensitizing effect. (a) Scheme used for longitudinal interventional study of control and fTreg KO mice which indicates when particular assays were conducted and whose results are described in panels (b–g) where rosiglitazone (Rosi) was introduced in diet after firmly establishing obesity with high-fat diet (HFD) alone for 3 months (n=8 mice per group). (b) Cohort weights during course of study. Black arrow indicates time when Rosi was introduced into diet. (c) Homeostatic model assessment of insulin resistance (HOMA-IR). (d–e) GTT (d) and glucose excursions of GTT (e) described as Area Under Curve (AUC). (f–g) ITT (f) and bar-graph quantitation of relative serum glucose decrease during ITT (g) described as Area Above Curve (AAC). (h) Scheme used for parallel prophylactic study of control and fTreg KO mice whose results are described in panels (i–l) where mice were placed on HFD for 3 months or HFD with Rosi for 3 months (n=8 mice per group). (i) Cohort weights at end of study. (j) HOMA-IR. (k–l) GTT and ITT of control (k) or fTreg KO (l) mice fed HFD or HFD with Rosi. (m) Scheme used to determine temporal relationship of TZD-induced fTreg expansion and TZD-induced insulin-sensitization in wild-type mice whose results are described in panels (n–q) where mice were fed HFD or HFD with Rosi for up to 11 weeks (n=10 mice per group, 5 mice of each group were sacrificed at 5 weeks after diet introduction and remaining 5 mice were sacrificed at 11 weeks). (n) HOMA-IR at 4 weeks. (o) GTT at 5 weeks. (p) ITT at 5 weeks. (q) Relative fTreg enrichment of mice fed HFD with Rosi versus mice fed HFD alone at 5 weeks and 11 weeks. Data represents mean ± s.e.m. *p<0.05, **p<0.01, ***p<0.001.
Extended Data Figure 7
Increased TNFα levels and gene expression pattern of aged fTreg KO adipose tissue is consistent with an improved adipose remodeling capacity. (a) TNFα levels quantified by enzyme linked immunosorbent assay (ELISA) of whole adipose lysate (~40 weeks old, n=6 per group). (b–d) FPKM values of all differentially expressed genes (b), differentially expressed collagens (c), and differentially expressed ECM proteases (d) in VAT from aged fTreg KO and control mice (~40 weeks old, n=3 mice per group). Data represents mean ± s.e.m. ***p<0.001.
Extended Data Figure 8
fTreg gene expression and depletion with anti-ST2 antibody treatment. (a) Expression of several canonical Treg genes across fat and splenic Tregs and fat and splenic Tconv cells. Cells were pooled from 3 and 4 mice before isolating RNA for subsequent RNA-Seq analysis. (b) Expression of ST2 across all hematopoietic cells catalogued in the ImmGen database. Position of adipose CD4+ CD25+ T cells is marked. (c) Total weight before beginning course of anti-ST2 or isotype control antibodies (Day 0) and upon terminal analysis (Day 3). Spleen weight (d) and percentage of splenic naive CD4+ T cells as defined by CD62hi CD44lo relative to total splenic CD45+ CD4+ CD25 T cell population (e) of mice upon terminal analysis (Day 3, n=4 mice per group). Data represents mean ± s.e.m.
Extended Data Figure 9
Aged fTreg KO mice are resistant to short-term, but not persistent, HFD-induced weight gain and insulin resistance. (a–e) Aged control and fTreg KO mice were placed on HFD and monitored throughout course of diet for weight (a), fasting glucose levels (b), fasting serum insulin levels (c), performance on GTT (d), and ITT (e). (Control, n=10; fTreg KO, n=11; Mice were aged 27–29 weeks and weight-matched before HFD was introduced.) Data represents mean ± s.e.m. ns – non-significant, *p<0.05, **p<0.01.
Figure 1
Figure 1. fTregs are selectively enriched in aged mice
(a) Visceral adipose tissue (VAT) adipo-immune profiles (AIP) from mice at 12 weeks (young, n=10), 44 weeks (aged, n=10), and in diet-induced obese (DIO) mice (n=10). Immune cells abundance, expressed as percentage of CD45.2+ cells. (b) Changes in immune cell abundance between indicated groups, expressed as fold change in cell number per gram of VAT. Obese mice were fed a high fat diet for 12 weeks from 12 weeks of age. Data represents mean ± s.e.m. #, false discovery rate < 2%.
Figure 2
Figure 2. fTreg KO mice are protected from general hallmarks of metabolic aging
(a) Representative FACS plots of fTreg KO (Foxp3Cre PPARγfl/fl) and control (Foxp3Cre PPARγ+/+) mice depicting Treg enrichment in VAT and spleen (~15 months, CD45.2+ CD4+ gating). (b) Total body weight (n=15 per group), and lean and fat mass of control and fTreg KO mice (~12 months, n=8 per group). (c) Mass of VAT, SAT, and spleen in aged control and fTreg KO mice (~15 months, n=9 per group). (d) Cumulative food consumption of control and fTreg KO mice (~8–9 months old, n=8 per group). (e–f) Average 24 hour respiratory exchange ratio (RER) of (e) and average VO2 consumed by (f) aged control and fTreg KO mice (~11 months, n=6 per group) (g) Core body temperature of control and fTreg mice (~13 months old, n=9 per group). (h) Principal component analysis of non-macrophage AIPs of young (12 weeks), aged (~15 months) and aged-fTreg KO (~15 months) mice. Data represents mean ± s.e.m. *p<0.05, **p<0.01, ***p<0.001, ****p<0.0001.
Figure 3
Figure 3. Loss of fTregs protects against the clinical hallmarks of age-associated insulin resistance
(a) fTreg levels in VAT from control and fTreg KO (Foxp3Cre PPARγfl/fl) mice in young (control n=6; fTreg KO n=6), aged (~15 months old; control n=10; fTreg KO n=10), and obese (control n=6; fTreg KO n=8) cohorts. (b) Fasting serum glucose and (c) insulin levels in control and fTreg KO mice in young (control n=9; fTreg KO n=9), aged (36 weeks old, control n=9; fTreg KO n=11), and obese (control n=10; fTreg KO n=10) cohorts. (d–f) Glucose tolerance (left) and insulin tolerance tests (right) of control and fTreg KO mice in (d) young (12 weeks, control n=8; fTreg KO n=8), (e) aged (36–37 weeks, control n=8; fTreg KO n=9), and (f) obese (control n=9; fTreg KO n=10) cohorts. (g) Representative H&E staining of visceral adipose tissue (VAT, epididymal) from ~14 month old control (n=3) and fTreg KO mice (n=5) (scale bar, 50 μm). (h) Box and whisker plot of adipocyte size distribution in visceral adipose tissue from control (n=3) and fTreg KO mice (n=3) (~14 months old). (i) Ad libitum fed serum non-esterified fatty acid (NEFA) levels in ~14 months old control (n=9) and fTreg KO mice (n=10). (j) Serum resistin levels in ~14 month old fasted control and fTreg KO mice (n=4 pooled samples (2 mice per sample) per group). (k) Post-prandial glucose uptake in visceral adipose tissue of aged control (n=5) and fTreg KO mice (n=4). (l) Representative H&E staining of liver from ~14 month old control (n=3) and fTreg KO mice (n=5) (scale bar, 200 μm). (m) Hepatic triglyceride levels in ~14 month old control (n=5) and fTreg KO mice (n=3). (n) Fasting serum triglycerides in ~14 month old control (n=9) and fTreg KO mice (n=10). (o) fTregs, expressed as percentage of total CD45.2+ cells, in control (PBS) and IL2/anti-IL2 treated mice (n=3 mice per group). (p) Relative glucose uptake in VAT of 16 week old control and IL2/anti-IL2 treated mice (n=4 mice per group). Data represents mean ± s.e.m. *p<0.05, **p<0.01, ***p<0.001, ****p<0.0001.
Figure 4
Figure 4. fTreg depletion improves adipose glucose uptake
(a) Hierarchical clustering of differentially expressed genes between fat Tregs and Tconv and splenic Tregs and Tconv cells from Foxp3-Thy1.1 mice (47 weeks, cells pooled from 3 to 4 mice, same data set used in b,e). (b) FPKM values of selected genes important for Treg identity and canonical suppressive function. (c–d) In vitro suppression assay of fTregs (fTregs pooled from retired breeders, added at 1:1 ratio with splenic conventional T cells, conducted in triplicates). (c) Representative CFSE tracings of conventional T cells with or without fTregs. Gating indicates percentage of dividing cells. (d) Expansion index of Tconv cells. (e) Fold change in expression levels of differentially expressed genes across fat Tregs and Tconv and splenic Tregs and Tconv cells. Fat Treg cluster genes are labeled in red. Position of ST2 is marked. (f) Representative FACS analysis and (g) quantification of ST2 expression in CD4+ T cells from aged mice (45 weeks, n=5 mice). (h) Total number of ST2+ Tregs and Tconv cells per gram of tissue in VAT and spleen (n=5 mice). (i) FACS histograms and (j) quantification of Tregs (%Foxp3+ of CD45+ CD4+ population) and (k) cells per gram of tissue in VAT and spleen after IL-33 or PBS treatment (16 weeks, n=5 mice per group). (l) Ex vivo glucose uptake in VAT from wild type mice after control or IL-33 treatment (16 week old, n=5 mice per group). (m) Quantification of fTregs and splenic Tregs (%Foxp3+ of CD45+ population) and (n) ex vivo insulin-stimulated glucose uptake in VAT from wild type mice after anti-ST2 depleting antibody or isotype control treatment (~45 weeks old, n=4 mice per group). (o) Adipo-immune model of metabolic aging. Data represents mean ± s.e.m. *p<0.05, **p<0.01, &p=0.053, %p=0.056.

Comment in

References

    1. Ferrante AW., Jr Macrophages fat and the emergence of immunometabolism. J Clin Invest. 2013;123:4992–4993. - PMC - PubMed
    1. Lumeng CN, Saltiel AR. Inflammatory links between obesity and metabolic disease. J Clin Invest. 2011;121:2111–2117. - PMC - PubMed
    1. Mathis D. Immunological Goings-on in Visceral Adipose Tissue. Cell Metab. 2013;17:851–859. - PMC - PubMed
    1. Osborn O, Olefsky JM. The cellular and signaling networkslinking the immune system andmetabolism in disease. Nat Med. 2012;18:363–374. - PubMed
    1. Weisberg SP, et al. Obesity is associated with macrophage accumulation in adipose tissue. J Clin Invest. 2003;112:1796–1808. - PMC - PubMed

Publication types

Associated data