. 2015 Nov 26;527(7579):512-5.
doi: 10.1038/nature15763. Epub 2015 Nov 18.

Sweet and bitter taste in the brain of awake behaving animals

Affiliations

Sweet and bitter taste in the brain of awake behaving animals

Yueqing Peng et al. Nature. .

Abstract

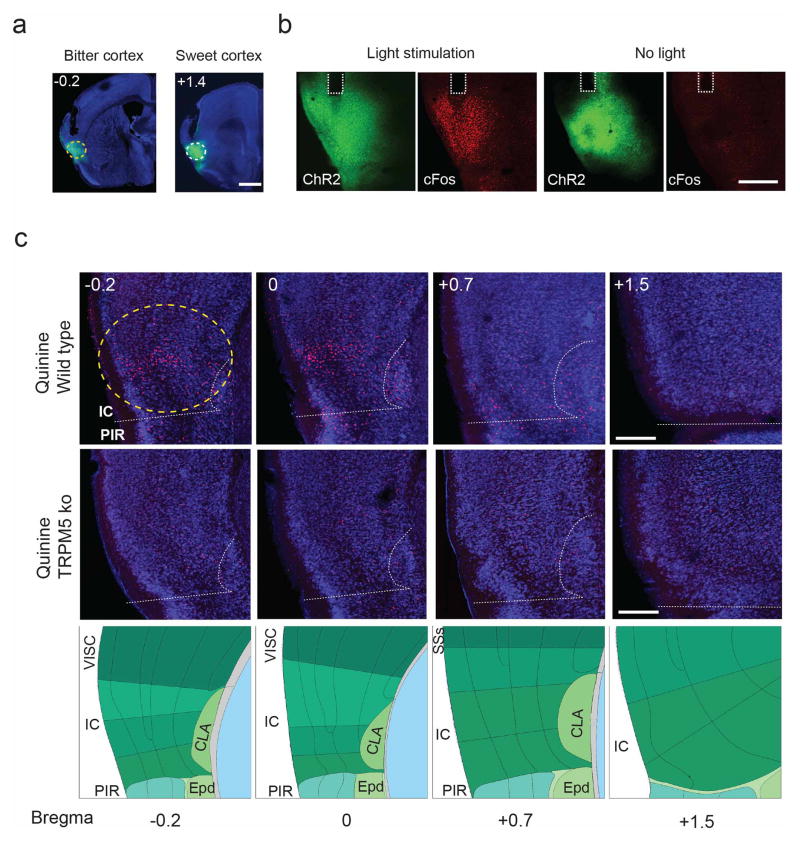
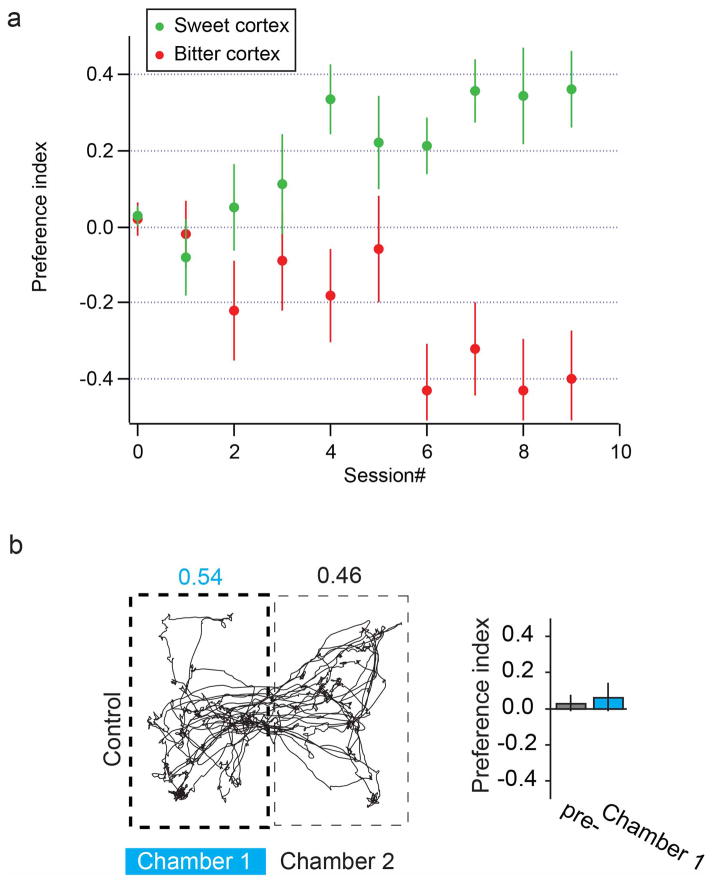
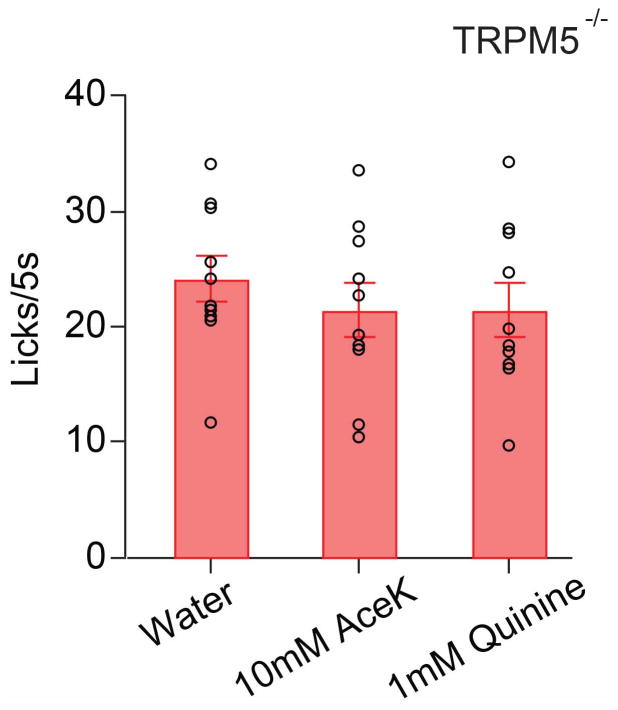
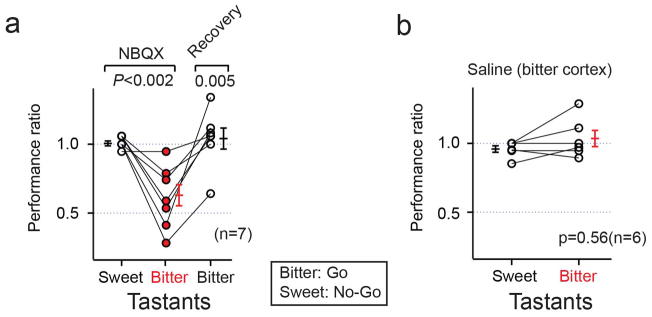
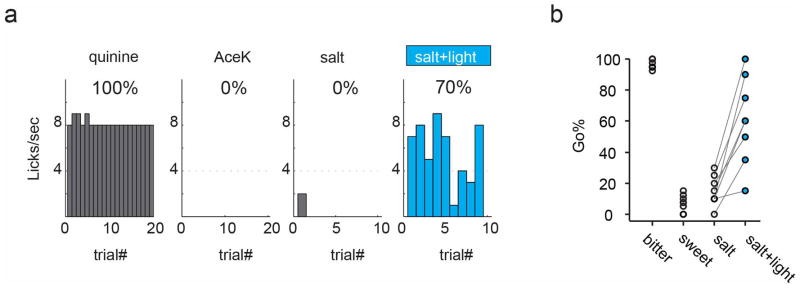
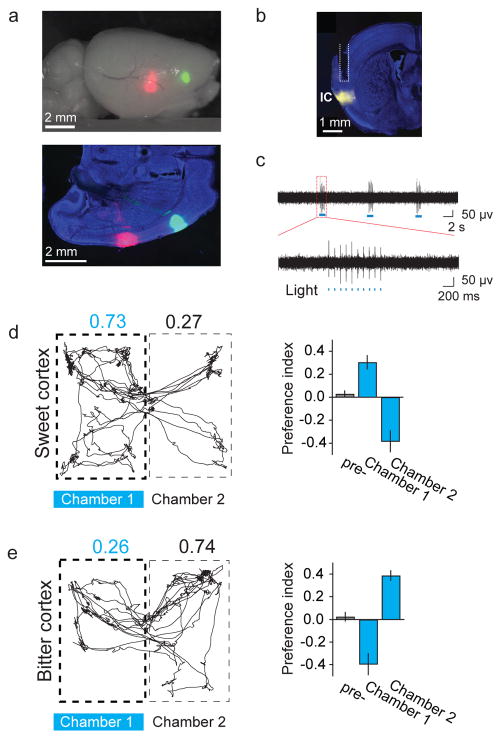
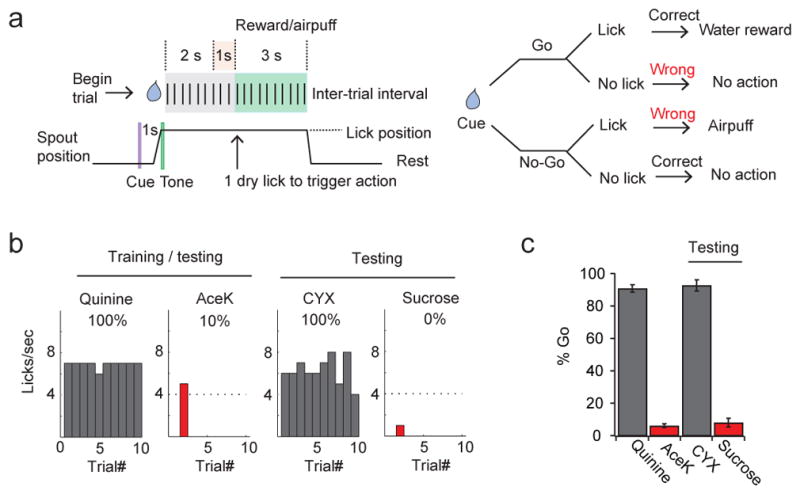
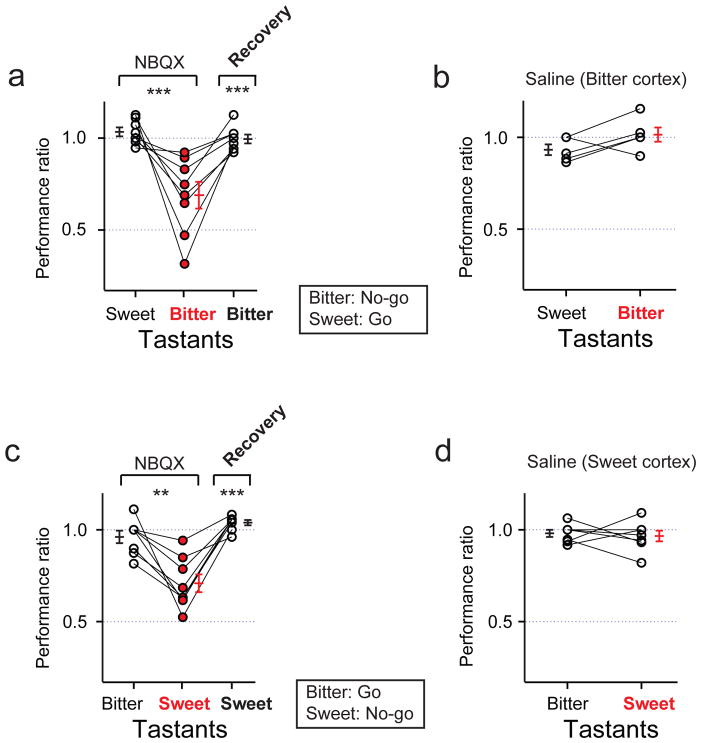
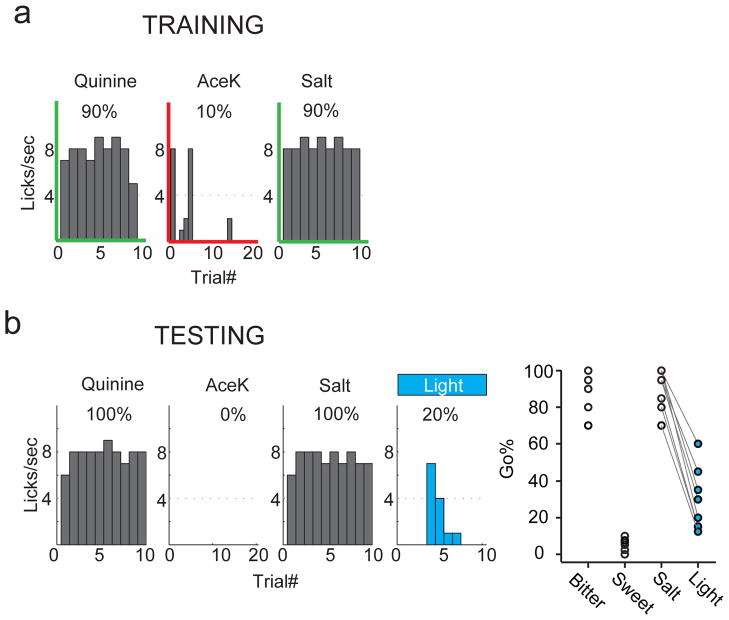
Taste is responsible for evaluating the nutritious content of food, guiding essential appetitive behaviours, preventing the ingestion of toxic substances, and helping to ensure the maintenance of a healthy diet. Sweet and bitter are two of the most salient sensory percepts for humans and other animals; sweet taste allows the identification of energy-rich nutrients whereas bitter warns against the intake of potentially noxious chemicals. In mammals, information from taste receptor cells in the tongue is transmitted through multiple neural stations to the primary gustatory cortex in the brain. Recent imaging studies have shown that sweet and bitter are represented in the primary gustatory cortex by neurons organized in a spatial map, with each taste quality encoded by distinct cortical fields. Here we demonstrate that by manipulating the brain fields representing sweet and bitter taste we directly control an animal's internal representation, sensory perception, and behavioural actions. These results substantiate the segregation of taste qualities in the cortex, expose the innate nature of appetitive and aversive taste responses, and illustrate the ability of gustatory cortex to recapitulate complex behaviours in the absence of sensory input.


Figures

Extended Data Figure 1
Extended Data Figure 1. Expression of ChR2 in taste cortex
a), samples of injection sites in the bitter and sweet cortical fields; shown are coronal sections (Fig. 1a shows a whole mount brain). ChR2-YFP expression (green), nuclei (blue; TO-PRO-3); numbers indicate position relative to bregma, and the dotted area highlight the location of the taste cortical fields (see panel c). (b), Activation of insular neurons in sweet cortex triggers robust c-Fos expression; ChR2-YFP (green), c-Fos (red) after 10 min of in vivo photostimulation at 20 Hz, 20-ms pulses (5 sec laser on, 5 sec laser off, 5 mW). Dashed lines indicate the location of the stimulating cannulae/fiber. (c), c-Fos (red) expression in bitter cortex (bregma 0, −0.2) following bitter tastant stimulation (10 mM quinine; see Methods for details). Note the absence of c-Fos expression in the middle (bregma +0.7) and sweet insular cortex (bregma +1.5). Importantly, specific labeling is abolished in taste blind animals (TrpM5 knockouts; middle row). The bottom row shows a diagram of the corresponding brain areas, adapted from the Allen Brain Atlas. Scale bars: 1 mm (a), 500 μm (b), 300 μm (c). PIR refers to piriform cortex and IC refers to insular cortex
Extended Data Figure 2
Extended Data Figure 2. Acquisition of Place preference
a, The graph shows the development of “place preference” as a function of session number (each session was 30 min of training and 5 min of “after-training” testing in the absence of light stimulation; n = 13 for sweet cortex, n = 15 for bitter cortex; see text and Methods for details). The average of sessions 6–8 were used in Fig. 1. Values are mean ± s.e.m. b, Representative mouse track and quantitation of preference index in control GFP-expressing mice; note no difference in preference between chambers (n = 14; Mann-Whitney U test, P = 0.74). Values are mean ± s.e.m.
Extended Data Figure 3
Extended Data Figure 3. Photostimulation of insular cortical fields overcomes natural taste valence
a, Quantitation of licking responses in mice expressing ChR2 in the bitter cortical fields (n = 13, ANOVA test, Tukey’s HSD post hoc). Photostimulation of the bitter cortical fields significantly suppress the natural attraction of the sweet tastant (4 mM AceK). b, Quantitation of licking responses in mice expressing ChR2 in the sweet cortical fields (n = 14, ANOVA test, Tukey’s HSD post hoc). Photostimulation of the sweet cortical fields significantly overcomes the natural aversion of the bitter tastant (1 mM quinine). In both experiments, mice were mildly water-restrained (exhibiting an average of ≤ 30 licks per 5-sec water trial) such that they were motivated to drink the bitter and while showing attraction to sweet. Values are mean ± s.e.m.
Extended Data Figure 4
Extended Data Figure 4. TrpM5 knockout mice do not taste sweet and bitter
Taste preference was tested in the head-restrained assay for wild type and TRPM5 homozygous mutants. Tastants were randomly delivered for a 5-sec window (10 trials/each). No significant difference was observed between water and sweet/bitter tastants in TRPM5 knockouts (ANOVA test, P = 0.62, n = 10; see ref for more details); circles indicate individual animals, and the bar graphs show mean ± s.e.m.
Extended Data Figure 5
Extended Data Figure 5. Inactivation of the bitter cortical fields in animals trained to go to bitter and no-go to sweet
a, Quantitation of performance ratios before and after bilateral silencing of the bitter cortical fields (NBQX, 5 mg/ml; n = 7) in animals trained to go to bitter and no-go to sweet. Note the impact in bitter taste discrimination, but no significant effect in sweet taste (Mann-Whitney U test, P < 0.002). After washout of the drug, the animal’s ability to recognize bitter is restored (Mann-Whitney U test, P < 0.005). b, Quantitation of performance ratios with saline (0.9%) control in the bitter cortical fields (n = 6, Mann-Whitney U test, P = 0.56). In both experiments, mice were trained with quinine and AceK, and tested with two pairs of sweet/bitter tastants (0.1 mM quinine and 2 mM AceK, 2 μM cycloheximide and 50 mM sucrose; see Methods for details).
Extended Data Figure 6
Extended Data Figure 6. Sweet and low salt are appetitive tastants
Taste preference was tested during a 10-min window using the head-restrained assay (see Methods for details). Four tastants were randomly delivered to animals for 5-sec each (10 trials per tastant) . Note that animals show significant attraction to sweet (AceK) and low salt (NaCl), but strong aversion to bitter (n = 11, ANOVA test, Tukey’s HSD post hoc); circles indicate individual animals, and the bar graphs show mean ± s.e.m. These conditions were used in the experiments described in Fig 5 and Extended Data Fig. 7.
Extended Data Figure 7
Extended Data Figure 7. Cross-generalization between orally supplied taste stimuli and photostimulation of the bitter cortex
a, Representative histograms illustrating cross-generalization between taste stimulation and photostimulation of the bitter cortical field. The mouse was trained to go to bitter (0.5 mM quinine) and no-go to sweet (4 mM AceK) and low-salt (20 mM NaCl). b, Quantitation of the responses from individual animals to quinine, AceK, salt and salt + light (n = 8, Mann-Whitney U test, P < 0.002). See also Fig 4.
Figure 1
Figure 1. Place preference by photostimulation of the sweet and bitter cortical fields
a, Sample injection of reporters in stereotactic coordinates defining the sweet and bitter cortical fields. Upper panel shows sweet cortex labeled with AAV-GFP and bitter cortex with AAV-TdTomato; lower panel shows a horizontal section. See Extended Data Figure 1 for additional data. b, Coronal section of a mouse brain (bregma −0.2) stained with TO-PRO-3 (blue). Shown is a representative histological sample of the bitter cortical field expressing ChR2-YFP, illustrating the location and trajectory (dotted lines) of the implanted guide cannula; IC, insular cortex. c, In vivo recording of ChR2-expressing insular cortical neurons in response to light stimulation (10 pulses, 10 Hz). The expanded traces show responses to each light pulse (blue bars below the trace). d, Left, representative tracking of a mouse during the 5 min preference test in a two-chamber arena; Chamber 1 was coupled to light stimulation of the sweet cortical field during the training sessions. Shown are the fractions of time spent in each chamber. Right, quantitation of preference index before (pre-) and after (Chamber 1) training with photostimulation of the sweet cortical field (n = 13 animals; Mann-Whitney U test, P < 0.003). Preference can be readily reversed by light stimulation in the opposing side (Chamber 2, n = 6; P < 0.02). e, Representative mouse track and quantitation of preference index in mice expressing ChR2 in the bitter cortical field; note significant aversion to the chamber coupled to photostimulation (Chamber 1, n = 15; Mann-Whitney U test, P < 0.005); this behavioral aversion can be switched to the opposite chamber by re-exposure to photostimulation in Chamber 2 (n = 4; P < 0.03). Values are mean ± s.e.m. See Extended Data Fig. 2b for GFP control injections.
Figure 2
Figure 2. Photostimulation of bitter and sweet cortical fields drives aversive and appetitive behaviors
a, b, Representative raster plots (left panel) and histograms (right panel) illustrating licking events during a 5 sec licking window in the presence (blue) or absence (open) of light stimulation of (a) the bitter and (b) the sweet cortical field. The purple line at time zero indicates the start of each trial, and the green line indicates the onset of water delivery. c, d, Quantitation of licking responses with and without light stimulation in (c) the bitter cortical field (n = 34, Mann-Whitney U test, P < 4×10⁻¹²) or (d) sweet cortical field (n = 31, Mann-Whitney U test, P < 5×10⁻⁵) of wild type mice. e, f, Quantitation of licking responses in TrpM5 knockout mice (e, bitter cortical fields, n = 9, Mann-Whitney U test, P < 5×10⁻⁵; f, sweet cortical fields, n = 10, Mann-Whitney U test, P = 0.001). Each point indicates data from an individual mouse before and after photostimulation.
Figure 3
Figure 3. Go/no-go taste discrimination task in head-restrained mice
a, Schematic and flow chart of the go/no-go taste discrimination task. Each trial starts with a visual cue (purple line), followed 1 sec later by a tone (green line) to alert mice to initiate licking. After sampling, mice were given 3 sec to continue to lick (go) or withhold licking (no-go) in response to the test tastant. For go trials, mice were rewarded with water (3 sec) if they chose to lick within the 3-sec interval. For no-go trials, mice received a mild air puff to the eyelid if they failed to withhold licking. After the reward/penalty phase, the spout retracted and was cleared for the next trial; inter-trial intervals were 8 sec. b, Representative histograms illustrating recognition and generalization within bitters and sweets. This animal was trained and tested with 4 mM Acek (sweet no-go) and 0.5 mM quinine (bitter go), and then assayed with 100 mM sucrose and 10 μM cycloheximide (CYX). c, Quantitation in 9 animals, demonstrating highly reliable taste recognition and discrimination. Values are mean ± s.e.m.
Figure 4
Figure 4. Inactivation of the bitter and sweet cortical fields disrupts taste discrimination
a, Quantitation of performance ratios (see methods) before and after bilateral silencing (NBQX, 5 mg/ml) of the bitter cortical fields (n = 8); animals were trained to no-go to bitter and go to sweet. Note the impact in bitter taste discrimination, but no significant effect in sweet taste. After washout of the drug, the animal’s ability to recognize bitter is restored. Comparable results are obtained when animals are instead trained to go to bitter and no-go to sweet (Extended Data Fig. 2). b, Quantitation of performance ratios with saline controls in bitter cortical fields; there is no significant effect on sweet or bitter taste (n = 5; Mann-Whitney U test, P = 0.14). c, Quantitation of performance ratios with bilateral injection of NBQX in the sweet cortical fields (n = 8). Animals were trained to no-go to sweet and go to bitter; note significant deficit in sweet taste, but no effect in bitter taste. After washout of the drug, the animal’s ability to recognize sweet is restored. d, Saline injections in the sweet cortical fields have no significant effect on bitter or sweet taste (n = 7; Mann-Whitney U test, P = 0.80). Values are mean ± s.e.m. Mann-Whitney U test, **P < 0.01, ***P < 0.001.
Figure 5
Figure 5. Cross-generalization between orally supplied taste stimuli and photostimulation of the sweet cortex
a, Representative histograms illustrating mouse performance during a training session in the go/no-go discrimination task. The mouse was trained to go to bitter (0.5 mM quinine) and low-salt (20 mM NaCl), and no-go to sweet (4 mM AceK). Note that both bitter (aversive) and low salt (attractive) were used in the same branch of the behavioral task (go) to exclude the valence as an identifier. b, Left, representative histograms illustrating cross-generalization between taste stimulation and photostimulation of the sweet cortical field. Right, quantitation of the responses from individual animals to quinine, AceK, salt and salt + light (n = 8, Mann-Whitney U test, P < 0.0002).

Comment in

  • Sensory systems: Tasting in the brain.
    Yates D. Yates D. Nat Rev Neurosci. 2016 Jan;17(1):1. doi: 10.1038/nrn.2015.17. Epub 2015 Dec 10. Nat Rev Neurosci. 2016. PMID: 26656255 No abstract available.
  • Is tasting innate?
    Spielman AI, Brand JG. Spielman AI, et al. Oral Dis. 2016 May;22(4):251-2. doi: 10.1111/odi.12460. Epub 2016 Mar 10. Oral Dis. 2016. PMID: 26859421 No abstract available.

References

    1. Lindemann B. Receptors and transduction in taste. Nature. 2001;413:219–225. - PubMed
    1. Yamamoto T. Taste responses of cortical neurons. Prog Neurobiol. 1984;23:273–315. - PubMed
    1. Accolla R, Bathellier B, Petersen CC, Carleton A. Differential spatial representation of taste modalities in the rat gustatory cortex. J Neurosci. 2007;27:1396–1404. - PMC - PubMed
    1. Chen X, Gabitto M, Peng Y, Ryba NJ, Zuker CS. A gustotopic map of taste qualities in the mammalian brain. Science. 2011;333:1262–1266. - PMC - PubMed
    1. Boyden ES, Zhang F, Bamberg E, Nagel G, Deisseroth K. Millisecond-timescale, genetically targeted optical control of neural activity. Nat Neurosci. 2005;8:1263–1268. - PubMed

Publication types

MeSH terms